Posts tagged ‘VIX’
Green Lights Everywhere… But Is It Time to Tap the Brakes?

The economic and market fundamentals appear to be flashing green lights everywhere. Growth is strong, inflation has cooled, and financial conditions have eased. Yet even with clear skies and open roads, experienced drivers know conditions can change quickly. It may not be time to slam on the brakes—but it could be time to keep a foot hovering nearby.
After the Federal Reserve aggressively applied the brakes in 2022 with seven rate hikes—taking the federal funds rate from 0.25% to 4.50%—the stock market declined nearly 19%. Since rates peaked at 5.50% in 2023, the Fed has cut rates six times, lowering them by a cumulative 1.75% to approximately 3.75%. Those cuts have helped pave the way for a smoother ride, providing a meaningful tailwind to equity markets.
That said, the most recent quarter-point cut produced mixed results. Last month, the Dow Jones Industrial Average rose +0.7%, the S&P 500 was essentially flat at –0.1%, and the NASDAQ lagged with a –0.5% decline.
Navigating the Winning Streak
We have encountered a few economic speed bumps along the way—tariffs and geopolitical events earlier in 2025, for example—but once investors realized those tariffs were more bark than bite (as I discussed previously in Tariff Sheriff), stocks resumed their impressive run. The market has now delivered three consecutive years of strong returns: 2023 (+24%), 2024 (+23%), and 2025 (+16%).
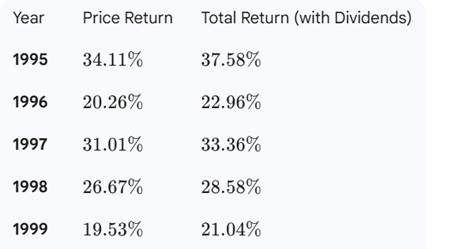
With these strong gains, today’s environment can feel like cruising on a national highway—clear roads, sunny skies, cruise control engaged, and little traffic in sight. The momentum could continue. Three strong years in a row do not rule out a fourth or fifth. In fact, the late 1990s offer a powerful reminder: from 1995 through 2000, the stock market averaged approximately 29% annual returns through the March 2000 peak (see table below). However, once the technology bubble burst, it took more than 13 years for the market to reclaim new year-end highs.
Source: Gemini
After more than three decades of investing, one lesson remains clear: trees can grow for years—but they do not grow to the sky forever. Bull markets often last longer than expected, but they eventually end.
Why the Forecast Looks Rosy
Several factors are supporting today’s strong market backdrop:
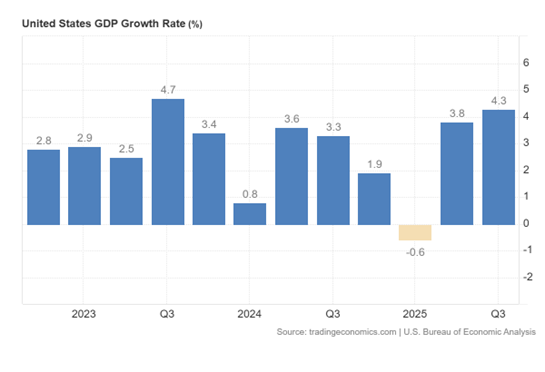
- Strong Economic Growth: Third-quarter GDP growth of 4.3% marked the fastest expansion in two years (see chart below)
Source: Trading Economics
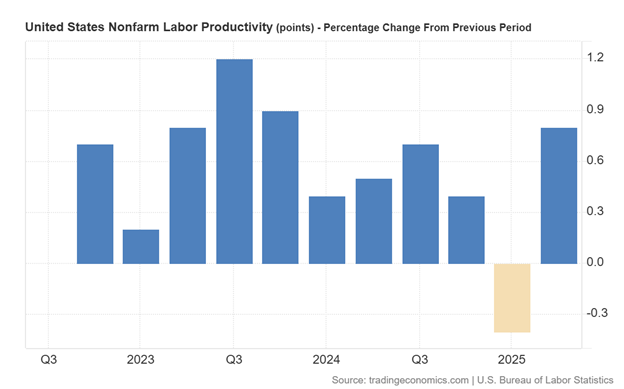
- AI-Driven Productivity: GDP growth has remained robust even as unemployment has risen from 4.0% earlier in the year to approximately 4.6% today. Growth outpacing employment is the definition of productivity, and the proliferation of artificial intelligence is accelerating this trend. Large companies such as Amazon.com (AMZN), Microsoft (MSFT), Alphabet-Google (GOOGL), and Meta Platforms (META) have reduced headcount significantly by tens of thousands in recent years while revenues and profits continue to surge (see also Mag 7 Takes Cash to the Bank).
Source: Trading Economics
- Taming Inflation: Crude oil prices have fallen roughly 20% over the last year, and Owner’s Equivalent Rent (which makes up about one-third of CPI inflation) has been steadily declining—both positive signals for inflation pressures ahead (see chart below).

Source: Calafia Beach Pundit
- Lapping Tariffs: Tariffs represented a one-time price increase. As we move into 2026, their inflationary impact should diminish as those increases roll off.
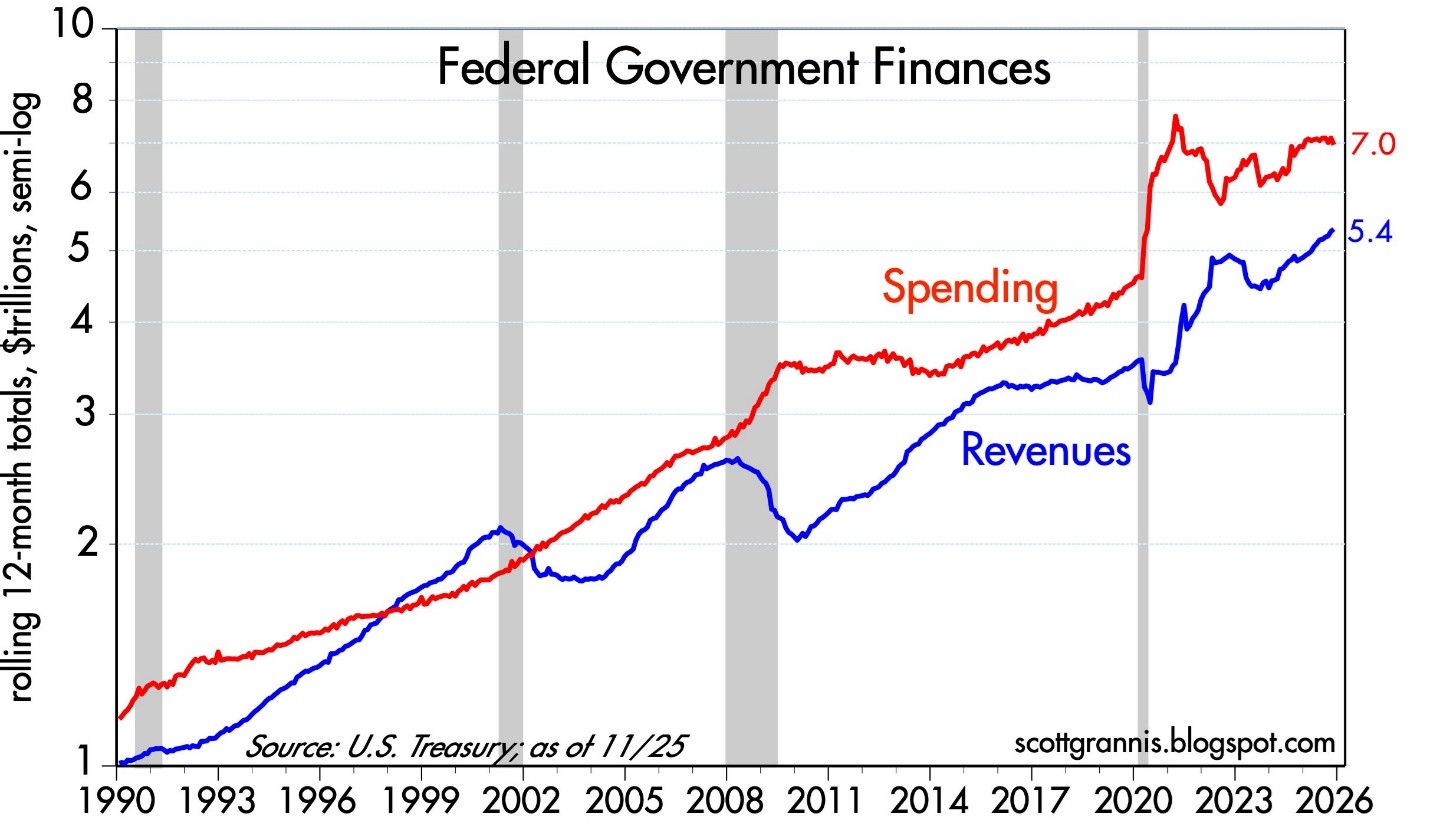
- Narrowing Budget Deficit: While debt and deficits remain headline risks, federal spending has been flat over the past year while revenues have increased roughly 10%, according to Scott Grannis (see chart below).
Source: Calafia Beach Pundit
- Tax Cuts & Higher Refunds Ahead: Many provisions of the One Big Beautiful Bill (OBBB) will be felt more fully in 2026, including 100% bonus depreciation for businesses, higher SALT deduction caps, increased standard deductions, no tax on tips or overtime, and a higher Child Tax Credit (CTC). Collectively, these could result in refunds up to $1,000 higher per individual.
Together, these factors could support continued market strength into 2026. But weather, road conditions, and markets can change quickly.
Reasons to Keep Your Foot Near the Brake Pedal
While the road looks smooth, several caution signs deserve attention:
- Elevated Valuations: Forward price-to-earnings ratios (P/E) are at their highest levels since the late 1990s, outside of the brief post-COVID period. (see chart below).
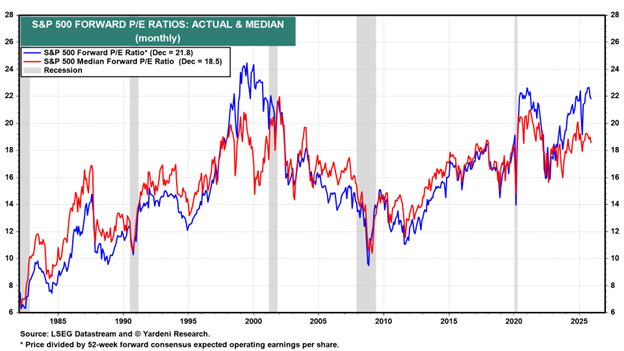
Source: Yardeni Research
- Animal Spirits Are Back: Speculation has expanded well beyond traditional markets. Prediction platforms such as Kalshi, Polymarket, FanDuel, DraftKings, Robinhood, Coinbase, and others now allow bets on everything from political outcomes to economic data—further evidence of speculative behavior.
- Gold and Silver Speculation: Despite a relatively stable U.S. dollar over the past six months, gold rose +64% and silver catapulted +145% in 2025—moves difficult to justify by fundamentals alone (see chart below).

Source: MarketSurge
- Investor Complacency: The Volatility Index (VIX), often called the “fear gauge,” currently hovers near 15, well below its long-term average of 20. Historically, true fear doesn’t surface until readings exceed 25.
- Market Concentration: The “Magnificent 7” stocks represent roughly 1% of the companies in the S&P 500 but account for about 37% of the index’s weighting (see Mag 7 Takes Cash to the Bank)—a concentration reminiscent of the late 1990s. When leadership narrows, downturns can be sharper.
The Sidoxia View
At Sidoxia Capital Management, we have implemented all-weather, time-tested strategies through decades of both bull and bear markets. We believe diversification and disciplined risk management are essential—not fruitless prediction attempts. Rather than attempting to time short-term market moves, we focus on adapting portfolios to changing conditions and navigating inevitable financial potholes.
We don’t always get it right, but over the long run, this approach has allowed us to earn and retain the trust, loyalty, and confidence of our clients.
After three years of strong performance, it’s easy to assume clear roads and blue skies will continue indefinitely. But history teaches us that the most dangerous moments often occur when confidence is highest. This is not a call to abandon the journey—only a reminder to stay alert. When markets accelerate this quickly, discipline, diversification, and risk management matter more than ever.
Wade W. Slome, CFA, CFP®
Plan. Invest. Prosper.
This article is an excerpt from a previously released Sidoxia Capital Management complimentary newsletter (Jan. 2, 2026). Subscribe Here to view all monthly articles.
DISCLOSURE: Sidoxia Capital Management (SCM) and some of its clients hold positions in MSFT, GOOGL, AMZN, META, and certain exchange traded funds (ETFs), but at the time of publishing had no direct position in ORCL or any other security referenced in this article. No information accessed through the Investing Caffeine (IC) website constitutes investment, financial, legal, tax or other advice nor is to be relied on in making an investment or other decision. Please read disclosure language on IC Contact page.
The Rollercoaster December to Remember

Last month turned out to be a memorable one for stock market investors, but unforgettable for many of the wrong reasons. Santa Claus left more dark coal than shiny gifts, judging by the -9.2% correction last month in the S&P 500 index, making it the worst December since 1931. Overall, the damage for the year was much more palatable, down -6.2% for the 12-month period. This result contrasts with the +9.5% gain in 2016, +19.4% gain in 2018, and +276.0% gain achieved since the March 2009-low.
If I were to compare 2017 and 2018 to an amusement park, 2017 was more like a calm train ride (slow, smooth, and steady), while 2018 was more like a rollercoaster (fast, and rocky with lots of ups and downs). Stock market history tells us that on average stock prices should fall -5% three times per year and -10% one-time per year. Well, 2017 was like a walk in the park if you consider there were no -5% or -10% dips during the year, whereas in 2018, we had -12% and -20% corrections, before bouncing somewhat during the last week of the year. Rollercoaster rides can be fun, but if the bumpy ride lasts too long, park visitors will likely need a sick sack.
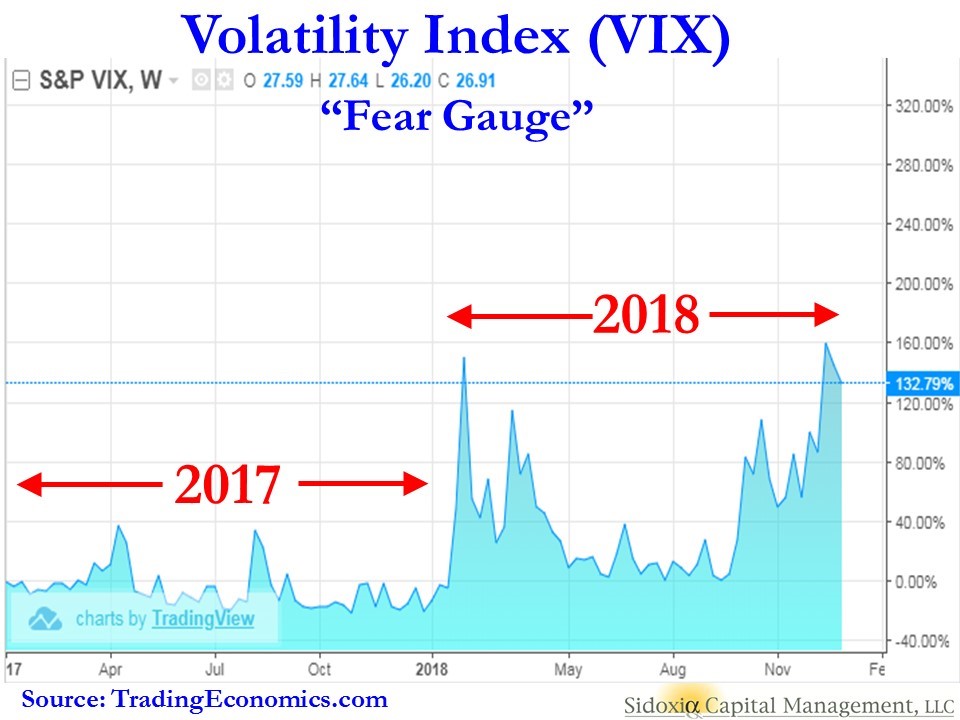
The heightened level of volatility can be seen in the Fear Gauge or the Volatility Index – VIX (see chart above), which has been bouncing around like a spiking cardiogram in response to the following news headlines:
- Government Shutdown
- Global Trade (China)
- Federal Reserve Interest Rate Policy
- Mueller Investigation
- New Balance of Power in Congress
- Brexit Deal Uncertainty
- Recession Fears
While there have been some signs of slowing growth in key areas like automobile and home sales, the overall economy has been doing quite well on the back of consumer spending, which accounts for upwards of 70% of our country’s economic activity (see GDP chart below). In fact, recently released Mastercard consumer retail holiday spending data grew +5.1% to a record level exceeding $850 billion.
Corporations, which are also helping propel continued growth in our $20 trillion economy, are producing record profits, as you can see from the chart below. This in turn has led to an amazingly low unemployment rate of 3.7%, the lowest jobless figure posted in 49 years.
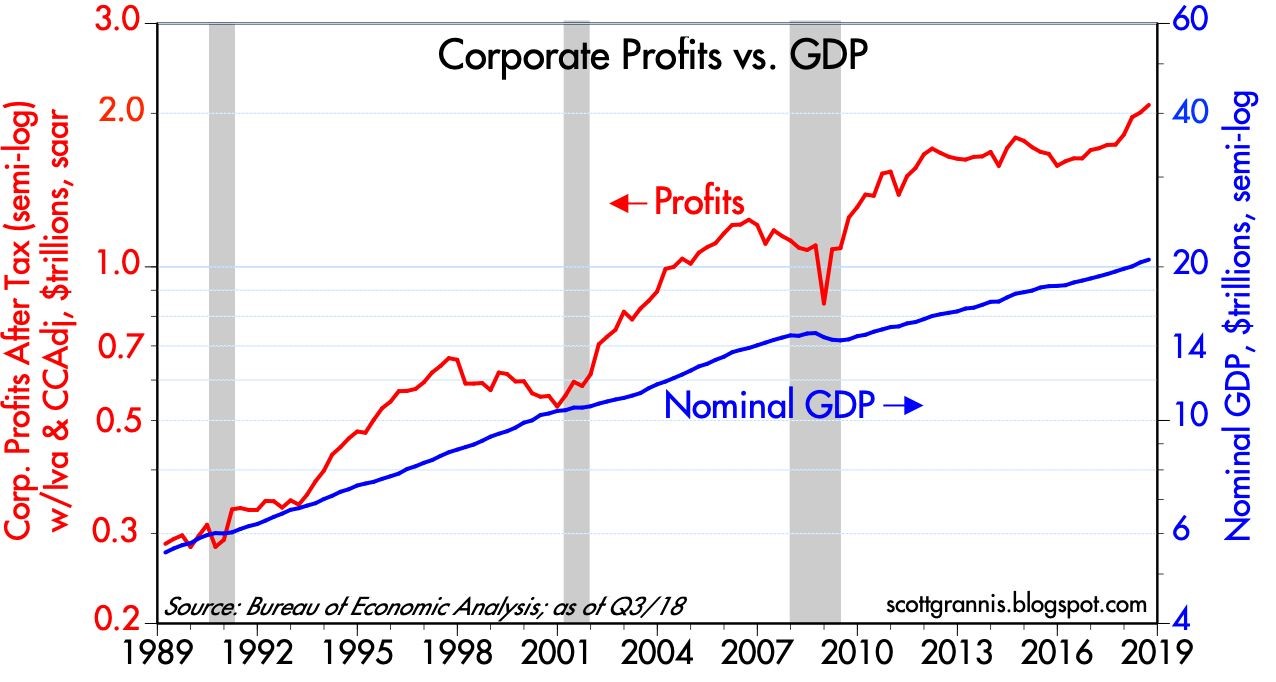
Source: Calafia Beach Pundit
Overall, economic fundamentals may remain strong, but in the face of the positive data points, fears of an impending recession overpowered the good news last month, resulting in stock prices that are much more attractively valued right now. For example, if you are shopping at a department store, it’s much more advantageous for the buyer to purchase items on sale versus paying full price. Or as the most successful investor of all-time, Warren Buffett, famously notes, “Be fearful when others are greedy and greedy only when others are fearful.” And recently, investors have been very fearful. As you can see from the chart below, prices as measured by the Price-Earnings ratio (P/E) are below the long-term, multi-decade average. This fact is even more relevant in light of the historically low inflation and interest rates (10-Year Treasury Note at 2.69%). Unsurprisingly, during the 1970s and early 1980s, double digit interest rates and inflation were relatively high leading to low, single digit P/E stock ratios over many years.
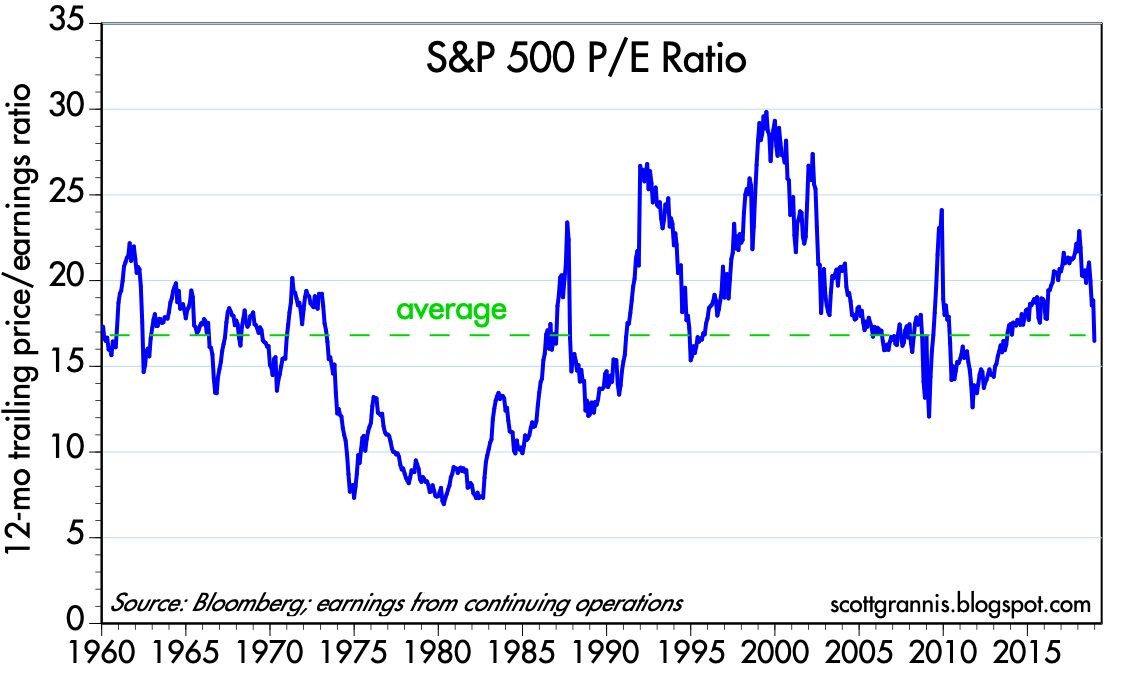
Source: Calafia Beach Pundit
Just because stock prices went down last month, does not mean they cannot go even lower. However, the rollercoaster ride experienced in recent months, coupled with the fresh turn of the calendar year, provide investors a perfect opportunity to revisit their asset allocation and potentially rebalance your portfolios to meet your long-term objectives and constraints. More attractive equity prices improves the timing of this exercise. Regardless, the adrenaline-filled ups and downs may be feel scary now, but the ride will be more enjoyable if you buckle up don’t lose sight of your long-term goals.

Wade W. Slome, CFA, CFP®
Plan. Invest. Prosper.
This article is an excerpt from a previously released Sidoxia Capital Management complimentary newsletter (January 4, 2018). Subscribe on the right side of the page for the complete text.
DISCLOSURE: Sidoxia Capital Management (SCM) and some of its clients hold positions and certain exchange traded funds (ETFs), but at the time of publishing had no direct position in any other security referenced in this article. No information accessed through the Investing Caffeine (IC) website constitutes investment, financial, legal, tax or other advice nor is to be relied on in making an investment or other decision. Please read disclosure language on IC Contact page.
Will the Halloween Trick Turn into a Holiday Treat?

The interest rate boogeyman came out in October as fears of an overzealous Federal Reserve monetary policy paralyzed investors into thinking rising interest rates could murder the economy into recession. But other ghostly issues frightened the stock market last month as well, including mid-term elections, heightening trade war tensions, a weakening Chinese economy, a fragile European economy (especially Italy), rising oil prices, weakening emerging market economies, anti-Semitism, politically motivated bomb threats, and anxiety over a potential recession after an aged economic expansion embarks on its 10th consecutive year of gains.
This ghoulish short-term backdrop resulted in the Dow Jones Industrial Average suffering a -5.1% drop last month, and the technology-heavy NASDAQ index screamed even lower by -9.2%. The results for the full year 2018 look more constructive – the S&P 500 is up +1.4% and the NASDAQ has climbed +5.8%.
Should the dreadful October result be surprising? Historically speaking, seasonality in the stock market has been quite scary during the month of October, especially if you consider the spooky stock Market Crash of 1929 (-19.7%) , the 1987 Crash (-21.5%), and the bloody collapse during the October 2008 Financial Crisis (-16.8%). There is good news, however. Seasonally, the holiday months of November and December typically tend to treat investors more cheerfully during the so-called “Santa Claus Rally” period. Since 1950 through 2017, the average return for stocks during November has been +1.4% (45 up years and 23 down years). For December, the results are even better at +1.5% (51 up years and 17 down years).
| November (1950-2017) | December (1950-2017) | |||
| Up Years | Down Years | Up Years | Down Years | |
| 2017 2.40% | 2015 -0.02% | 2017 1.08% | 2015 -1.87% | |
| 2016 3.29% | 2011 -0.32% | 2016 1.76% | 2014 -0.33% | |
| 2014 2.45% | 2010 -0.44% | 2013 2.31% | 2007 -0.76% | |
| 2013 2.68% | 2008 -7.48% | 2012 0.70% | 2005 -0.10% | |
| 2012 0.28% | 2007 -4.18% | 2011 0.86% | 2002 -6.03% | |
| 2009 5.74% | 2000 -8.01% | 2010 5.99% | 1996 -2.15% | |
| 2006 1.66% | 1994 -3.93% | 2009 1.48% | 1986 -2.83% | |
| 2005 3.52% | 1993 -1.29% | 2008 1.65% | 1983 -0.87% | |
| 2004 3.86% | 1991 -4.39% | 2006 1.26% | 1981 -3.01% | |
| 2003 0.71% | 1988 -1.89% | 2004 3.25% | 1980 -3.39% | |
| 2002 5.71% | 1987 -8.51% | 2003 5.08% | 1975 -1.15% | |
| 2001 7.52% | 1984 -1.51% | 2001 0.76% | 1974 -1.78% | |
| 1999 1.92% | 1976 -0.78% | 2000 0.41% | 1969 -1.87% | |
| 1998 5.91% | 1974 -5.32% | 1999 5.78% | 1968 -4.16% | |
| 1997 4.46% | 1973 -11.39% | 1998 5.64% | 1966 -0.15% | |
| 1996 7.34% | 1971 -0.25% | 1997 1.57% | 1961 -0.32% | |
| 1995 4.10% | 1969 -3.41% | 1995 1.74% | 1957 -3.31% | |
| 1992 3.03% | 1965 -0.88% | 1994 1.26% | ||
| 1990 6.00% | 1964 -0.52% | 1993 0.98% | ||
| 1989 1.65% | 1963 -1.05% | 1992 1.01% | ||
| 1986 2.15% | 1956 -3.10% | 1991 11.19% | ||
| 1985 6.51% | 1951 -0.95% | 1990 2.48% | ||
| 1983 1.74% | 1950 -0.26% | 1989 2.14% | ||
| 1982 3.60% | 1988 1.48% | |||
| 1981 3.27% | 1987 7.28% | |||
| 1980 10.24% | 1985 4.51% | |||
| 1979 4.26% | 1984 2.24% | |||
| 1978 0.61% | 1982 1.50% | |||
| 1977 2.86% | 1979 1.68% | |||
| 1975 2.47% | 1978 1.16% | |||
| 1972 4.56% | 1977 0.28% | |||
| 1970 4.74% | 1976 5.25% | |||
| 1968 4.80% | 1973 1.79% | |||
| 1967 0.75% | 1972 1.18% | |||
| 1966 0.31% | 1971 8.62% | |||
| 1962 10.16% | 1970 5.68% | |||
| 1961 3.77% | 1967 2.63% | |||
| 1960 2.97% | 1965 0.90% | |||
| 1959 1.52% | 1964 0.39% | |||
| 1958 1.78% | 1963 2.44% | |||
| 1957 3.17% | 1962 1.35% | |||
| 1955 7.64% | 1960 5.08% | |||
| 1954 7.71% | 1959 2.03% | |||
| 1953 0.41% | 1958 4.78% | |||
| 1952 4.31% | 1956 1.50% | |||
| 1955 0.29% | ||||
| 1954 5.85% | ||||
| 1953 0.12% | ||||
| 1952 3.47% | ||||
| 1951 3.62% | ||||
| 1950 3.81% | ||||
While the last 31 days may have been distressing, at Sidoxia we understand that terrifying short-term volatility is a necessary requirement for long-term investors, if you desire the sweet appreciation of long-term gains. Fortunately at Sidoxia our long-term investors have benefited quite handsomely over the last 10 years from our half-glass-full perspective. The name Sidoxia actually is derived from the Greek word for “optimism” (aisiodoxia).
Performance has been fruitful in recent years, but the almost decade-long bull market has not been all smooth sailing (see Series of Unfortunate Events), as you can see from the undulating 10-year chart below (2008-2018). Do you remember the Flash Crash, Debt Ceiling, Greek Crisis, Arab Spring, Crimea, Ebola, Sequestration, and Taper Tantrum, among many other events? Similar to the volatility experienced in recent weeks, all these aforementioned events caused scary downdrafts as well.
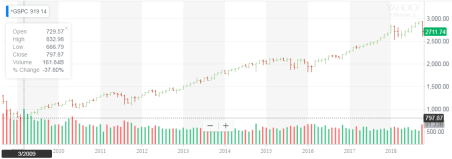
The S&P 500 hit a low of 666 in March 2009, but even with the significant fall last month, the stock market has more than quadrupled in value to 2,711 today.
The compounding benefits of long-term investing are quite evident over the last decade when you consider the record profits of the stock market. Compounding benefits apply to individual stocks as well, and Sidoxia and its clients have experienced this first hand through ownership in positions in stocks like Amazon.com Inc. (+2,692% in 10 years), Apple Inc. (+1,324%), and Google (parent Alphabet) (+507%), and many other less-familiar growth companies have allowed our client portfolios and hedge fund to outperform their benchmarks over longer periods of time. Although we are proud of our long-term performance, we have definitely had periods of under performance, and there will come a time in which a more defensive stance will be required. However, panicking is very rarely the best course of action when you are talking about your long-term investment strategy. Staying the course is paramount.
During periods of heightened volatility, like we experienced in October, the importance of owning a broadly diversified portfolio across asset classes (including stocks, bonds, real estate, commodities, emerging markets, growth, value, etc.) is worth noting. Of course an asset allocation should be followed according to a risk tolerance appropriate for your unique circumstances. As financial markets and interest rates gyrate, investors should get in the practice of rebalancing portfolios. For example, at Sidoxia, we are consistently harvesting our gains and opportunistically redeploying those proceeds into unloved areas in which we see better long-term appreciation opportunities. This whole investment process is designed for reducing risk and maximizing returns.
As in some famously scary stock market periods in the past, October turned out to be another frightening month for investors. The good news is that we have seen this scary movie many times in the past, and we have lived to tell the tale. The economy remains strong, corporate profits are at record levels and still rising, consumer and business confidence levels are near all-time highs, and interest rates remain historically low despite the Fed’s gradual interest rate hiking policy. While Halloween has definitely worried many investors, history tells us that previous tricks may turn into holiday treats!
Wade W. Slome, CFA, CFP®
Plan. Invest. Prosper.
This article is an excerpt from a previously released Sidoxia Capital Management complimentary newsletter (November 1, 2018). Subscribe on the right side of the page for the complete text.
DISCLOSURE: Sidoxia Capital Management (SCM) and some of its clients hold positions in AAPL, AMZN, GOOGL, and certain exchange traded funds (ETFs), but at the time of publishing had no direct position in any other security referenced in this article. No information accessed through the Investing Caffeine (IC) website constitutes investment, financial, legal, tax or other advice nor is to be relied on in making an investment or other decision. Please read disclosure language on IC Contact page.
Stirring the Sentiment Tea Leaves Redux

Despite the Volatility Index (VIX) currently operating at the low end of historical ranges (9.36), the equity markets operate on a perpetual volatility rollercoaster. This period of relative calm has not stopped participants from searching for the Holy Grail of indicators in hopes of determining whether the next large move in the markets is upwards or downwards. Although markets may be efficient in the long-run (see Crisis Black Eye), in the short-run, financial markets are hostage to fear and greed, and these emotions have been on full display. Although the Dow Jones Industrial Average has almost catapulted almost +4,000 points since the period right before the 2016 Presidential Election, last June also produced a roughly -1,000 point decline in the Dow. With fresh fears over Russian intervention-collusion, global monetary policy uncertainty, and political risk in North Korea, investors are grasping for clues as they read the indicator tea leaves to better position their portfolios. Some of these contrarian sentiment indicators can be helpful to your portfolio, if used properly. However, in large part, interpreting many of the sentiment indicators is as useful as reading tea leaves for your winning lotto number picks.
The Art of Tea Leave Reading
The premise behind contrarian investing is fairly simple – if you follow the herd, you will be led to the slaughterhouse. There is a tendency for investors to succumb to short-termism and act on their emotions rather than reason. The pendulum of investment emotions continually swings back and forth between fear and greed, and many of these indicators are designed with the goal of capturing emotion extremes.
The concept of mass hysteria is nothing new. Back in 1841, Charles Mackay published a book entitled, Extraordinary Popular Delusions and the Madness of Crowds, in which Mackay explores the psychology of crowds and mass mania through centuries of history, including the infamous Dutch Tulip Mania of the early 1600s (see Soros Super Bubble).
Out of sympathy for your eyeballs, I will not conduct an in-depth review of all the contrarian indicators, but here is brief sampling:
Sentiment Surveys: The American Association of Individual Investors (AAII) releases weekly survey results from its membership. A different survey, conducted by Investors Intelligence, called the Advisors Sentiment Index, surveys authors of various stock advice newsletters. These data can provide some insights, but as you can probably gather, these surveys are also very subjective and often conflicting.
Put-Call Ratio: This is a widely used ratio that measures the trading volume of bearish put options to bullish call options and is used to gauge the overall mood of the market. When investors are fearful and believe prices will go lower, the ratio of puts to calls escalates. At historically high levels (see chart below), this ratio usually indicates a bottoming process in the market.
Volatility Index (VIX): The VIX indicator or “Fear Gauge” calculates inputs from various call and put options to create an approximation of the S&P 500 index implied volatility for the next 30 days. Put simply, when fear is high, the price of insurance catapults upwards and the VIX moves higher.
Strategist Sentiment: If you’re looking for a contrarian call to payoff, I wouldn’t hold your breath by waiting for bearish strategist sentiment to kick-in. Barry Ritholtz at the Big Picture got it right when he summarized Barron’s bullish strategist outlook by saying, “File this one under Duh!” Like most Wall Street and asset management firms, strategists have an inherent conflict of interest to provide a rosy outlook. More often than not, strategists’ opinions move like the wind in whatever direction stocks are currently moving.
Short Interest: The higher the amount of shares shorted, the larger the pent-up demand to buy shares becomes in the future. Extremely high levels of short interest tend to coincide with price bottoms because as prices begin to move higher, holders of short positions often feel “squeezed” to buy shares and push prices higher.
Fund Flow Data: The direction of investment dollars flowing in and out of mutual funds can provide some perspective on the psychology of the masses. This data can be found at the Investment Company Institute (ICI). Given the bloodletting of the 2008-2009 financial crisis, investors skepticism has made stocks about as popular as the approval ratings of Congress.
When it comes to sentiment indicators, I believe actions speak much louder than words. To the extent I actually do track some of these indicators, I pay much less attention to those indicators based on opinions, surveys, and technical analysis data (see Astrology or Lob Wedge). Most of my concentration is centered on those indicators explaining actual measurable investor behavior (i.e., Put-Call, VIX, Short Interest, Fund Flow, and other action-oriented trading metrics).
As we know from filtering through the avalanche of daily news data, the world can obviously can be a scary place (see Head Fakes Surprise). If you believe the world is on the cusp of ending and/or you do not believe investors are sufficiently bearish, I encourage you to build your own personal bunker and stuff it with gold or Bitcoin. If, however, you are looking to sharpen the returns on your portfolio and are thirsty for some emotional answers, pour yourself a cup of tea and pore over some sentiment indicators.
Wade W. Slome, CFA, CFP®
Plan. Invest. Prosper.
DISCLOSURE: Sidoxia Capital Management (SCM) and some of its clients own certain exchange traded funds, but at the time of publishing SCM had no direct position in any security referenced in this article. No information accessed through the Investing Caffeine (IC) website constitutes investment, financial, legal, tax or other advice nor is to be relied on in making an investment or other decision. Please read disclosure language on IC “Contact” page.
Sweating Your Way to Investment Success

There are many ways to make money in the financial markets, but if this was such an easy endeavor, then everybody would be trading while drinking umbrella drinks on their private islands. I mean with all the bright blinking lights, talking baby day traders, and software bells and whistles, how difficult could it actually be?
Unfortunately, financial markets have a way of driving grown men (and women) to tears, usually when confidence is at or near a peak. The best investors leave their emotions at the door and follow a systematic disciplined process. Investing can be a meat grinder, but the good news is one does not need to have a 90% success rate to make it lucrative. Take it from Peter Lynch, who averaged a +29% return per year while managing the Magellan Fund at Fidelity Investments from 1977-1990. “If you’re terrific in this business you’re right six times out of 10,” says Lynch.
Sweating Way to Success
If investing is so tough, then what is the recipe for investment success? As the saying goes, money management requires 10% inspiration and 90% perspiration. Or as strategist and long-time investor Don Hays notes, “You are only right on your stock purchases and sales when you are sweating.” Buying what’s working and selling what’s not, doesn’t require a lot of thinking or sweating (see Riding the Wave), just basic pattern recognition. Universally loved stocks may enjoy the inertia of upward momentum, but when the music stops for the Wall Street darlings, investors rarely can hit the escape button fast enough. Cutting corners and taking short-cuts may work in the short-run, but usually ends badly.
Real profits are made through unique insights that have not been fully discovered by market participants, or in other words, distancing oneself from the herd. Typically this means investing in reasonably priced companies with significant growth prospects, or cheap out-of-favor investments. Like dieting, this is easy to understand, but difficult to execute. Pulling the trigger on unanimously hated investments or purchasing seemingly expensive growth stocks requires a lot of blood, sweat, and tears. Eating doughnuts won’t generate the conviction necessary to justify the valuation and excess expected return for analyzed securities.
Times Have Changed
Investing in stocks is difficult enough with equity fund flows hemorrhaging out of investor accounts like the asset class is going out of style. Stocks’ popularity haven’t been helped by the heightened volatility, as evidenced by the multi-year trend in the schizophrenic volatility index (VIX) – escalated by the international geopolitics and presidential elections. Globalization, which has been accelerated by technology, has only increased correlations between domestic market and international markets. In decades past, concerns over economic activity in Iceland, Dubai, and Greece may not even make the back pages of The Wall Street Journal. Today, news travels at the speed of a “Tweet” and eventually results in a sprawling front page headline.
The equity investing game may be more difficult today, but investing for retirement has never been more important. Stuffing money under the mattress in Treasuries, money market accounts, CDs, or other conservative investments may feel good in the short run, but will likely not cover inflation associated with rising fuel, food, healthcare, and leisure costs. Regardless of your investment strategy, if your goal is to earn excess returns, you may want to check the moistness of your armpits – successful long-term investing requires a lot of sweat.
Wade W. Slome, CFA, CFP®
Plan. Invest. Prosper.
DISCLOSURE: Sidoxia Capital Management (SCM) and some of its clients own certain exchange traded funds, but at the time of publishing SCM had no direct position in ETFC, VXX, or any other security referenced in this article. No information accessed through the Investing Caffeine (IC) website constitutes investment, financial, legal, tax or other advice nor is to be relied on in making an investment or other decision. Please read disclosure language on IC “Contact” page.
The Sky is Falling?

Investors reacted like the sky was falling on Friday. Commentators mostly blamed the -400 point decline in the Dow on heightened probabilities for a September rate hike by Janet Yellen and her fellow Federal Reserve colleagues. Geopolitical concerns over a crazy dictator in North Korea with nuclear weapons were identified as contributing factors to frazzled nerves.
The real question should be, “Are these stories complete noise, or should I pay close attention?” For the vast majority of times, the response to questions like these should be “yes”, the media headlines are mere distractions and you should simply ignore them. During the last rate hike cycle from mid-2004 to mid-2006, guess how many times the Fed raised rates? Seventeen times! And over those 17 rate hikes, stocks managed to respectably rise over 11%.
So far this cycle, Yellen and the Fed have raised interest rates one time, and the one and only hike was the first increase in a decade. Given all this data, does it really make sense to run in a panic to a bunker or cave? Whether the Fed increases rates by 0.25% during September or Decemberis completely irrelevant.
If we look at the current situation from a slightly different angle, you can quickly realize that making critical investment decisions based on short-term Federal Reserve actions would be foolish. Would you buy or sell a house based solely on this month’s Fed policy? For most, the answer is an emphatic “no”. The same response should hold true for stocks as well. The real reason anyone should consider buying any type of asset, including stocks, is because you believe you are paying a fair or discounted price for a stream of adequate future cash flows (distributions) and/or price appreciation in the asset value over the long-term.
The problem today for many investors is “short-termism.” This is what Jack Gray of Grantham, Mayo, Van Otterloo and Company had to say on the subject, “Excessive short-termism results in permanent destruction of wealth, or at least permanent transfer of wealth.” I couldn’t agree more.
Many people like to speculate or trade stocks like they are gambling in Las Vegas. One day, when the market is up, they buy. And the other day, when the market is down, they sell. However, those same people don’t wildly speculate with short-term decision-making when they buy larger ticket items like a lawn-mower, couch, refrigerator, car, or a house. They rationally buy with the intention of owning for years.
Yes, it’s true appliances, vehicles, and homes have utility characteristics different from other assets, but stocks have unique utility characteristics too. You can’t place leftovers, drive inside, or sit on a stock, but the long-term earnings and dividend growth of a diversified stock portfolio provides plenty of distinctive income and/or retirement utility benefits to a long-term investor.
You don’t have to believe me – just listen to investing greats like Warren Buffett:
“If you aren’t willing to own a stock for ten years, don’t even think about owning it for ten minutes. Put together a portfolio of companies whose aggregate earnings march upward over the years, and so also will the portfolio’s market value.”
The common sense test can also shed some light on the subject. If short-term trading, based on the temperature of headlines, was indeed a lucrative strategy, then the wealthiest traders in the world would be littered all over the Forbes 100 list. There are many reasons that is not the case.
Even though the Volatility Index (aka, “Fear Gauge” – VIX) spiked +40% in a single day, that does not necessarily mean stock investors are out of the woods yet. We saw similar volatility occur last August and during January and June of this year. At the same time, there is no need to purchase a helmet and run to a bunker…the sky is not falling.
Other related article: Invest with a Telescope…Not a Microscope
Wade W. Slome, CFA, CFP®
Plan. Invest. Prosper.
DISCLOSURE: Sidoxia Capital Management (SCM) and some of its clients hold positions in certain exchange traded funds (ETFs), but at the time of publishing had no direct position in any other security referenced in this article. No information accessed through the Investing Caffeine (IC) website constitutes investment, financial, legal, tax or other advice nor is to be relied on in making an investment or other decision. Please read disclosure language on IC Contact page.
Out of the Woods?

In the middle of the 24/7 news cycle, many investors get distracted by the headline du jour, much like a baby gets distracted by a shiny new object. While investor moods have been swinging violently back and forth, October’s performance has bounced back like a flying tennis ball. So far, the reversal in the S&P 500 performance has more than erased the -9% correction occurring in August and September. Could we finally be out of the woods, or will geopolitics and economic factors scare investors through Halloween and year-end?
Given recent catapulting stock prices, investor amnesia has erased the shear horror experienced over the last few months – this is nothing new for emotional stock market participants. As I wrote in Controlling the Lizard Brain, human brains have evolved the almond-shaped tissue in our brains (amygdala) that controlled our ancestors’ urge to flee ferocious lions. Today the urge is to flee scary geopolitical and economic headlines.
I expanded on the idea here:
“When the brain in functioning properly, the prefrontal cortex (the front part of the brain in charge of reasoning) is actively communicating with the amygdala. Sadly, for many people, and investors, the emotional response from the amygdala dominates the rational reasoning portion of the prefrontal cortex. The best investors and traders have developed the ability of separating emotions from rational decision making, by keeping the amygdala in check.”
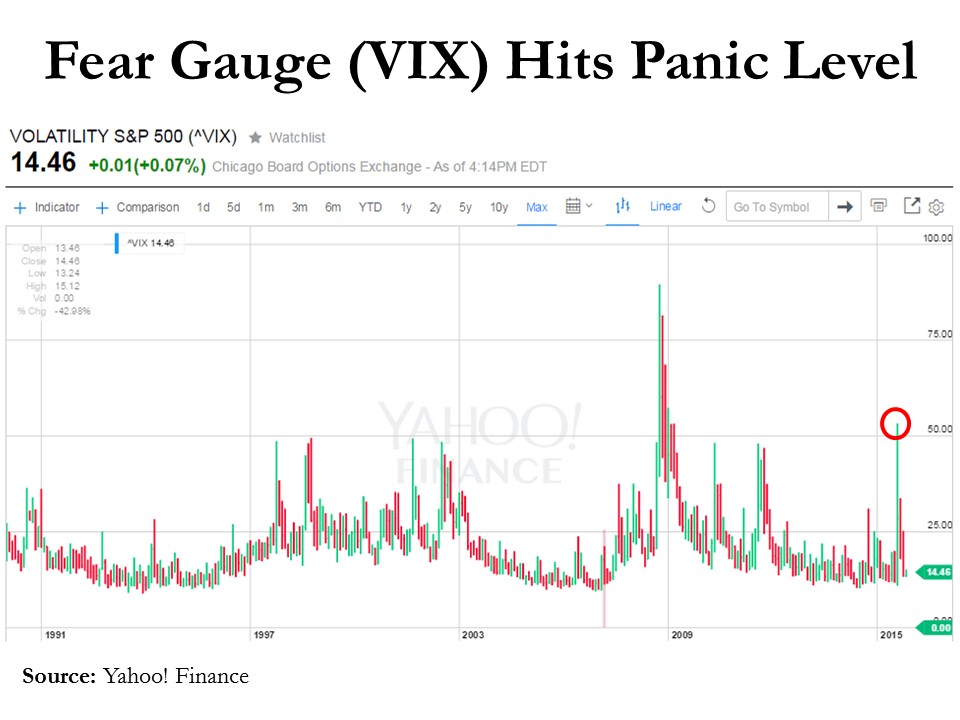
Evidence of lizard brains fear for flight happened just two months ago when the so-called “Fear Gauge” (VIX – Volatility Index) hit a stratospherically frightening level of 53 (see chart below), reached only once over the last few decades (2008-09 Financial Crisis).
Just as quickly as slowing China growth and a potential Fed interest rate hike caused investors to crawl underneath their desks during August (down –11% in four days), while biting their fingernails, investors have now sprung outside to the warm sunshine. The end result has been an impressive, mirror-like +11% increase in stock prices (S&P 500) over the last 18 trading days.
Has anything really changed over the last few weeks? Probably not. Economists, strategists, analysts, and other faux-soothsayers get paid millions of dollars in a fruitless attempt to explain day-to-day (or hour-by-hour) volatility in the stock markets. One Nobel Prize winner, Paul Samuelson, understood the random nature of stock prices when he observed, “The stock market has forecast nine of the last five recessions.” The pundits are no better at consistently forecasting stock prices.
As I have reiterated many times before, the vast majority of the pundits do not manage money professionally – the only people you should be paying attention to are successful long-term investors. Even listening to veteran professional investors can be dangerous because there is often such a wide dispersion of opinions based on varying time horizons, strategies, and risk tolerances.
Skepticism remains rampant regarding the sustainability of the bull market as demonstrated by the -$100 billion+ pulled out of domestic equity funds during 2015 (Source: ICI). The Volatility Index (VIX) shows us the low-hanging fruit of pessimism has been picked with the metric down -73% from August. With legislative debt ceiling and sequestration debates ahead in the coming weeks, we could hit some more choppy waters. Short-term volatility may resurrect itself, but the economy keeps chugging along, interest rates remain near all-time lows, and stock valuations, broadly speaking, remain reasonable. Investors may not be out of the woods yet, but one thing remains certain…an ever-changing stream of fearful headlines are likely to continue flooding in, which means we must all keep our lizard brains in check.
Wade W. Slome, CFA, CFP®
Plan. Invest. Prosper.
DISCLOSURE: Sidoxia Capital Management (SCM) and some of its clients hold positions in certain exchange traded funds (ETFs), but at the time of publishing, SCM had no direct position in any other security referenced in this article. No information accessed through the Investing Caffeine (IC) website constitutes investment, financial, legal, tax or other advice nor is to be relied on in making an investment or other decision. Please read disclosure language on IC Contact page.
The Art of Catching Falling Knives

“In the middle of every difficulty lies an opportunity.” ~Albert Einstein
It was a painful week for bullish investors in the stock market as evidenced by the -1,018 point drop in the Dow Jones Industrial Average, equivalent to approximately a -6% decline. The S&P 500 index did not fare any better, and the loss for the tech-heavy NASDAQ index was down closer to -7% for the week.
The media is attributing much of the short-term weakness to a triple Chinese whammy of factors: 1) Currency devaluation of the Yuan; 2) Weaker Chinese manufacturing data registering in at the lowest level in over six years; and 3) A collapsing Chinese stock market.
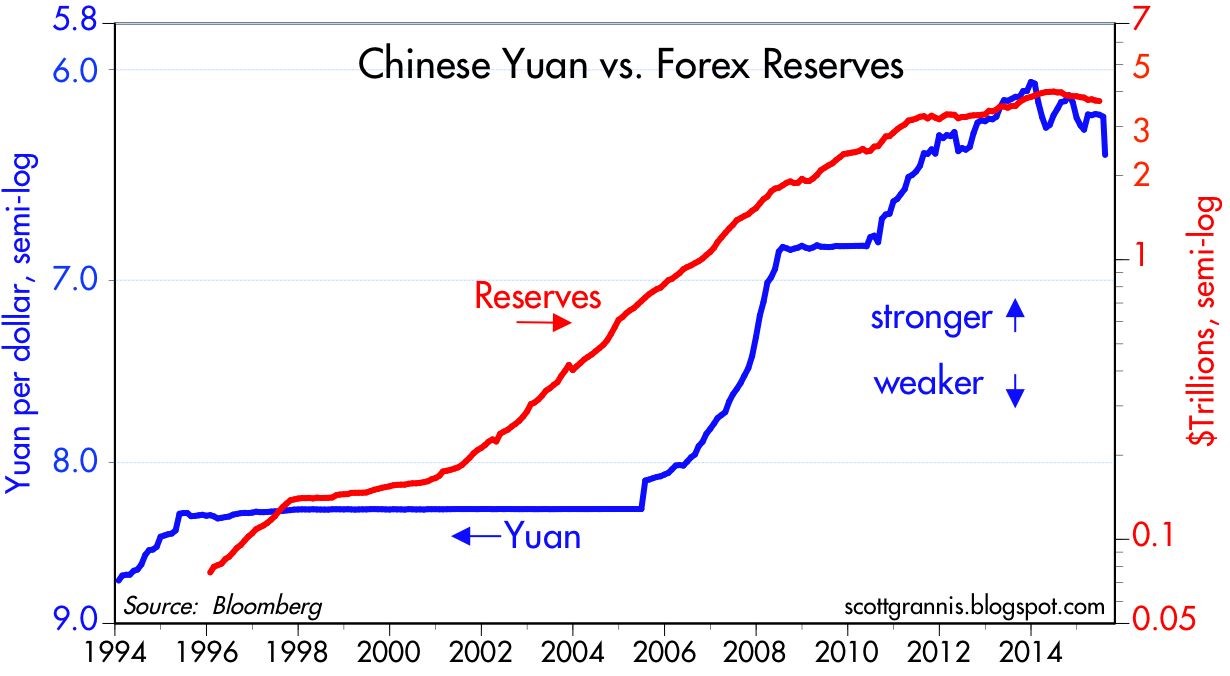
As the second largest economy on the planet, developments in China should not be ignored, however these dynamics should be put in the proper context. With respect to China’s currency devaluation, Scott Grannis at Calafia Beach Pundit puts the foreign exchange developments in proper perspective. If you consider the devaluation of the Yuan by -4%, this change only reverses a small fraction of the Chinese currency appreciation that has taken place over the last decade (see chart below). Grannis rightfully points out the -25% collapse in the value of the euro relative to the U.S. dollar is much more significant than the minor move in the Yuan. Moreover, although the move by the People’s Bank of China (PBOC) makes America’s exports to China less cost competitive, this move by Chinese bankers is designed to address exactly what investors are majorly concern about – slowing growth in Asia.
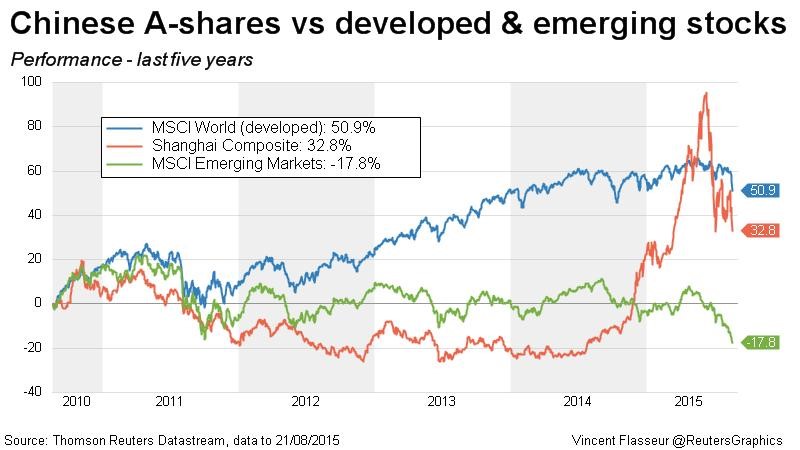
Although the weak Chinese manufacturing data is disconcerting, this data is nothing new – the same manufacturing data has been very choppy over the last four years. On the last China issue relating to its stock market, investors should be reminded that despite the massive decline in the Shanghai Composite, the index is still up by more than +50% versus a year ago (see chart below)
Fear the Falling Knife?
Given the fresh carnage in the U.S. and foreign markets, is now the time for investors to attempt to catch a falling knife? Catching knives for a living can be a dangerous profession, and many investors – professionals and amateurs alike – have lost financial fingers and blood by attempting to prematurely purchase plummeting securities. Rather than trying to time the market, which is nearly impossible to do consistently, it’s more important to have a disciplined, unemotional investing framework in place.
Hall of Fame investor Peter Lynch sarcastically highlighted the difficulty in timing the market, “I can’t recall ever once having seen the name of a market timer on Forbes‘ annual list of the richest people in the world. If it were truly possible to predict corrections, you’d think somebody would have made billions by doing it.”
Readers of my blog, Investing Caffeine understand I am a bottom-up investor when it comes to individual security selection with the help of our proprietary S.H.G.R. model, but those individual investment decisions are made within Sidoxia’s broader, four-pronged macro framework (see also Don’t be a Fool, Follow the Stool). As a reminder, driving our global views are the following four factors: a) Profits; b) Interest rates; c) Sentiment; and Valuations. Currently, two of the four indicators are flashing green (Interest rates and Sentiment), and the other two are neutral (Profits and Valuations).
- Profits (Neutral): Profits are at record highs, but a strong dollar, weak energy sector, and sluggish growth internationally have slowed the trajectory of earnings.
- Valuation (Neutral): At an overall P/E of about 18x’s profits for the S&P 500, current valuations are near historical averages. For CAPE investors who have missed the tripling in stock prices, you can reference prior discussions (see CAPE Smells Like BS). I could make the case that stocks are very attractive with a 6% earnings yield (inverse P/E ratio) compared to a 2% 10—Year Treasury bond, but I’ll take off my rose-colored glasses.
- Interest Rates (Positive): Rates are at unambiguously low levels, which, all else equal, is a clear-cut positive for all cash generating asset classes, including stocks. With an unmistakably “dovish” Federal Reserve in place, whether the 0.25% interest rate hike comes next month, or next year will have little bearing on the current shape of the yield curve. Chairman Yellen has made it clear the trajectory of rate increases will be very gradual, so it will take a major shift in economic trends to move this factor into Neutral or Negative territory.
- Sentiment (Positive): Following the investment herd can be very dangerous for your financial health. We saw that in spades during the late-1990s in the technology industry and also during the mid-2000s in the housing sector. As Warren Buffett says, it is best to “buy fear and sell greed” – last week we saw a lot of fear.
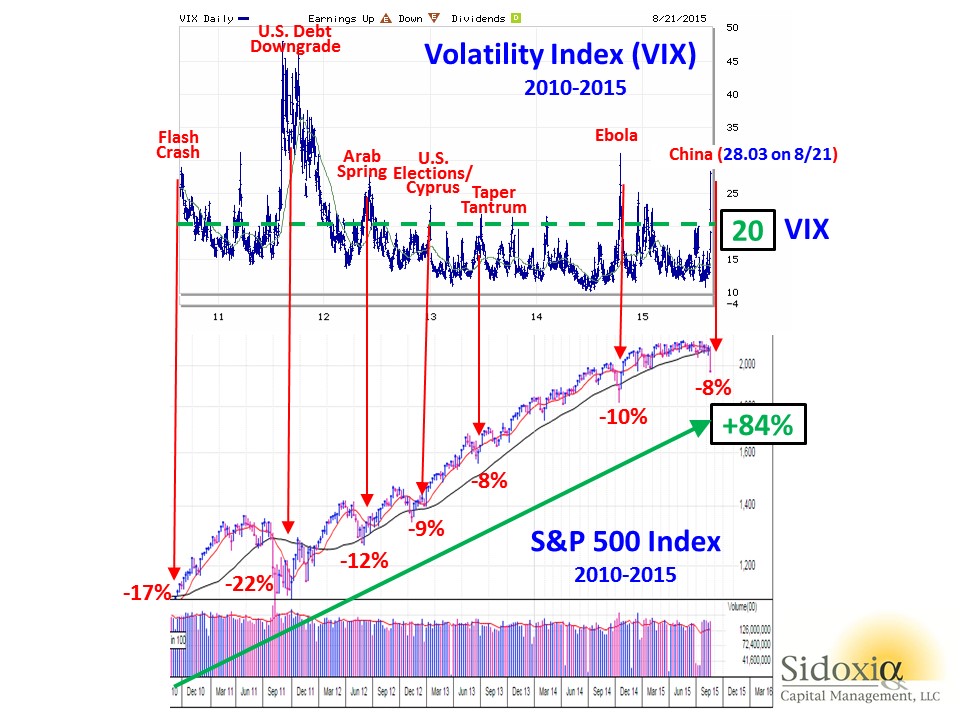
In addition to the immense outflows out of stock funds (see also Great Rotation) , panic was clearly evident in the market last week as shown by the Volatility Index (VIX), a.k.a., the “Fear Gauge.” In general, volatility over the last five years has been on a declining trend, however every 6-12 months, some macro concern inevitably rears its ugly head and volatility spikes higher. With the VIX exploding higher by an amazing +118% last week to a level of 28.03, it is proof positive how quickly sentiment can change in the stock market.
Not much in the investing world works exactly like science, but buying stocks during previous fear spikes, when the VIX level exceeds 20, has been a very lucrative strategy. As you can see from the chart below, there have been numerous occasions over the last five years when the over-20 level has been breached, which has coincided with temporary stock declines in the range of -8% to -22%. However, had you held onto stocks, without adding to them, you would have earned an +84% return (excluding dividends) in the S&P 500 index. Absent the 2011 period, when investors were simultaneously digesting a debt downgrade, deep European recession, and domestic political fireworks surrounding a debt ceiling, these periods of elevated volatility have been relatively short-lived.
Whether this will be the absolute best time to buy stocks is tough to say. Stocks are falling like knives, and in many instances prices have been sliced by more than -10%, -20%, or -30%. It’s time to compile your shopping list, because valuations in many areas are becoming more compelling and eventually gravity will run its full course. That’s when your strategy needs to shift from avoiding the falling knives to finding the bouncing tennis balls…excuse me while I grab my tennis racket.

Wade W. Slome, CFA, CFP®
Plan. Invest. Prosper.
DISCLOSURE: Sidoxia Capital Management (SCM) and some of its clients hold positions in certain exchange traded funds (ETFs) including emerging market/Chinese ETFs, but at the time of publishing, SCM had no direct position in any other security referenced in this article. No information accessed through the Investing Caffeine (IC) website constitutes investment, financial, legal, tax or other advice nor is to be relied on in making an investment or other decision. Please read disclosure language on IC Contact page.
March Madness – Dividend Grandness & Volatility Blandness

March Madness has arrived once again. This NCAA basketball event, which has been around since 1939, begins with a selection committee choosing the top 68 teams in the country. These teams are matched up against each other through a single-elimination tournament until a national champion is throned. The stock market does not have a selection committee that picks teams from conferences like the SEC, Big East, Pac-12, and ACC, but rather millions of investors select the best investments from asset classes like stocks, bonds, real estate, commodities, venture capital, and private equity.
In the investment world, there are no win-loss records, but rather there are risk-return profiles. Investors generally migrate towards the asset classes where they find the optimal trade-off between risk and return. Speculators, day-traders, and momentum traders may define risk differently, but regardless, over the long-run, capital goes where it is treated best. And over the last six years, the U.S. stock market hasn’t been a bad place to be (the S&P 500 has about tripled).
Why such outperformance in stocks? Besides a dynamic earnings recovery from the 2008-2009 financial crisis, another major factor has been the near-0% interest rate environment. When investors are earning near nothing in their bank and savings accounts, it is perfectly rational for savers to look for riskier options, if they are compensated for that risk. In addition to loose central bank and quantitative easing policies fueling demand for stocks, rising dividends have increased the attractiveness of the stock market. In fact, as you can see from the chart below, dividends have about doubled from 2008-2009 and about tripled from the year 2000.
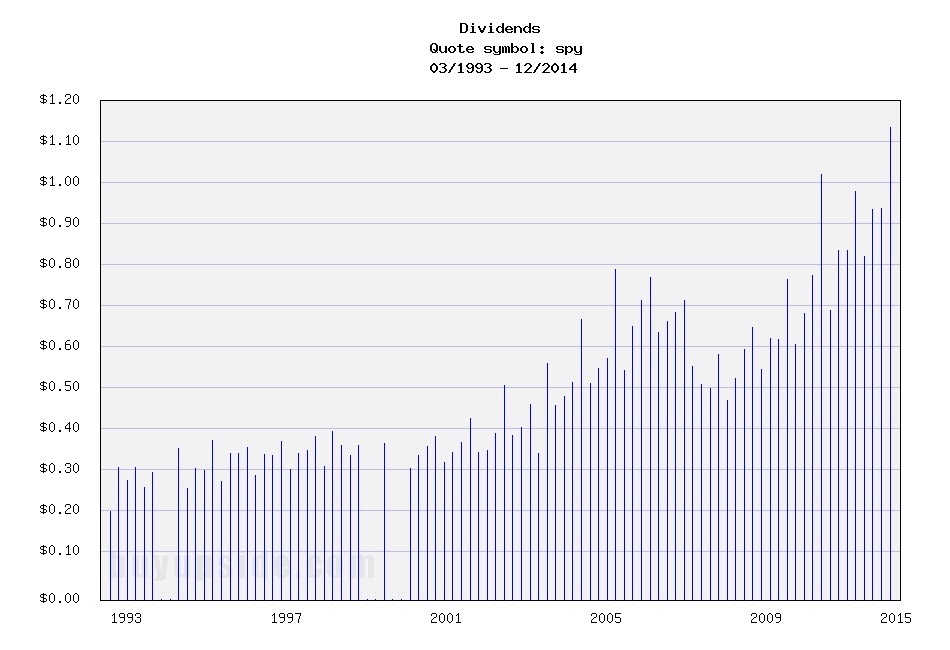
Source: Buy Upside
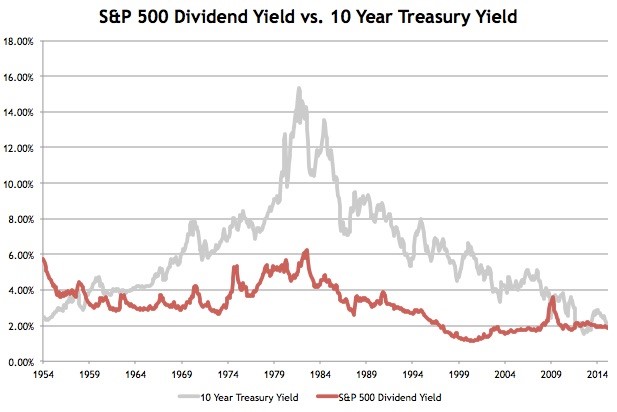
Stock prices have moved higher in concert with rising dividends, which, as you can see from the chart below, has kept the dividend yield flat at around 2% over the last few years. Treasury bond yields, on the other hand, have been on steady declining trend for the last 35 years. So, while coupons on newly issued bonds have been declining for virtually the last three and a half decades, stock dividends have been on a steadily upward moving rampage, excluding recessions (up +13% in the most recent reported period).
Source: Avondale Asset Management
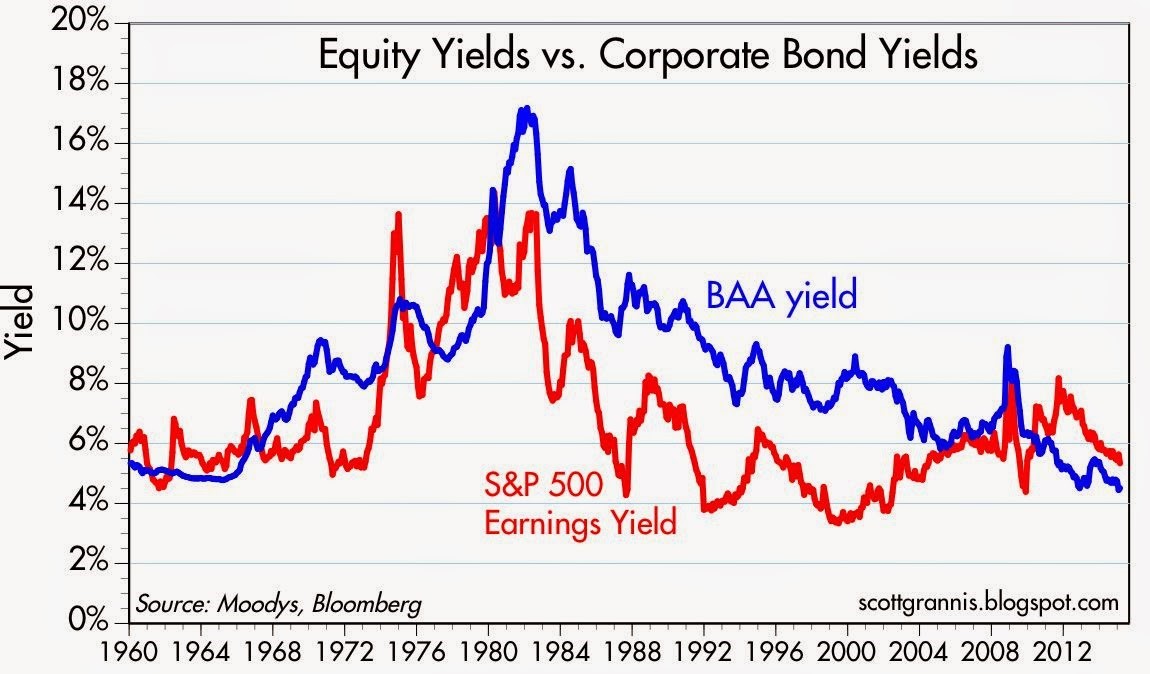
Declining interest rates have made stocks look attractive relative to investment grade corporate bonds too as evidenced by the chart below. As you can see, over the last half-century, corporate bond yields have predominantly offered higher income yields than the earnings yield on stocks – that is not the case today.
Source: Calafia Beach Pundit
What does all this stock dividend, earnings yield stuff mean? In the grand scheme of things, income starving Baby Boomers and retirees are slowly realizing that stocks in general stack up favorably in an environment in which interest payments are going down and dividend payments are going up. One of the areas highlighting the underlying demand for stocks is the Volatility Index (VIX) – a.k.a., the “Fear Gauge.” Despite Greece, Russia, ISIS, the Fed, and the Dollar dominating the headlines, the hunger for yield and growth in a declining interest rate environment is cushioning the blow during these heightened periods of volatility (see also A Series of Unfortunate Events).
Since the end of 2011, the monthly close of the VIX has stayed above its historical average of approximately 20 only two times (see chart below). In other words, over that timeframe, the VIX has remained below average about 95% of the time. When the VIX has spiked above 20, generally it has only been for brief periods, until cooler heads prevail and bargain hunters come in to buy depressed stock bargains.
Source: Barchart
I’m not naïve enough to believe the bull market in stocks will last forever, but as long as interest rates don’t spike up and/or corporate earnings crater, underlying demand for yield should provide a floor for stocks during heightened periods of volatility. We may be in the midst of March Madness but volatility blandness is showing us that investors are paying attention to dividend grandness.

Wade W. Slome, CFA, CFP®
Plan. Invest. Prosper.
DISCLOSURE: Sidoxia Capital Management (SCM) and some of its clients hold positions in certain exchange traded funds (ETFs) and SPY, but at the time of publishing, SCM had no direct position in any other security referenced in this article. No information accessed through the Investing Caffeine (IC) website constitutes investment, financial, legal, tax or other advice nor is to be relied on in making an investment or other decision. Please read disclosure language on IC Contact page.
The Fund Flows Paradox

How is it that the stock market has more than doubled over the last three years, when investors have been dumping stocks like they are going out of style? If you don’t believe me, and you think jovial investors are jacking stocks higher, then please explain to me why billions of dollars are hemorrhaging out of equity funds on a monthly basis over the last five years (see Fund Flow data chart below)?

Source: Calafia Beach Pundit
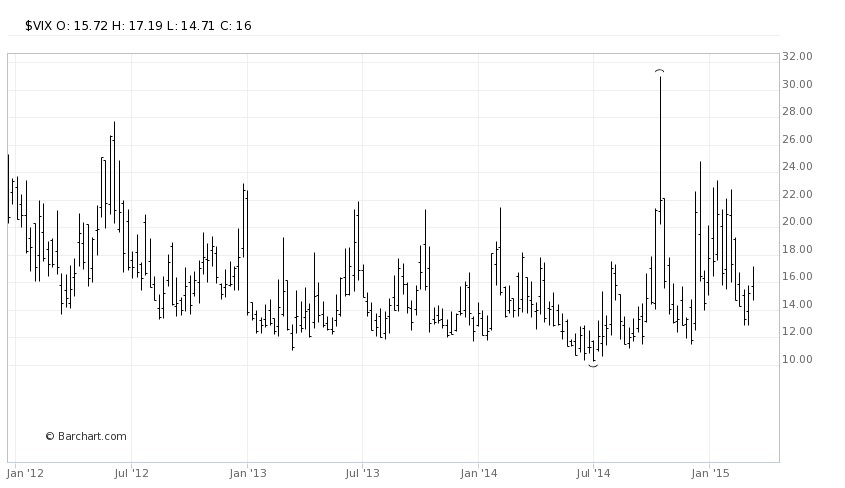
If by small chance you buy my argument that skeptical investors continue to doubt the sustainability of the three-year doubling in the stock market, then why is the Volatility Index (VIX) trading like investors are sunbathing at the beach while licking lollipops? For those not keeping score on the VIX (see also The VIX and the Rule of 16), typically a reading below 20 is interpreted as investor overconfidence and/or complacency. On the flip side, readings above 20 usually indicate pessimism or fear.
As you can see from the chart below, we have spent a good portion of the last few years on both sides of the 20 mph VIX speed limit, and currently at a reading of about 17, investors have slowed down to enjoy the scenery.

Source: Yahoo! Finance
So with massive selling and a cheery reading on the VIX, how can these bipolar data-points be reconciled? Therein lies the “Fund Flows Paradox.”
Take Me Out to the Ballgame
![]()
If you equate equity investors to fans at a baseball stadium, the fund flow data clearly shows investors are tired of losing money and have been leaving the game in droves. Instead of staying at the equity baseball stadium, those fatigued stock investors have decided to head over to the adjacent bond arena. The equity stadium will never completely be empty because financial markets always have speculative traders. In baseball terms you can think of these short-term traders as the emotionally volatile die-hard fanatics, who will stick around regardless of whether the home team wins or loses.
So while sentiment gauges like the VIX, or sentiment surveys conducted by AAII (American Association of Individual Investors) may be temporarily flashing contrarian bearish signals, one should be cognizant that these data points do not include the petrified opinions of investors who have raced out of the stadium. Eventually when the home team’s winning streak is long enough, investors will return back to the stadium from the bond arena. While there is no sign of individual investors coming back to the stock game anytime soon, in the meantime patient and disciplined investors have had plenty of opportunities to take advantage of. With massive numbers of individual investors and sellers sitting on the sidelines, the markets require relatively little buying to push prices higher.
Over the last few years, not only have equity valuations been broadly reasonable, volatility spikes during the last few summers have also created amplified opportunities. With the wall of worries currently blanketing traditional and new media headlines (i.e., European crisis, U.S. election uncertainty, unsustainable and slowing profits, pending tax cut expirations, Mideast turmoil, etc.) there is no sense of urgency to pile back in to the equity markets.
The doubling in stock prices have occurred on low volumes, largely on the backs of a smaller institutional investor base, not to mention high frequency traders and speculators. While sentiment surveys may currently provide some insight into short-term equity trader attitudes, don’t let these volatile and unreliable data cloud the true underlying pessimism of the masses who have left the stock stadium in large numbers. Trillions of dollars remain on the sidelines as potential fuel for future equity appreciation, once confidence returns.
Opinions are interesting, but actions speak louder than words. Spend more time looking at the actions of the fund flow data, rather than the opinions of various short-term sentiment surveys or short-term options trader statistics. Adjusting your focus to investor actions and behavior will provide a truer gauge of overall investor sentiment and assist you in solving the “Fund Flows Paradox.”
Wade W. Slome, CFA, CFP®
Plan. Invest. Prosper.
DISCLOSURE: Sidoxia Capital Management (SCM) and some of its clients own certain exchange traded funds, but at the time of publishing SCM had no direct position in VXX, or any other security referenced in this article. No information accessed through the Investing Caffeine (IC) website constitutes investment, financial, legal, tax or other advice nor is to be relied on in making an investment or other decision. Please read disclosure language on IC “Contact” page.


