Posts tagged ‘valuation’
As We Give Thanks, AI and Mag 7 Take Cash to the Bank

Market volatility resurfaced last month as speculation intensified over whether an AI bubble may be forming—and potentially bursting. Yet despite the jitters, equity markets remain solidly positive for the year (S&P 500 +16.5%, NASDAQ +21.0%, Dow +12.2%) – see S&P 500 chart below. A significant portion of the gains have been powered in large part by ongoing strength in the Magnificent 7. Standouts such as NVIDIA (+31.8%) and Alphabet (+68.1%) have been instrumental in carrying the broader indices higher.

Even with these sizable year-to-date gains, memories of the 2000 Tech Bubble and 2008 Financial Crisis resurfaced and prompted investors to temporarily tap the brakes. Mid-month, the NASDAQ retreated roughly -9% from its October peak. After a month-end bounce, the S&P 500 finished essentially flat (+0.1%), the NASDAQ slipped -1.5%, and the Dow eked out a +0.3% increase.
OpenAI and the $1.4 Trillion Question
At the center of the AI controversy sits OpenAI, parent of the three-year-old technology toddler, ChatGPT (Generative Pre-trained Transformer), which now boasts more than 800 million global users (see chart below). The company reportedly runs at a $20 billion annual revenue pace, yet faces difficult questions about how it intends to fund its staggering $1.4 trillion AI infrastructure commitments.
Those concerns came to a head when tech investor Brad Gerstner pressed CEO Sam Altman on his podcast last month. Instead of answering how OpenAI plans to underwrite such an enormous buildout, Altman childishly shot back defensively:
“If you want to sell your shares, I’ll find you a buyer.” (See clip here — or full interview here)

Source: Digital Information World
OpenAI is a key player, but just one component in the vast—and rapidly expanding—web of global AI infrastructure. Gartner, a global research and advisory firm, forecasts $2 trillion of AI investment in 2026, while NVIDIA CEO Jensen Huang recently said:
“Over the next five years, we’re going to scale into… effectively a $3 to $4 trillion AI infrastructure opportunity.”
These provocative “Is this a bubble?” questions make for great headlines, but to truly evaluate AI sustainability, it’s wise to follow the classic Watergate guidance from of All the President’s Men character, Deep Throat (FBI Associate Director, Mark Felt), who tells journalist Bob Woodward to “follow the money,” if he wants to get to the bottom of the Watergate scandal.
The same principle applies to investors who follow the money – the picture looks very different from past bubbles.
Forget Pets.com—Today’s AI Buildout Is Being Funded by Cash-Rich Titans
Unlike the flimsy, profitless internet startups of the late 1990s—companies that raised billions based on “eyeballs” and cocktail-napkin business plans—the current AI buildout is being financed largely by profitable cash-generating giants.
Yes, some firms like Oracle (ORCL) are leaning on debt financing for data-center expansion. But the overwhelming majority of AI capex is being funded by customers and by the cash flow of the Magnificent 7, a group with the financial firepower to sustain multi-year spending without relying heavily on capital markets.
This dynamic alone separates today’s environment from classic bubble conditions.
Do the Magnificent 7 Really Deserve a $22 Trillion Valuation?
The Mag 7 represent only 1% of S&P 500 constituents yet account for a massive 35% of the index’s market value. That concentration understandably raises eyebrows, evoking historical parallels to the “Nifty Fifty” of the 1970s or the “Four Horsemen” of the 1990s.
But headline concentration can be misleading—because the fundamentals tell a very different story. Here are some of the major disparities:
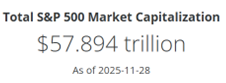
1.) Mag 7 Share of Profits Matches Their Share of Market Value: The Mag 7 collectively contribute $22 trillion of the S&P 500’s $58 trillion total value (below). Said differently, the market values and weightings of the Mag 7 equate to about $22 trillion and 37% of the S&P 500, respectively:
· Nvidia Corp: $4.3T & 7.0%
· Apple Inc.: $4.1 T & 6.7%
· Alphabet Inc.: $3.9 T & 6.3%
· Microsoft Corp.: $3.7 T & 5.9%
· Amazon.com Inc.: $2.5 T & 4.0%
· Meta Platforms Inc.: $1.6T & 2.6%
· Tesla Inc.: $1.4T & 2.3%
· TOTAL: $22T / 37%
Source: Slickcharts
Conveniently (and importantly), the Mag 7’s roughly $747 billion in annual cash flow (see table below) is a good proxy for their profit contribution to the $2 trillion in S&P profits.
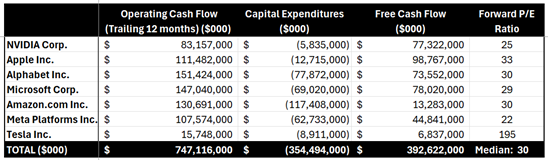
Source: SEC Filings & MarketSurge
The $747 billion in Mag 7 cash flows divided by the $2 trillion in S&P 500 coincidentally also equates to 37% ($747B/$2T).
These calculations of the Mag 7 are not bubble math—these calculation comparisons are rational math. Arguments could be made that Mag 7 market values are actually undervalued (not in bubble territory) and should appreciate to a higher percentage of the S&P 500 weightings because these 7 stocks are growing sales and profits faster than compared to the other “absentee” 493 stocks in the index.
2.) Mag 7 are Swimming in Cash: That $747 billion in annual cash flow is on track to hit a jaw-dropping $1 trillion, giving these firms ample capital to fund AI buildouts without substantially accessing the equity or credit markets. The ability to self-fund a multi-trillion-dollar infrastructure expansion is the opposite of bubble behavior.
3.) Valuations Are Elevated—but Far from Bubble Territory: During the 2000 Tech Bubble, many leading tech names traded at 100x+ earnings (See also: Rational or Irrational Exuberance. Today, the Mag 7 trade at a median forward P/E around 30x. Expensive? Historically, yes, versus long-term averages, but nowhere near historical extremes. Relative to growth, profitability, and cash flow, valuations are far more grounded today than during prior manias.
The bottom line is there is plenty to be thankful for and bubble fears are overstated. Despite pockets of AI froth, the underlying economic engine powering AI adoption is real, profitable, and well-capitalized. When investors follow the money, they discover:
· The Mag 7 generate over one-third of S&P 500 profits
· They generate and hold hundreds of billions in cash
· They largely fund their own AI capital expenditures
· Valuations remain far below bubble-era extremes
Investors have a lot to be thankful for. And while volatility will likely continue, the ingredients for a classic, catastrophic AI bubble are noticeably absent. For disciplined, long-term investing strategies like those employed at Sidoxia Capital Management, this environment still offers abundant opportunity—without the need to fear a pricked AI balloon anytime soon.
Wade W. Slome, CFA, CFP®
Plan. Invest. Prosper.
This article is an excerpt from a previously released Sidoxia Capital Management complimentary newsletter (Dec. 1, 2025). Subscribe Here to view all monthly articles.
DISCLOSURE: Sidoxia Capital Management (SCM) and some of its clients hold positions in NVDA, AAPL, MSFT, GOOGL, AMZN, META, TSLA, and certain exchange traded funds (ETFs), but at the time of publishing had no direct position in ORCL or any other security referenced in this article. No information accessed through the Investing Caffeine (IC) website constitutes investment, financial, legal, tax or other advice nor is to be relied on in making an investment or other decision. Please read disclosure language on IC Contact page.
No Market Misgiving on This Thanksgiving

We’ll see if there is any gravy left for investors during the last month of the year, but so far 2024 has been a satiating feast that has stuffed investors. There has been a cornucopia of items to be thankful for, including the Federal Reserve, which is expected to provide some dessert this month in the form of its third interest rate cut this year.
Investors certainly can also be grateful for the performance of the stock market, which has had a phenomenal year thus far (see chart below):
• S&P 500: +26.5%
• Dow Jones Industrial Average:+19.2%
• NASDAQ: +28.0%

On a two-year basis, the S&P 500 results look even tastier: +57.1%
Why is there such a large appetite for stocks? For starters, we are coming off a fresh election last month, and the majority of Americans decided to vote for the new administration that has promised additional stimulative tax cuts, and deregulation. If these promises come to fruition, these changes could augur well for corporate profits and a rising stock market. Regardless of whether your candidate won or lost the election, investors can agree there is less uncertainty with an uncontested election, which is welcomed by all. In addition, the two Fed rate cuts that started in September have also buoyed enthusiasm.
What is less clear are the effects of President-elect Donald Trump’s tariff policy threats, which if enacted run the risk of increasing inflation, stifling global trade, and jeopardizing future Fed rate cuts. Combined, these negative side effects have the potential of significantly dampening economic growth. On the other hand, if the tariffs are only used as a negotiating tool with our larger trading partners (including China, Mexico, Canada, and Europe), the tariff discussion will likely have more bark than bite. Time will tell.
Dissecting Stock Performance & Valuations
A lot of pundits are pointing to an overheated market, but on a 3-year basis, returns are looking more normalized (+8.2% per year) because of the -20% hit on stocks during 2022. As you may recall, much of the 2022 decline was caused by the Fed slamming on the economic breaks with its fastest rate-hiking cycle in four decades (raising rates from 0.0% to 5.5%).
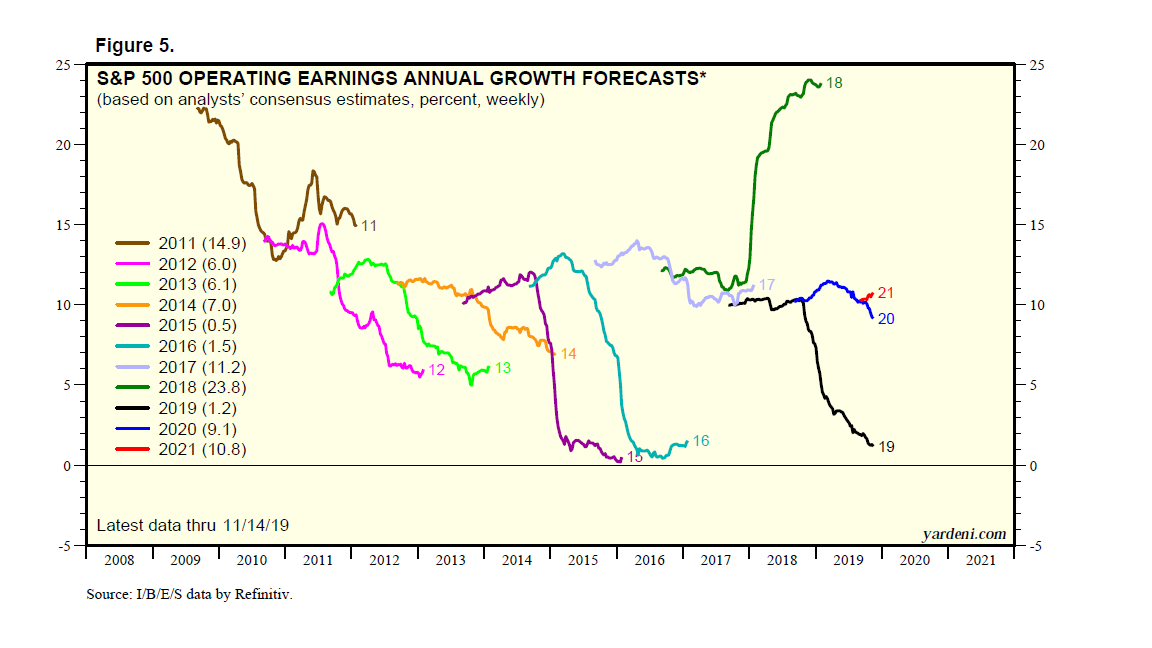
Objectively, stock values, as measured by the Price-Earnings (P/E) ratio of the S&P 500, are at elevated levels – registering in at approximately 22-times next year’s forecasted profits. As you can see from the chart below, the stock market is priced at levels not seen since 2001 and valuations are roughly double what they were at the lows of the 2008 Financial Crisis.

Source: Yardeni.com
A major reason for escalated valuations has been the concentration of performance in the largest seven companies, or the so-called Magnificent 7 stocks, which include, Apple, Microsoft, Alphabet, Amazon.com, Nvidia, Meta Platforms and Tesla. In fact, the index concentration is the highest it has been in more than a half century – even higher than at the peak of the 2000 Tech Bubble when Cisco Systems, Microsoft, GE, Intel, and Exxon Mobil were the five largest companies by market capitalization (see chart below).

The good news is the other 493 companies in the S&P 500 (I call them the “Absentee 493”) are priced much more reasonably. This bifurcated dynamic between the largest seven companies versus everything else, highlights the plethora of opportunities available to be harvested in Value stocks, Small-cap stocks, and Mid-cap stocks.
As is evident in the chart below, the S&P 500 index (red-line), which is skewed by the Magnificent 7, is about 30% more expensive than Small-cap and Mid-cap stocks, which are hovering near historically attractive valuation levels.

Source: Yardeni.com
Value stocks (blue-line) in the market look equally attractive (about 30% cheaper than the S&P 500), as can be seen in the chart below.

Source: Yardeni.com
As always, the future is uncertain, and risks abound for next year. But 2024 has been a blockbuster year and there has been plenty to be thankful for, especially the performance of the U.S. stock market.
Wade W. Slome, CFA, CFP®
Plan. Invest. Prosper.
This article is an excerpt from a previously released Sidoxia Capital Management complimentary newsletter (December 2, 2024). Subscribe Here to view all monthly articles.
DISCLOSURE: Sidoxia Capital Management (SCM) and some of its clients hold positions in AAPL, AMZN, MSFT, GOOGL, META, TSLA, NVDA, and certain exchange traded funds (ETFs), but at the time of publishing had no direct position in CSCO, GE, XOM, INTC or any other security referenced in this article. No information accessed through the Investing Caffeine (IC) website constitutes investment, financial, legal, tax or other advice nor is to be relied on in making an investment or other decision. Please read disclosure language on IC Contact page.
Investors Give Thanks and Feast on New Record

There were many things to be grateful over the Thanksgiving holiday, including personal finances for many. Stock market investors were especially thankful for the new record highs achieved in the S&P 500 index, which rose a heaping +3.4% last month, bringing 2019 stock market gains to a whopping +25.3%. Any concerns over politics, China trade, global monetary policy, Brexit negotiations, slowing economic growth, and other fears have been overshadowed by record corporate profits, generationally low interest rates, historically low unemployment rates, rising wages, strong consumer confidence, and hopes of an economic recovery abroad.
Despite the strong advances, concerns remain over a bubble or a stratospheric stock market. These worries of inflated gains seem overblown, if you consider stocks were down -6.2% in 2018. In other words, if you combine 2018-2019, so far, the two-year period averages an +8.4% annualized return – a more reasonable advance. One thing is for sure, this bull market, which started in early-2009, has been no turkey. Since the S&P 500 bottomed at 666 in March of 2009, the index finished the month at over 3,140 – almost a quintuple in value over a 10-year period (not too shabby).
I get the question a lot, “Wade, don’t you think the stock market is crazy now and it is going to crash soon? It’s gone up so much and is at a record high.” Just because the stock market hits a record level doesn’t mean it will stop going up. In fact, since 2013, the S&P 500 has hit 38 new, monthly record highs (see chart below). For each of these new records, I have listened to anxious investors brace themselves for another crash resembling the 2008 financial collapse. The only problem is the 100-year flood normally doesn’t come every 10 years, and as history often proves, record highs often beget future new record highs.

Be Careful to Whom You Listen
There are always varying opinions about the level and direction of future stock prices, but I always warn investors to be careful about following the judgments of television talking heads, especially when it comes to economists, strategists, and analysts, all of whom typically have very little experience in actually investing. These prognosticators typically are very articulate and persuasive but have little-to-no experience of really managing money. Traders generally fall into the useless camp as well because their opinions are moving at the speed of light based on the everchanging headlines du jour, thereby making this fickle advice worthless and ineffective. Instead, investors should pay attention to successful long-term investors who have proven the ability to make and preserve wealth through years of up-and-down markets. You don’t have to believe me, but when the most successful investor of all-time, Warren Buffett, says the stock market is “ridiculously cheap,” it probably makes sense to pay more attention to his words of wisdom versus the latest political headline or dangerous and speculative day trader advice to buy-buy-buy or sell-sell-sell!
Although Warren Buffett freely provides his opinions, he openly admits he has no idea what direction stock prices will do in the short-run. So, if the greatest investor of all-time cannot predict short-term direction of stocks, then maybe you shouldn’t try to predict either? Case in point, corporate profits were up over 20% in 2018 (see chart below) and stock prices went down, while this year corporate profits have been essentially flat and stock prices have catapulted approximately +25%. This goes to show you that short-term stock movements can be incredibly difficult to predict. You will be much better off by focusing on making sound investments and following a suitable strategy based on your unique objectives and constraints.
Source: Dr. Ed’s Blog
You may have gotten some heartburn by feasting on too much turkey, mashed potatoes, stuffing, and gravy, however investors are feasting on new record stock market highs despite investor anxiety. When the anxiety eventually turns to euphoria and gluttony, from fear and skepticism, then that will be the time to reach for the Tums antacid.

Wade W. Slome, CFA, CFP®
Plan. Invest. Prosper.
This article is an excerpt from a previously released Sidoxia Capital Management complimentary newsletter (December 2, 2019). Subscribe on the right side of the page for the complete text.
DISCLOSURE: Sidoxia Capital Management (SCM) and some of its clients hold positions and certain exchange traded funds (ETFs), but at the time of publishing had no direct position in any other security referenced in this article. No information accessed through the Investing Caffeine (IC) website constitutes investment, financial, legal, tax or other advice nor is to be relied on in making an investment or other decision. Please read disclosure language on IC Contact page.
Are Stocks Cheap or Expensive? Weekly Rant and the Week in Review 4-7-19
![]()
The Weekly Grind podcast is designed to wake up your investment brain with a weekly overview of financial markets and other economic-related topics.
Episode 7
Weekly Market Review and This Week’s Rant: Are Stocks Cheap or Expensive?
Don’t miss out! Follow us on iTunes, Spotify, SoundCloud or PodBean to get a new episode each week. Or follow our InvestingCaffeine.com blog and watch for new podcast updates each week.
SoundCloud: soundcloud.com/sidoxia
PodBean: sidoxia.podbean.com
Spotify: open.spotify.com
March Madness Leads to Gladness

As usual, there was plenty of “madness” in March, and this year did not disappoint. Just as is the case with the annual NCAA basketball tournament, certain investors suffered the agony of defeat in the financial markets, but overall, the thrill of victory triumphed in March. So much so that the S&P 500 index posted its largest first-quarter gain in more than 20 years. Not only did the major indexes post gains for the month, but the winning record looks even better for the year-to-date results. For 2019, the S&P 500 index is up +13.1%; the Dow Jones Industrial Average +11.2%; and the tech-heavy NASDAQ index +16.5% for the year. The monthly gains in the major indexes were more muted, ranging from 0% for the Dow to +2.6% for the NASDAQ.
Busy? Listen to Wade discuss this article and other topics each week on the Weekly Grind podcast:
While 2018 ended with a painful injury (S&P 500 -6.2% in Q4), on fears of a deteriorating China trade deal and a potentially overly aggressive Federal Reserve hiking interest rates, the stock market ultimately recovered in 2019 on changing perceptions. Jerome Powell, the Federal Reserve Chairman, indicated the Fed would be more “patient” going forward in increasing interest rates, and President Trump’s tweet-storm on balance has been optimistic regarding the chances of hammering out a successful trade deal with China.
With the new cautious Fed perspective on interest rates, the yield on the 10-Year Treasury Note fell by -0.28% for the quarter from 2.69% to 2.41%. In fact, investors are currently betting there is a greater than 50% probability the Fed will cut interest rates before year-end. Moreover, in testimony before Congress, Powell signaled the economic dampening policy of reducing the Fed’s balance sheet was almost complete. All else equal, the shift from a perceived rate-hiking Fed to a potentially rate-cutting Fed has effectively turned an apparent headwind into tailwind. Consumers are benefiting from this trend in the housing market, as evidenced by lower 30-year fixed mortgage rates, which in some cases have dropped below 4%.
Economy: No Slam Dunk
However, not everything is a slam dunk in the financial markets. Much of the change in stance by the Fed can be attributed to slowing economic growth seen both here domestically and abroad, internationally.
Here in the U.S., the widely followed monthly jobs number last month only showed a gain of 20,000 jobs, well below estimates of 180,000 jobs. This negative jobs surprise was the biggest miss in more than 10 years. Furthermore, the overall measure for our nation’s economic activity, growth in Gross Domestic Product (GDP), was revised downward to +2.2% in Q4, below a previous estimate of +2.6%. The so-called “inverted yield curve” (i.e., short-term interest rates are higher than long-term interest rates), historically a precursor to a recession, is consistent with slowing growth expectations. This inversion temporarily caused investors some heartburn last month.
If you combine slowing domestic economic growth figures with decelerating manufacturing growth in Europe and China (e.g. contracting Purchasing Managers’ Index), then suddenly you end up with a slowing global growth picture. In recent months, the U.S. economy’s strength was perceived as decoupling from the rest of the world, however recent data could be changing that view.
Fortunately, the ECB (European Central Bank) and China have not been sitting on their hands. ECB President Mario Draghi announced three measures last month that could cumulatively add up to some modest economic stimulus. First, it “expects the key ECB interest rates to remain at their present levels at least through the end of 2019.” Second, it committed to reinvesting all maturing bond principal payments in new debt “for an extended period of time.” And third, the ECB announced a new batch of “Targeted Long-Term Refinancing Operations” starting in September. Also, Chinese Premier Li Keqiang announced the government will reduce taxes, primarily Value Added Taxes (VAT) and social security taxes (SST). Based on the rally in equities, it appears investors are optimistic these stimulus efforts will eventually succeed in reigniting growth.
Volume of Political Noise Ratcheted Higher
While I continually try to remind investors to ignore politics when it comes to their investment portfolios, the deafening noise was especially difficult to overlook considering the following:
- Mueller Report Completed: Robert Mueller’s Special Counsel investigation into potential collusion as it relates Russian election interference and alleged obstruction of justice concluded.
- Michael Cohen Testifies: Former President Trump lawyer, Michael Cohen, testified in closed sessions before the House and Senate intelligence committees, and in public to the House Oversight Committee. In the open session, Cohen, admitted to paying hush money to two women during the election. Cohen called President Trump a racist, a conman, and a cheat but Cohen is the one heading to jail after being sentenced for lying to Congress among other charges.
- Manafort Sentenced: Former Trump Campaign Chairman Paul Manafort was sentenced to prison on bank and tax fraud charges.
- North Korea No Nuke Deal: In geopolitics,President Trump flew 21 hours to Vietnam to meet for a second time with North Korean leader Kim Jong Un on denuclearization of the Korean peninsula. The U.S. president ended up leaving early, empty handed, without signing an agreement, after talks broke down over sanction differences.
- Brexit Drama Continues: The House of Commons in the lower house of the U.K. Parliament continued to stifle Prime Minister Theresa May’s plan to exit the European Union with repeated votes rejecting her proposals. Brexit outcomes remain in flux, however the European Union did approve an extension to May 22 to work out kinks, if the House can approve May’s plan.
Positive Signals Remain
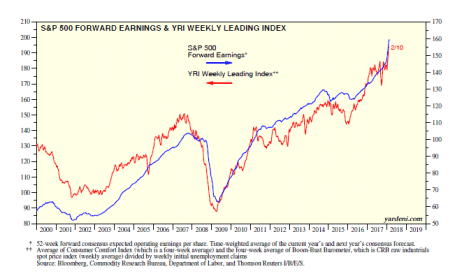
March Madness reminds us that a big lead can be lost quickly, however a few good adjustments can also swiftly shift momentum in the positive direction. Although growth appears to be slowing both here and internationally, corporate profits are not falling off a cliff, and earnings remain near record highs (see chart below).
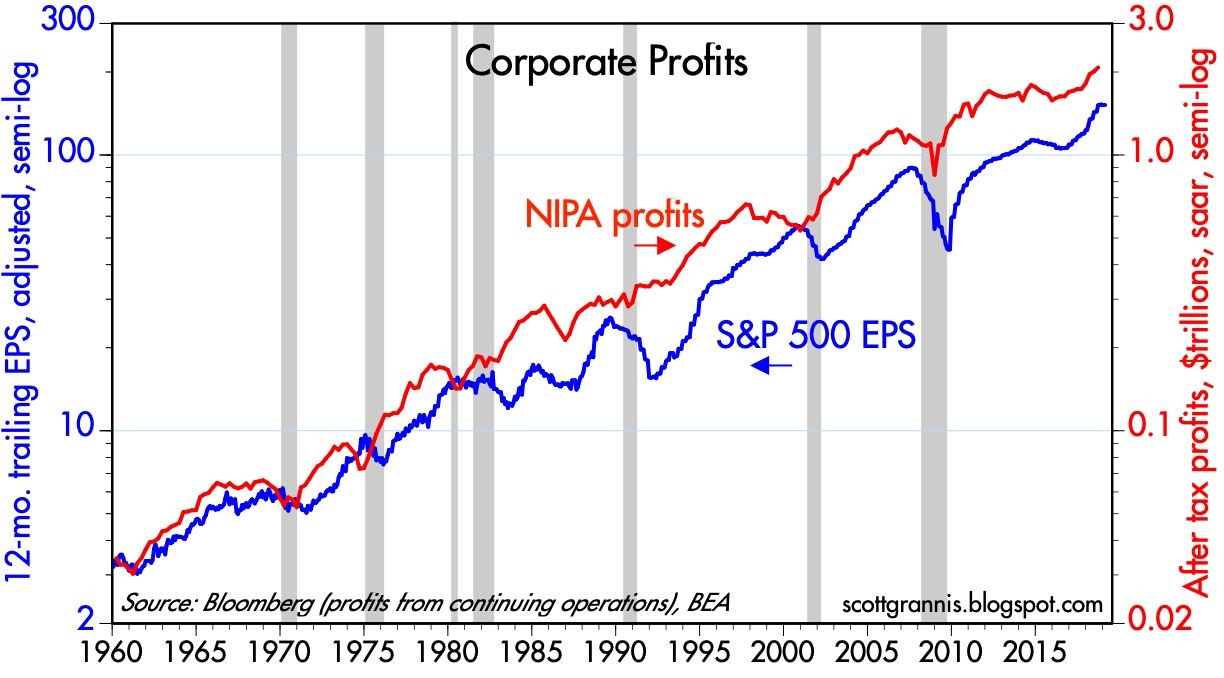
Source: Calafia Beach Pundit
Similar to the stock market, commodities can be a good general barometer of current and future economic activity. As you can see from the chart below, not only have commodity prices remained stable in the face of slowing economic data, but gold prices have not spiked as they did during the last financial crisis.
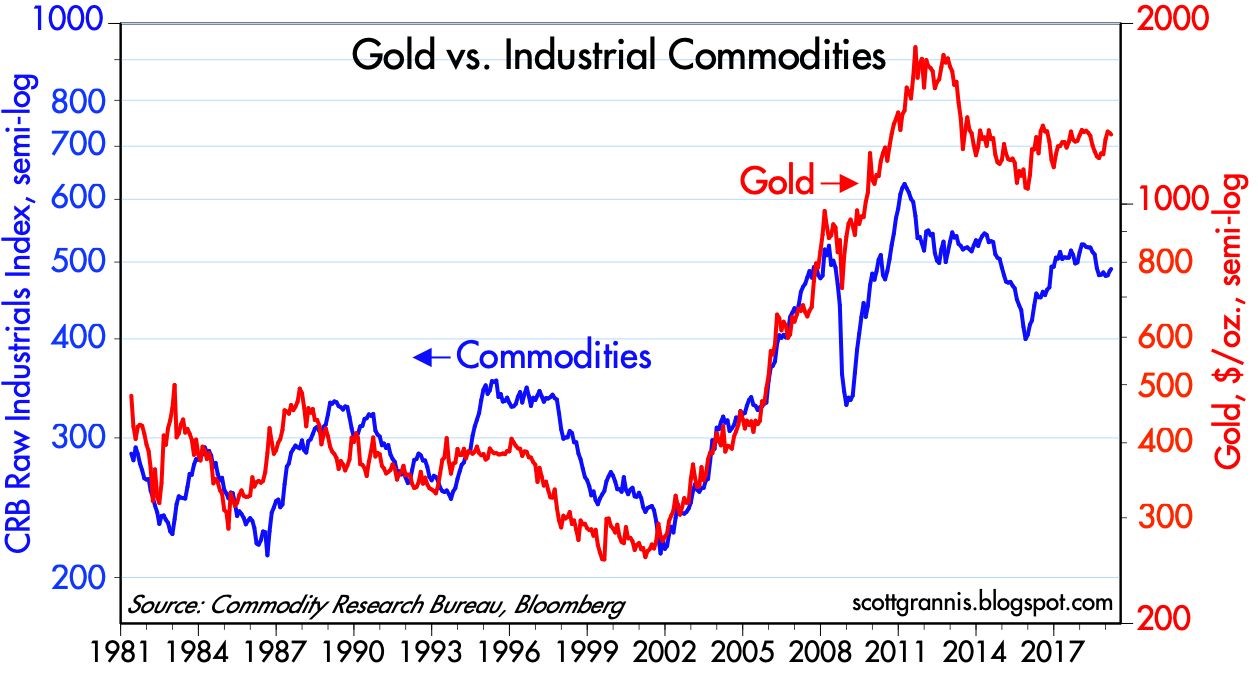
Source: Calafia Beach Pundit
After 2018 brought record growth in corporate profits and negative returns, 2019 is producing a reverse mirror image – slow profit growth and record returns. The volatile ending to 2018 and triumphant beginning to 2019 is a reminder that “March Madness” does not need to bring sadness…it can bring gladness.

Wade W. Slome, CFA, CFP®
Plan. Invest. Prosper.
This article is an excerpt from a previously released Sidoxia Capital Management complimentary newsletter (April 1, 2019). Subscribe on the right side of the page for the complete text.
DISCLOSURE: Sidoxia Capital Management (SCM) and some of its clients hold positions and certain exchange traded funds (ETFs), but at the time of publishing had no direct position in any other security referenced in this article. No information accessed through the Investing Caffeine (IC) website constitutes investment, financial, legal, tax or other advice nor is to be relied on in making an investment or other decision. Please read disclosure language on IC Contact page.
The Scary Blip

I hated it when my mom reminded me when I was a younger, but now that I’ve survived into middle-aged adulthood, I will give you the same medicine she gave me:
“I told you so.”
As I cautioned in last month’s newsletter, “It’s important for investors to remember this pace of gains cannot be sustainable forever.” I added that there were a whole bunch of scenarios for stock prices to go down or “stock prices could simply go down due to profit-taking.”
And that is exactly what we saw. From the peak achieved in late January, stock prices quickly dropped by -12% at the low in early February, with little-to-no explanation other than a vague blame-game on rising interest rates – the 2018 yield on the 10-Year Treasury Note rose from 2.4% to 2.9%. This explanation holds little water if you take into account interest rates on the 10-Year increased from roughly 1.5% to 3.0% in 2013 (“Taper Tantrum”), yet stock prices still rose +20%. The good news, at least for now, is the stock correction has been contained or mitigated. A significant chunk of the latest double-digit loss has been recovered, resulting in stock prices declining by a more manageable -3.9% for the month. Despite the monthly loss, the subsequent rebound in late February has still left investors with a gain of 1.5% for 2018. Not too shabby, especially considering this modest return comes on the heels of a heroic +19.4% gain in 2017.
As you can see at from the 22-year stock market chart below for the S&P 500, the brief but painful drop was merely a scary blip in the long-term scheme of things.
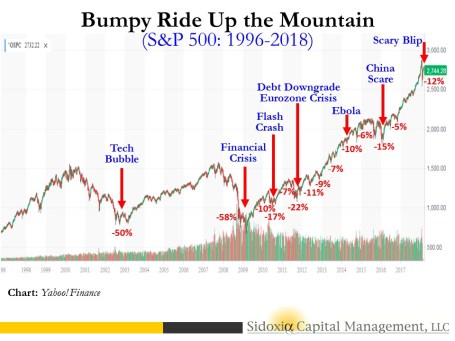
Whenever the market drops significantly over a short period of time, as it did this month, conspiracy theories usually come out of the woodwork in an attempt to explain the unexplainable. When human behavior is involved, rationalizing a true root cause can be very challenging, to say the least. It is certainly possible that technical factors contributed to the pace and scale of the recent decline, as has been the case in the past. Currently no smoking gun or fat finger has been discovered, however some pundits are arguing the popular usage of leveraged ETFs (Exchange Traded Funds) has contributed to the accelerated downdraft last month. Leveraged ETFs are special, extra-volatile trading funds that will move at amplified degrees – you can think of them as speculative trading vehicles on steroids. The low-cost nature, diversification benefits, and ability for traders to speculate on market swings and sector movements have led to an explosion in ETF assets to an estimated $4.6 trillion.
Regardless of the cause for the market drop, long-term investors have experienced these types of crashes in the past. Do you remember the 2010 Flash Crash (down -17%) or the October 1987 Crash (-23% one-day drop in the Dow Jones Industrial Average index)? Technology, or the lack thereof (circuit breakers), helped contribute to these past crashes. Since 1987, the networking and trading technologies have definitely become much more sophisticated, but so have the traders and their strategies.
Another risk I highlighted last month, which remains true today, is the potential for the new Federal Reserve chief, Jerome Powell, to institute a too aggressive monetary policy. During his recent testimony and answers to Congress, Powell dismissed the risks of an imminent recession. He blamed past recessions on previous Fed Chairmen who over enthusiastically increased interest rate targets too quickly. Powell’s comments should provide comfort to nervous investors. Regardless of short-term inflation fears, common sense dictates Powell will not want to crater the economy and his legacy by slamming the economic brakes via excessive rate hikes early during his Fed chief tenure.
Tax Cuts = Profit Gains
Despite the heightened volatility experienced in February, I remain fairly constructive on the equity investment outlook overall. The recently passed tax legislation (Tax Cuts and Job Act of 2017) has had an undeniably positive impact on corporate profits (see chart below of record profit forecasts – blue line). More specifically, approximately 75% of corporations (S&P 500 companies) have reported better-than-expected results for the past quarter ending December 31st. On an aggregate basis, quarterly profits have also risen an impressive +15% compared to last year. When you marry these stellar earnings results with the latest correction in stock prices, historically this combination of factors has proven to be a positive omen for investors.
Source: Dr. Ed’s Blog
Despite the rosy profit projections and recent economic strength, there is always an endless debate regarding the future direction of the economy and interest rates. This economic cycle is no different. When fundamentals are strong, stories of spiking inflation and overly aggressive interest rate hikes by the Fed rule the media airwaves. On the other hand, when fundamentals deteriorate or slow down, fears of a 2008-2009 financial crisis enter the zeitgeist. The same tug-of-war fundamental debate exists today. The stimulative impacts of tax cuts on corporate profits are undeniable, but investors remain anxious that the negative inflationary side-effects from a potential overheating economy could outweigh the positive economic momentum of a near full-employment economy gaining steam.
Rather than playing Goldilocks with your investment portfolio by trying to figure out whether the short-term stock market is too hot or too cold, you would be better served by focusing on your long-term asset allocation, and low-cost, tax-efficient investment strategy. If you don’t believe me, you should listen to the wealthiest, most successful investor of all-time, Warren Buffett (The Oracle of Omaha), who just published his annual shareholder letter. In his widely followed letter, Buffett stated, “Performance comes, performance goes. Fees never falter.” To emphasize his point, Buffett made a 10-year, $1 million bet for charity with a high-fee hedge fund manager (Protégé Partners). As part of the bet, Buffett claimed an investment in a low-fee S&P 500 index fund would outperform a selection of high-fee, hot-shot hedge fund managers. Unsurprisingly, the low-cost index fund trounced the hedge fund managers. From 2008-2017, Buffett’s index fund averaged +8.5% per year vs. +3.0% for the hedge fund managers.
During scary blips like the one experienced recently, lessons can be learned from successful, long-term billionaire investors like Warren Buffett, but lessons can also be learned from my mother. Do yourself a favor by getting your investment portfolio in order, so my mother won’t have to say, “I told you so.”
Wade W. Slome, CFA, CFP®
Plan. Invest. Prosper.
This article is an excerpt from a previously released Sidoxia Capital Management complimentary newsletter (March 1, 2018). Subscribe on the right side of the page for the complete text.
DISCLOSURE: Sidoxia Capital Management (SCM) and some of its clients hold positions in certain exchange traded funds (ETFs), but at the time of publishing had no direct position in any other security referenced in this article. No information accessed through the Investing Caffeine (IC) website constitutes investment, financial, legal, tax or other advice nor is to be relied on in making an investment or other decision. Please read disclosure language on IC Contact page.
A Recipe for Disaster

Justice does not always get served in the stock market because financial markets are not always efficient in the short-run (see Black-Eyes to Classic Economists). However, over the long-run, financial markets usually get it right. And when the laws of economics and physics are functioning properly, I must admit it, I do find it especially refreshing.
There can be numerous reasons for stocks to plummet in price, but common attributes to stock price declines often include profit losses and/or disproportionately high valuations (a.k.a. “bubbles”). Normally, your garden variety, recipe for disaster consists of one part highly valued company and one part money-losing operation (or deteriorating financials). The reverse holds true for a winning stock recipe. Flavorful results usually involve cheaply valued stocks paired with improving financial results.
Unfortunately, just because you have the proper recipe of investment ingredients, doesn’t mean you will immediately get to enjoy a satisfying feast. In other words, there isn’t a dinner bell rung to signal the timing of a crash or spike – sometimes there is a conspicuous catalyst and sometimes there is not. Frequently, investments require a longer expected bake time before the anticipated output is produced.
As I alluded to at the beginning of my post, justice is not always served immediately, but for some high profile IPOs, low-quality ingredients have indeed produced low-quality results.
Snap Inc. (SNAP): Let’s first start with the high-flying social media darling Snap, which priced its IPO at $17 per share in March, earlier this year. How can a beloved social media company that generates $515 million in annual revenue (up +286% in the recent quarter) see its stock plummet -48% from its high of $29.44 to $15.27 in just four short months? Well, one way of achieving these dismal results is to burn through more cash than you’re generating in revenue. Snap actually scorched through more than -$745 million dollars over the last year, as the company reported accounting losses of -$618 million (excluding -$2 billion of stock-based compensation expenses). We’ll find out if the financial bleeding will eventually stop, but even after this year’s stock price crash, investors are still giving the company the benefit of the doubt by valuing the company at $18 billion today.

Source: Barchart.com
Blue Apron Holdings Inc. (APRN): Online meal delivery favorite, Blue Apron, is another company suffering from the post-IPO blues. After initially targeting an opening IPO price of $15-$17 per share a few weeks ago, tepid demand forced Blue Apron executives to cut the price to $10. Fast forward to today, and the stock closed at $7.36, down -26% from the IPO price, and -57% below the high-end of the originally planned range. Although the company isn’t hemorrhaging losses at the same absolute level of Snap, it’s not a pretty picture. Blue Apron has still managed to burn -$83 million of cash on $795 million in annual sales. Unlike Snap (high margin advertising revenues), Blue Apron will become a low-profit margin business, even if the company has the fortune of reaching high volume scale. Even after considering Blue Apron’s $1 billion annual revenue run rate, which is 50% greater than Snap’s $600 million run-rate, Blue Apron’s $1.4 billion market value is sadly less than 10% of Snap’s market value.

Source: Barchart.com
Groupon Inc. (GRPN): Unlike Snap and Blue Apron, Groupon also has the flattering distinction of reporting an accounting profit, albeit a small one. However, on a cash-based analysis, Groupon looks a little better than the previous two companies mentioned, if you consider an annual -$7 million cash burn “better”. Competition in the online discounting space has been fierce, and as such, Groupon has experienced a competitive haircut in its share price. Groupon’s original IPO price was $20 in January 2011 before briefly spiking to $31. Today, the stock has languished to $4 (-87% from the 2011 peak).
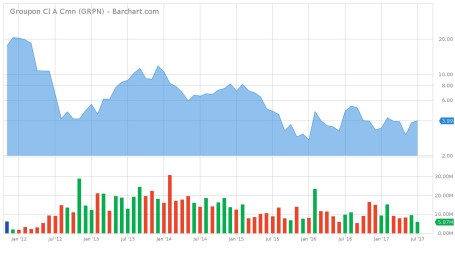
Source: Barchart.com
Stock Market Recipe?
Similar ingredients (i.e., valuations and profit trajectory) that apply to stock performance also apply to stock market performance. Despite record corporate profits (growing double digits), low unemployment, low inflation, low-interest rates, and a recovering global economy, bears and even rational observers have been worried about a looming market crash. Not only have the broader masses been worried today, yesterday, last week, last month, and last year, but they have also been worried for the last nine years. As I have documented repeatedly (see also Market Champagne Sits on Ice), the market has more than tripled to new record highs since early 2009, despite the strong under-current of endless cynicism.
Historically market tops have been marked by a period of excesses, including excessive emotions (i.e., euphoria). It has been a long time since the last recession, but economic downturns are also often marked with excessive leverage (e.g., housing in the mid-2000s), excessive capital (e.g., technology IPOs [Initial Public Offerings] in the late-1990s), and excessive investment (e.g., construction / manufacturing in early-1990s).
To date, we have seen little evidence of these markers. Certainly there have been pockets of excesses, including overpriced billion dollar tech unicorns (see Dying Unicorns), exorbitant commercial real estate prices, and a bubble in global sovereign debt, but on a broad basis, I have consistently said stocks are reasonably priced in light of record-low interest rates, a view also held by Warren Buffett.
The key lessons to learn, whether you are investing in individual stocks or the stock market more broadly, are that prices will follow the direction of earnings over the long-run. This helps explain why stock prices always go down in recessions (and are volatile in anticipation of recessions).
If you are looking for a recipe for disaster, just find an overpriced investment with money-losing (or deteriorating) characteristics. Avoiding these investments and identifying investments with cheap growth qualities is much easier said than done. However, by mixing an objective, quantitative framework with more artistic fundamental analysis, you will be in a position of enjoying tastier returns.
Wade W. Slome, CFA, CFP®
Plan. Invest. Prosper.
DISCLOSURE: Sidoxia Capital Management (SCM) and some of its clients hold positions in certain exchange traded funds (ETFs), but at the time of publishing, SCM had no direct position in SNAP, APRN, GRPN, or any other security referenced in this article. No information accessed through the Investing Caffeine (IC) website constitutes investment, financial, legal, tax or other advice nor is the information to be relied on in making an investment or other decision. Please read disclosure language on IC Contact page.
Sports, Stocks, & the Magic Quadrants

Picking stocks is a tricky game and so is sports betting. With the NFL and NCAA football seasons only a few months away, we can analyze the professional sports-betting industry to better understand the complexities behind making money in the stock market. Anybody who has traveled to Las Vegas, and bet on a sporting event, understands that simply choosing a game winner is not enough for a casino to pay you winnings. You also need to forecast how many points you think a certain team will win or lose by (i.e., the so-called “spread”) – see also What Happens in Vegas, Stays on Wall Street. In the world of stocks, winning/losing is not measured by spreads but rather equities are measured by valuation (e.g., Price/Earnings or P/E ratios).
To make my point, here is a sports betting example from some years back:
Florida Gators vs. Charleston Southern Buccaneers: Without knowing a lot about the powerhouse Southern Buccaneers squad from South Carolina, 99% of respondents polled before the game are likely to unanimously select the winner as Florida – a consistently dominant, nationally ranked powerhouse program. The tougher question becomes trickier if football observers are asked, “Will the Florida Gators win by more than 63 points?”(see picture below). Needless to say, although the Buccs kept it close in the first half, and only trailed by 42-3 at halftime, the Gators still managed to squeak by with a 62-3 victory. Importantly, if you had bet on this game and placed money on the Florida Gators, the overwhelming pre-game favorite, the 59 point margin of victory would have resulted in a losing wager. In order for Gator fans to win money, they would have needed Florida to win by 64 points.

If investing and sports betting were easy, everybody would do it. The reason sports betting is so challenging is due to very intelligent statisticians and odds-makers that create very accurate point spreads. In the investing world, a broad swath of traders, market makers, speculators, investment bankers, and institutional/individual investors set equally efficient valuations over the long-term.
The goal in investing is very similar to sports betting. Successful professionals in both industries are able to consistently identify inefficiencies and then exploit them. Inefficiencies occur for a bettor when point spreads are too high or low, while investors identify inefficient prices in the marketplace by shorting expensive stocks and buying cheap stocks (i.e., undervalued or overvalued).
To illustrate my point, let’s take a look at Sidoxia’s “Magic Quadrant“:
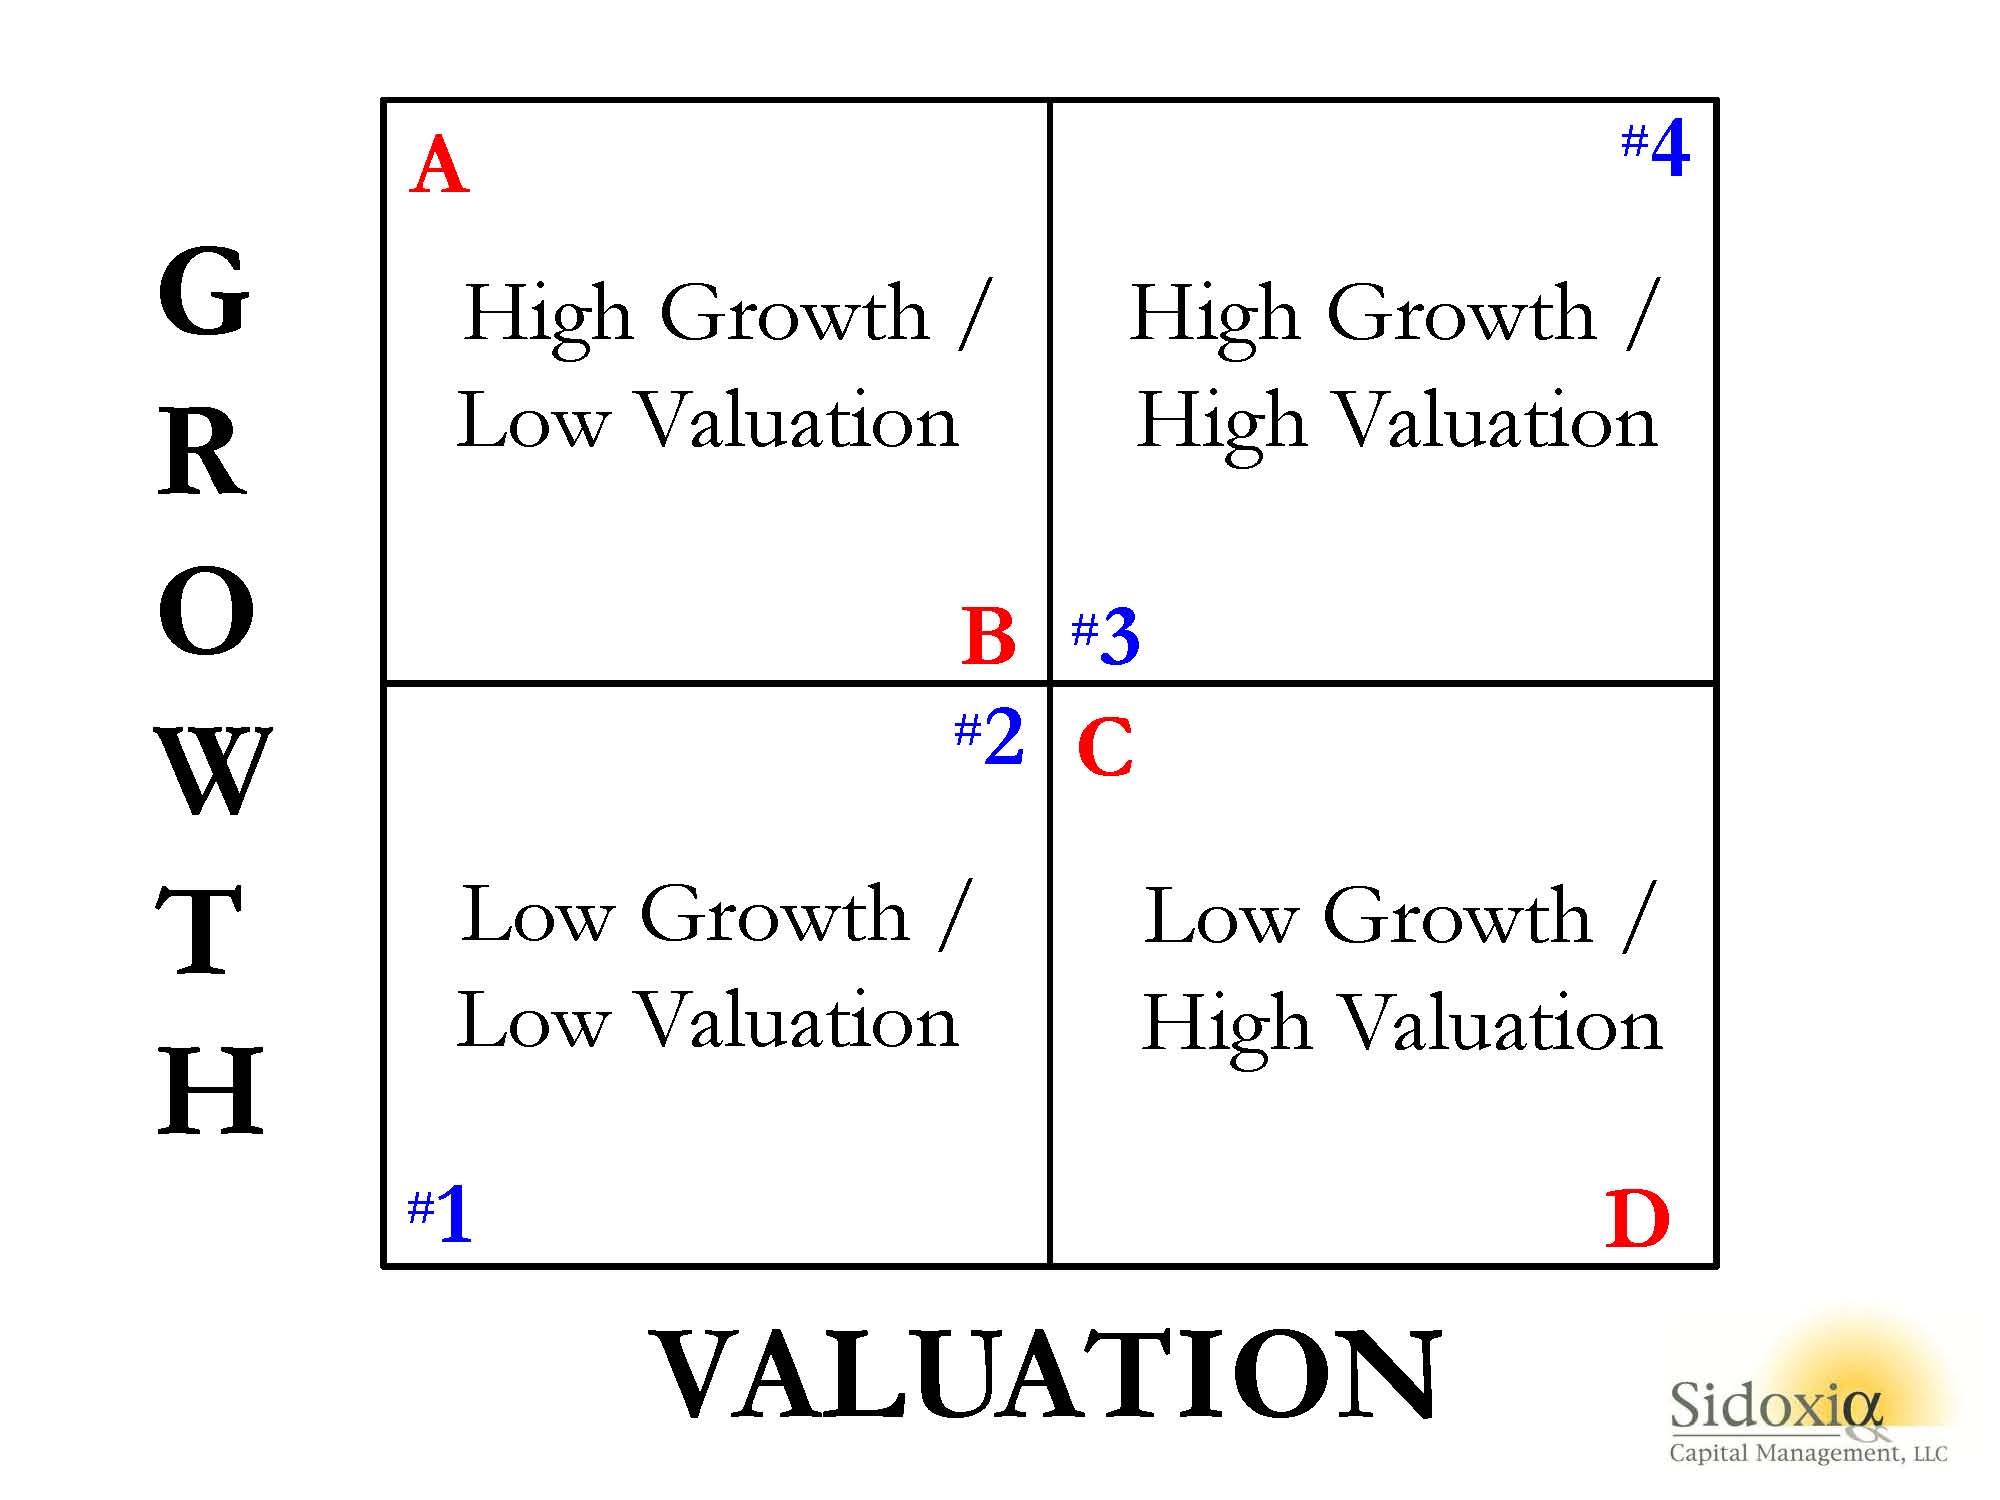 A-B-Cs & 1-2-3s
What Sidoxia’s “Magic Quadrant” demonstrates is a framework for evaluating stocks. By devoting a short period of time reviewing the quadrants, it becomes apparent fairly quickly that Stock A is preferred over Stock B, which is preferred over Stock C, which is preferred over Stock D. In each comparison, the former is preferred over the latter because the earlier letters all have higher growth, and lower (cheaper) valuations. The same relative attractive relationships cannot be applied to stocks #1, #2, #3, and #4. Each successive numbered stock has higher growth, but in order to obtain that higher growth, investors must pay a higher valuation. In other words, Stock #1 has an extremely low valuation with low growth, while Stock #4 has high growth, but an investor must pay an extremely high valuation to own it.
While debating the efficiency of the stock market can escalate into a religious argument, I would argue the majority of stocks fall in the camp of #1, #2, #3, or #4. Or stated differently, you get what you pay for. For example, investors are paying a much higher valuation (high P/E) for Tesla Motors, Inc (TSLA) for its rapid electric car growth vs. paying a much lower valuation (low P/E) for Pitney Bowes Inc (PBI) for its more mature mail equipment business.
The real opportunities occur for those investors capable of identifying companies in the upper-left quadrant (i.e., Stock A) and lower-right quadrant (i.e., Stock D). If the analysis is done correctly, investors will load up on the undervalued Stock A and aggressively short the expensive Stock D. Sidoxia has its own proprietary valuation model (Sidoxia Holy Grail Ranking – SHGR or a.k.a. “SUGAR”) designed specifically to identify these profitable opportunities.
The professions of investing and sports betting are extremely challenging, however establishing a framework like Sidoxia’s “Magic Quadrants” can help guide you to find inefficient and profitable investment opportunities.
Wade W. Slome, CFA, CFP®
Plan. Invest. Prosper.
DISCLOSURE: Sidoxia Capital Management (SCM) and some of its clients hold positions in certain exchange traded funds (ETFs) and TSLA, but at the time of publishing, SCM had no direct position in PBI, or any other security referenced in this article. No information accessed through the Investing Caffeine (IC) website constitutes investment, financial, legal, tax or other advice nor is the information to be relied on in making an investment or other decision. Please read disclosure language on IC Contact page.
March Madness or Retirement Sadness?

This article is an excerpt from a previously released Sidoxia Capital Management complimentary newsletter (March 1, 2017). Subscribe on the right side of the page for the complete text.
“March Madness” begins in a few weeks with a start of the 68-team NCAA college basketball tournament, but there has also been plenty of other economic and political madness going on in the background. As it relates to the stock market, the Dow Jones Industrial Average index reached a new, all-time record high last month, exceeding the psychologically prominent level of 20,000 (closing the month at 20,812). For the month, the Dow rose an impressive +4.8%, and since November’s presidential election it catapulted an even more remarkable +13.5%.
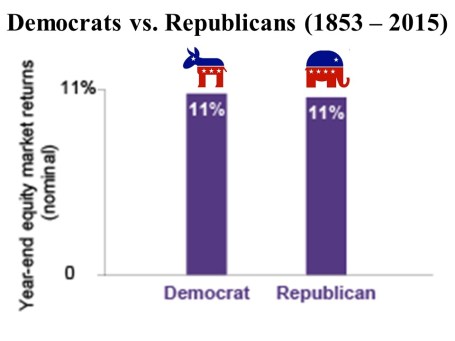
Despite our 45th president just completing his first State of the Union address to the nation, American voters remain sharply divided across political lines, and that bias is not likely to change any time soon. Fortunately, as I’ve written on numerous occasions (see Politics & Your Money), politics have no long-term impact on your finances and retirement. Sure, in the short-run, legislative policies can create winners and losers across particular companies and industries, but history is firmly on your side if you consider the positive track record of stocks over the last couple of centuries. As the chart below demonstrates, over the last 150 years or so, stock performance is roughly the same across parties (up +11% annually), whether you identify with a red elephant or a blue donkey.
Nevertheless, political rants flooding our Facebook news feeds can confuse investors and scare people into inaction. Pervasive fake news stories regarding the supposed policy benefits and shortcomings of immigration, tax reform, terrorism, entitlements, foreign policy, and economic issues often result in heightened misperception and anxiety.
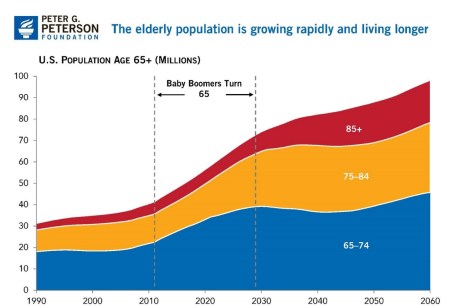
More important than reading Facebook political rants, watching March Madness basketball, or drinking green beer on St. Patrick’s Day, is saving money for retirement. While some of these diversions can be temporarily satisfying and entertaining, lost in the daily shuffle is the retirement epidemic quietly lurking in the background. Managing money makes people nervous even though it is an essential part of life. Retirement planning is critical because a mountain of the 76 million Baby Boomers born between 1946 – 1964 have already reached retirement age and are not ready (see chart below).
The critical problem is most Americans are ill-prepared financially for retirement, and many of them run the risk of outliving their savings. A recent study conducted by the Economic Policy Institute (EPI) shows that nearly half of families have no retirement account savings at all. The findings go on to highlight that the median U.S. family only has $5,000 in savings (see also Getting to Your Number). Even after considering my tight-fisted habits, that kind of money wouldn’t be enough cash for me to survive on.
Saving and investing have never been more important. It doesn’t take a genius to understand that government entitlements like Social Security and Medicare are at risk for millions of Americans. While I am definitely not sounding the alarm for current retirees who have secure benefits, there are millions of others whose retirement benefits are in jeopardy.
Missing the 20,000 Point Boat? Dow 100,000
Making matters worse, saving and investing has never been more challenging. If you thought handling all of life’s responsibilities was tough enough already, try the impossible task of interpreting the avalanche of instantaneous political and economic headlines pouring over our electronic devices at lighting speed.
Knee-jerk reactions to headlines might give investors a false sense of security, but the near-impossibility of consistently timing the stock market has not stopped people from attempting to do so. For example, recently I have been bombarded with the same question, “Wade, don’t you think the stock market is overpriced now that we have eclipsed 20,000?” The short answer is “no,” given the current factors (see Don’t Be a Fool). Thankfully, I’m not alone in this response. Warren Buffett, the wealthiest billionaire investor on the planet, answered the same question this week after investing $20,000,000,000 more in stocks post the election:
“People talk about 20,000 being high. Well, I remember when it hit 200 and that was supposedly high….You know, you’re going to see a Dow [in your lifetime] that certainly approaches 100,000 and that doesn’t require any miracles, that just requires the American system continuing to function pretty much as it has.”
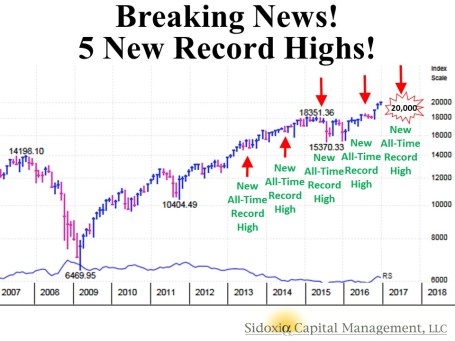
Like a deer in headlights, many Americans have been scared into complacency. To their detriment, many savers have sat silently on the sidelines earning near-0% returns on their savings, while the stock market has reached new all-time record highs. While Dow 20,000 might be new news for some, the reality is new all-time record highs have repeatedly been achieved in 2013, 2014, 2015, 2016, and now 2017 (see chart below).
While I am not advocating for all people to throw their entire savings into stocks, it is vitally important for individuals to construct diversified portfolios across a wide range of asset classes, subject to each person’s unique objectives, constraints, risk tolerance, and time horizon. The risk of outliving your savings is real, so if you need assistance, seek out an experienced professional. March Madness may be here, but don’t get distracted. Make investing a priority, so your daily madness doesn’t turn into retirement sadness.
Wade W. Slome, CFA, CFP®
Plan. Invest. Prosper.
DISCLOSURE: Sidoxia Capital Management (SCM) and some of its clients hold positions in FB and certain exchange traded funds (ETFs), but at the time of publishing had no direct position in any other security referenced in this article. No information accessed through the Investing Caffeine (IC) website constitutes investment, financial, legal, tax or other advice nor is to be relied on in making an investment or other decision. Please read disclosure language on IC Contact page.
Become the Landlord of Your Stocks

“Why do you buy stocks?” Unfortunately, many people do not truly understand how to answer that particular question. If they were honest with themselves, many stockholders would respond by saying, “Because they are going up in price,” or maybe, “My neighbor told me to buy stock XYZ.” However, if somebody asked the same question regarding the purchase of a real estate property or an apartment building, would the answer be the same? The short answer is…probably not. There certainly could be some people who answer the stock versus real estate valuation question in the same way, but in general, real estate investors understand the tangibility and relevant factors of a property better than equity investors understand the jargon and abstract nature of most stocks.
There are many ways to value an asset, but in many cases, the value of an asset is spontaneously left in the eye of the beholder. Nevertheless, there is one common approach, applicable across asset classes, which is the net present value or discounted cash flow approach. This valuation methodology basically states any asset is worth the cumulative value of cash inflows minus the value of cash outflows, after adjusting that netted figure for time and interest rates.
In the case of an apartment building, a layman generally understands the basic valuation concept behind adding up the relevant cash inflows and cash outflows. For example, being a landlord of an apartment building involves simple rent collection (cash inflows) in addition to maintenance, repairs, construction costs, employee wages, taxes, and other payments (cash outflows). After making additional assumptions about future rent increases, occupancy levels, wage inflation, and a few other variables, many outside observers could probably come up with a decent estimated value of the property.
The variables relating to an apartment building may be more stable, predictable, and understandable, if compared with the variables of a stock, but the same exact principles apply to both asset classes. Wal-Mart may not collect stable rent checks, but it does collect money from product sales in its 11,500 stores around the world (cash inflows). Wal-Mart’s cash inflows are much less predictable than real estate rent check inflows due to the many retail-specific variables, such as store openings/closings, online competition, promotions, seasonality, inventory levels, and geographic economics. Expenses (cash outflows) are challenging to predict as well due to wage fluctuations, energy cost variability, capital project timing, erratic raw material prices, and other factors. In the end, stock variables may be more volatile and less predictable, but the valuation process should be the same. Valuing stocks requires estimating the cumulative value of cash inflows minus the value of cash outflows, and then adjusting those results for time and interest rates.
Real estate has its own industry language, but the language of stocks has an endless number of acronyms, which can be quite challenging if you consider the dozens of industries and thousands of stocks. Here are a few of my favorite obscure acronyms used across the technology, healthcare, energy, and retail sectors:
Technology: 4G, CDMA, DSLAM, LTE, MPLS, SaaS, SRAM
Energy: BCF, BOE, BTU, EIA, Gwh, kWh, LNG, MWh, WTI
Healthcare: AARP, CRM, DRG, EENT, FDA, HIPAA, MI, SARS
Retail: B2B, EDI, EDLP, GMROI, POS, RFID, SCM, SKU, UPC
As noted earlier, the language and complexity for valuing stocks may be more complicated than valuing other more straightforward asset classes, but the methodology is essentially the same.
The opportunities and rewards stemming from stock ownership are almost endless. While it’s true that successful long-term stock investing is rarely easy, anything worthwhile in life is never simple. If you are able to understand the principal concepts of how to become an effective landlord of real estate, then applying the same principles on how to become an effective landlord of your stock portfolio is highly achievable.
Wade W. Slome, CFA, CFP®
Plan. Invest. Prosper.
DISCLOSURE: Sidoxia Capital Management (SCM) and some of its clients hold positions in certain exchange traded funds (ETFs), but at the time of publishing had no direct position in WMT or any other security referenced in this article. No information accessed through the Investing Caffeine (IC) website constitutes investment, financial, legal, tax or other advice nor is to be relied on in making an investment or other decision. Please read disclosure language on IC Contact page.


