Posts tagged ‘Twitter’
NVEC: A Cash Plump Activist Target…For Icahn?

Some might call Carl Icahn a greedy capitalist, but at the core, the 78 year old activist has built his billions in fortunes by unlocking shareholder value in undervalued companies. His targets have come in many shapes and sizes, but one type of target is cash bloated companies without defined capital allocation strategies. A recent high profile example of a cash ballooned target of Icahn was none other than the $591+ billion behemoth Apple Inc. (AAPL).
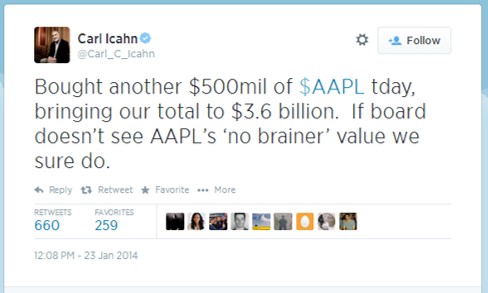
His initial tweet on August 13, 2013 announced his “large position” in the “extremely undervalued shares” of Apple ($67 split adjusted). We have been long-term shareholders of Apple ourselves and actually beat Carl to the punch three years earlier when the shares were trading at $35 – see Jobs: The Gluttonous Cash Hog. Icahn doesn’t just nonchalantly make outrageous claims…he puts his money where his mouth is. After Icahn’s initial proclamation, he went onto build a substantial $3.6 billion Apple position by January 2014.
Icahn initially demanded Apple’s CEO Tim Cook to execute a $150 billion share repurchase program before downgrading his proposal to a $50 billion buyback. After receiving continued resistance, Icahn eventually relented in February 2014. But Icahn’s blood, sweat, and tears did not go to waste. His total return in Apple from his initial announcement approximates +50%, in less than one year. And although Icahn wanted more action taken by the company’s management team, Apple has repurchased about $50 billion in stock and paid out $14 billion in dividends to investors over the last five quarters. Despite the significant amount of capital returned to shareholders over the last year, Apple still holds a gargantuan net cash position of $133.5 billion, up approximately $3 billion from the 2013 fiscal third quarter.
Icahn’s Next Cash Plump Target?
Mr. Icahn is continually on the prowl for new targets, and if he played in the small cap stock arena, NVE Corp. (NVEC) certainly holds the characteristics of a cash bloated company without a defined capital allocation strategy. Although I rarely write about my hedge fund stock holdings, followers of my Investing Caffeine blog may recognize the name NVE Corp. More specifically, in 2010 I picked NVEC as my top stock pick of the year (see NVEC: Profiting from Electronic Eyes, Nerves & Brains). The good news is that NVEC outperformed the market by approximately +25% that year (+36% vs 11% for the S&P 500). Over the ensuing years, the performance has been more modest – the +42% return from early 2010 has underperformed the overall stock market.
Rather than rehash my whole prior investment thesis, I would point you to the original article for a summary of NVE’s fundamentals. Suffice it to say, however, that NVE’s prospects are just as positive (if not more so) today as they were five years ago.
Here are some NVE data points that Mr. Icahn may find interesting:
- 60% operating margins (achieved by < 1% of all non-financial companies FINVIZ)
- 0% debt
- 15% EPS growth over the last seven years ($1.00 to $2.29)
- Cutting edge, patent protected, market leading spintronic technology
- +7% Free Cash Flow yield ($13m FCF / $194 adjusted market value) $294m market cap minus $100m cash.
- $100 million in cash on the balance sheet, equal to 34% of the company’s market value ($294m). For comparison purposes to NVE, Apple’s $133 billion in cash currently equates to about 23% of its market cap.
Miserly Management
As I noted in my previous NVE article, my beef with the management team has not been their execution. Despite volatile product sales in recent years, it’s difficult to argue with NVE CEO Dan Baker’s steering of outstanding bottom-line success while at the helm. Over Baker’s tenure, NVE has spearheaded meteoric earnings growth from EPS of $.05 in 2009 to $2.29 in fiscal 2013. Nevertheless, management not only has a fiduciary duty to prudently manage the company’s operations, but it also has a duty to prudently manage the company’s capital allocation strategy, and that is where NVE is falling short. By holding $100 million in cash, NVE is being recklessly conservative.
Is there a reason management is being so stingy with their cash hoard? Even with cash tripling over the last five years ($32m to $100m) and operating margins surpassing an incomprehensibly high threshold (60%), NVE still has managed to open their wallets to pursue these costly actions:
- Double Capacity: NVE doubled their manufacturing capacity in fiscal 2013 with minimal investment ($2.8 million);
- Defend Patents: NVE fought and settled an expensive patent dispute against Motorola spinoff (Everspin) as it related to the company’s promising MRAM technology;
- R&D Expansion: The company shored up its research and development efforts, as evidenced by the +39% increase in fiscal 2014 R&D expenditures, to $3.6 million.
The massive surge in cash after these significant expenditures highlights the indefensible logic behind holding such a large cash mound. How can we put NVE’s pile of cash into perspective? Well for starters, $100 million is enough cash to pay for 110 years of CAPEX (capital expenditures), if you simply took the company’s five year spending average. Currently, the company is adding to the money mountain at a clip of $13,000,000 annually, so the amount of cash will only become more ridiculous over time, if the management team continues to sit on their hands.
To their credit, NVE dipped half of a pinky toe in the capital allocation pool in 2009 with a share repurchase program announcement. Since the share repurchase was approved, the cash on the balance sheet has more than tripled from the then $32 million level. To make matters worse, the authorization was for a meaningless amount of $2.5 million. Over a five year period since the initial announcement, the company has bought an irrelevant 0.5% of shares outstanding (or a mere 25,393 shares).
A Prudent Proposal
The math does not require a Ph.D. in rocket science. With interest rates near a generational low, management is destroying value as inflation eats away at the growing $100 million cash hoard. I believe any CFO, including NVE’s Curt Reynders, can be convinced that earning +7% on NVE shares (or +15% if earnings compound at historical rates for the next five years) is better than earning +2% in the bank. Or in other words, buying back stock by NVE would be massively accretive to EPS growth. Conceptually, if NVE used all $100 million of its cash to buy back stock at current prices, NVE’s current EPS of $2.59 would skyrocket to $3.63 (+40%).
A more reasonable proposal would be for NVE management to buy back 10% of NVE’s stock and simultaneously implement a 2% dividend. At current prices, these actions would still leave a healthy balance of about $75 million in cash on the balance sheet by the end of the fiscal year, which would arguably still leave cash at levels larger than necessary.
Despite the capital allocation miscues, NVE has incredibly bright prospects ahead, and the recently reported quarterly results showing +37% revenue growth and +57% EPS growth is proof positive. As a fellow long-term shareholder, I share management’s vision of a bright future, in which NVE continues to proliferate its unique and patented spintronic technology. With market leadership in nanotechnology sensors, couplers, and MRAM memory, NVE is uniquely positioned to take advantage of game changing growth in markets such as nanotechnology biosensors, electric drive vehicles (EDVs), consumer electronic compassing, and next generation MRAM technology. If NVE can continue to efficiently execute its business plan and couple this with a consistent capital allocation discipline, there’s no reason NVE shares can’t reach $100 per share over the next three to five years.
While NVE continues to execute on their growth vision, they can do themselves and their shareholders a huge favor by implementing a shareholder enhancing capital return plan. Carl Icahn is all smiles now after his successful investments in Apple and Herbalife (HLF), but impatient investors and other like-minded activists may be lurking and frowning, if NVE continues to irresponsibly ignore its swelling $100 million cash hoard.
Wade W. Slome, CFA, CFP®
Plan. Invest. Prosper.
DISCLOSURE: Sidoxia Capital Management (SCM) and some of its clients hold long positions in Apple Inc. (AAPL), NVE Corp. (NVEC), and certain exchange traded funds, but at the time of publishing SCM had no direct position in TWTR, MOT, Everspin, HLF, or any other security referenced in this article. No information accessed through the Investing Caffeine (IC) website constitutes investment, financial, legal, tax or other advice nor is to be relied on in making an investment or other decision. Please read disclosure language on IC Contact page.
Rebuilding after the Political & Economic Tsunami

Excerpt from Free April Sidoxia Monthly Newsletter (Subscribe on right-side of page)
The Start of the Arab Uprising
The Arab uprising grew its roots from an isolated and disgraced Tunisian fruit vendor (26- year-old Mohammed Bouazizi) who burned himself to death in protest of the persistent, deep-seeded corruption prevalent throughout the government (view excellent 60 Minutes story on Tunisia uprising). The horrific death ultimately led to the swift removal of Egypt’s 30-year President Hosni Mubarak, whose ejection was spurred by massive Facebook-organized protests. Technology has flattened the world and accelerated the sharing of powerful ideas, which has awoken Arab citizens to see the greener grass across other global democratic nations. Facebook, Twitter, and LinkedIn can be incredible black-holes of productivity destroyers (I know firsthand), but as recent events have proven, these social networking services, which handle about 1 billion users globally, can also serve valuable purposes.
As the flames of unrest have been fanned across the Middle East and Northern Africa, autocratic dictators haven’t had the luxury of idly sitting on their hands. Instead, these leaders have been pushed to relent to the citizens’ wishes by addressing previously taboo issues, such as human rights, corruption, and economic opportunity. These fresh events feel like new-found changes, but these major social tectonic shifts have been occurring throughout history, including our lifetimes (e.g., Tiananmen Square massacre and the fall of the Berlin Wall).
Good News or Bad News?

Recent headlines have created angst among the masses, and the uncertainty has investors asking a lot of questions. Besides radioactive concerns in both Japan and the Middle East (one actual, one figurative), the “worry list” of items continues to stack higher. Oil prices, inflation, the collapsing dollar, exploding deficits, a China bubble, foreclosures, unemployment, quantitative easing (QE2), mountainous debt, 2012 elections, and the end of the world among others, are worries crowding people’s brains. Incredibly, somehow the market still manages to grind higher. More specifically, the Dow Jones Industrial Average has climbed a very respectable +6.4% for 2011.
With the endless number of worries, how on earth could the major market indexes still advance, especially after a doubling in value from 24 months ago? For one, these political and economic shocks are nothing new. History has shown us that democratic, capitalistic markets ultimately move higher in the face of wars, assassinations, banking crises, currency crises, and various other stock market frauds and scandals. I’m willing to go out on a limb and say these worrisome events will continue this year, next year, and even over the next decade.
Most baby boomers living in the early 1980s remember when 30-year mortgage rates on homes reached 18.5%, inflation hit 14.8%, and the Federal Funds interest rate peaked near 20%. Boomers also survived Vietnam, Watergate, the Middle East oil embargo, Iranian hostage crisis, 1987 Black Monday, collapse of the S&L banks, the rise and fall of the Cold War, Gulf War I/II, yada, yada, yada. Despite all these cataclysmic events, from the last birth of the Baby Boomers (1964), the Dow Jones Industrial catapulted from about 890 to 12,320. This is no April Fool’s joke! The market has increased a whopping 14-fold (without dividends) in the face of all this gruesome news. You won’t find that story on the front-page of The Wall Street Journal.
Lost Decade Goes on Sale

The gains over the last four and half decades have been substantial, but much more is said about the recent “Lost Decade.” Although it has generally been a lousy decade for most investors in the stock market, eventually the stock market follows the direction of profits. What the popular press negates to mention is that S&P 500 operating earnings have more than doubled from about $47 in 1999 to an estimated $97 in 2011. Over the same period, the price of the market has been chopped by more than half (i.e., the Price – Earnings multiple has been cut from 29x to 13.5x). With stocks selling at greater than -50% off from 1999, no wonder smart investors like Warren Buffett are buying America – Buffett just spent $9 billion in cash on buying Lubrizol Corp (LZ). Retail investors absolutely loved stocks in 2000 at the peak, believing there was virtually no risk. Now the tables have been turned and while stock prices are trading at a -50% discount, retail investors are intensely skeptical and nervous about the prospects for stocks. Shoppers don’t usually wait for prices to go up 30% and then say, “Oh goody, prices are much higher now, so I think I will buy!” but that is what they are saying now.
I don’t want to oversell my enthusiasm, because the deals were dramatically better in March of 2009. Hindsight is 20-20, but at the nadir of the stock market, stock prices traded at bargain basement levels of 7x times 2011 earnings. We may not see opportunities like that again in our lifetime, so sitting in cash may not be the most advisable positioning.
Although I would argue every investor should have some exposure to equities, an investor’s time horizon, objectives, constraints and risk tolerance should be the key determinants of whether your investment portfolio should have 5% equity exposure or 95% exposure.
So while the economic and political dominoes may appear to be tumbling based on the news du jour, don’t let the headlines and the so-called media pundits scare you into paralysis. Bad news and tragedy will continue, but fortunately when it comes to prosperity, history is on our side. As you attempt to organize and pickup the financial pieces of the last few years, make sure you have a disciplined, long-term investment plan that adapts to changing market and personal conditions.
Wade W. Slome, CFA, CFP®
Plan. Invest. Prosper.
DISCLOSURE: Sidoxia Capital Management (SCM) and some of its clients own certain exchange traded funds, but at the time of publishing SCM had no direct position in LZ, Facebook, Twitter, LinkedIn, BRKA/B, or any other security referenced in this article. No information accessed through the Investing Caffeine (IC) website constitutes investment, financial, legal, tax or other advice nor is to be relied on in making an investment or other decision. Please read disclosure language on IC “Contact” page.
Equity Life Cycle: The Moneyball Approach

Building a portfolio of stocks is a little like assembling a baseball team. However, unlike a team of real baseball players, constructing a portfolio of stocks can mix low-priced single-A farm players with blue chip Hall of Fame players from the Majors. Billy Beane, the General Manager for the Oakland Athletics, was chronicled in Michael Lewis’ book, Moneyball. Beane creates an amazing proprietary system of building teams more cost-efficiently than his deep-pocketed counterparts by statistically identifying undervalued players with higher on-base and slugging percentages. According to Beane, traditional baseball scouts were overpaying for less relevant factors, such as speed (stolen bases) and hitting (batting percentage).
In the stock world, before you can scout your team, you must first determine where in the life cycle the company lies. If Beane were to name this quality, perhaps he would call it Time-to-Maturity (TTM). Some companies operate in small, mature bitterly competitive industries (e.g. shoe laces), while others may operate in large growing markets (e.g. Google [GOOG] in online advertising and algorithmic search). Some companies because of negative regulation or heightened competition have a very short life cycle from early growth to maturity. Other companies with competitive advantages and untapped growth markets can have very long life spans before reaching maturity (think of a younger Coca Cola [KO] or Starbucks [SBUX]). Like Beane talks about in his book, many young, promising, immature baseball players flame out with short TTMs, nonetheless many scouts overpay for the cache´ such players offer.
Unfortunately, many investors do not even contemplate the TTM of their stock. Buying juvenile stocks (i.e., private companies like Twitter & Facebook – see article) or elderly stocks in and of itself is not a bad thing, but before you price a security it’s advantageous to know what type of discount or premium is deserved. Obviously, I’m looking for undervalued stocks across all age spectrums, however finding an undervalued, undiscovered late-teen just beginning on its long runway of growth combines the best of all worlds. Finding what Peter Lynch calls the “multi-baggers” is easier said than done, like searching for a needle in a haystack, but the rewards can be handsome.

What creates long runways of growth – the equivalent of winning dynasties in baseball? Well, there are several contributors leading to longer TTMs, including economies of scale, large industries, barriers to entry, competitive advantages, growing industries, superior and experienced management teams, to name a few factors. But like anything, even the great growth companies, including Microsoft (MSFT), turn from teenagers to mature adults. As famed businessman Thomas Brittingham said, “A good horse can’t go on winning races forever, and a good stock eventually passes its peak, too.”
There are many aspects to creating a winning team. If Billy Beane were to draw up factors for a baseball team, I’m confident TTM would be near the top of his list. What you pay for the length of the growth cycle is obviously imperative, but since I’m a strong believer in the tenet that “price follows earnings,” it only makes sense that above average sustainable earnings growth should eventually lead to superior price appreciation. As Bob Smith, successful manager from T. Rowe Price states, “The important thing is not what you pay for the stock, so much as being right on the company.” So if you want to recruit a portfolio of winning stocks, like Billy Beane picks successful baseball players, then include the equity life cycle maturity statistic as a factor in your selection process.
Wade W. Slome, CFA, CFP®
Plan. Invest. Prosper.
DISCLOSURE: Sidoxia Capital Management nor its client accounts have no direct position in MSFT, SBUX, KO, Facebook, or Twitter shares at the time this article was originally posted. Some Sidoxia Capital Management accounts do have a long position in GOOG shares. No information accessed through the Investing Caffeine (IC) website constitutes investment, financial, legal, tax or other advice nor is to be relied on in making an investment or other decision. Please read disclosure language on IC “Contact” page.
Taking Facebook and Twitter Public

Facebook CEO Mark Zuckerberg
Valuing high growth companies is similar to answering a typical open-ended question posed to me during business school interviews: “Wade, how many ping pong balls can you fit in an empty 747 airplane?” Obviously, the estimation process is not an exact science, but rather an artistic exercise in which various techniques and strategies may be implemented to form a more educated guess. The same estimation principles apply to the tricky challenge of valuing high growth companies like Facebook and Twitter.
Cash is King
Where does one start? Conceptually, one method used to determine a company’s value is by taking the present value of all future cash flows. For growth companies, earnings and cash flows can vary dramatically and small changes in assumptions (i.e., revenue growth rates, profit margins, discount rates, taxes, etc.) can lead to drastically different valuations. As I have mentioned in the past, cash flow analysis is a great way to value companies across a broad array of industries – excluding financial companies (see previous article on cash flow investing).
Mature companies operating in stable industries may be piling up cash because of limited revenue growth opportunities. Such companies may choose to pay out dividends, buyback stock, or possibly make acquisitions of target competitors. However, for hyper-growth companies earlier in their business life-cycles, (e.g., Facebook and Twitter), discretionary cash flow may be directly reinvested back into the company, and/or allocated towards numerous growth projects. If these growth companies are not generating a lot of excess free cash flow (cash flow from operations minus capital expenditures), then how does one value such companies? Typically, under a traditional DCF (discounted cash flow model), modest early year cash flows are forecasted until more substantial cash flows are generated in the future, at which point all cash flows are discounted back to today. This process is philosophically pure, but very imprecise and subject to the manipulation and bias of many inputs.
To combat the multi-year wiggle room of a subjective DCF, I choose to calculate what I call “adjusted free cash flow” (cash flow from operations minus depreciation and amortization). The adjusted free cash flow approach provides a perspective on how much cash a growth company theoretically can generate if it decides to not pursue incremental growth projects in excess of maintenance capital expenditures. In other words, I use depreciation and amortization as a proxy for maintenance CAPEX. I believe cash flow figures are much more reliable in valuing growth companies because such cash-based metrics are less subject to manipulation compared to traditional measures like earnings per share (EPS) and net income from the income statement.
Rationalizing Ratios
Other valuation methods to consider for growth companies*:
- PE Ratio: The price-earnings ratio indicates how expensive a stock is by comparing its share price to the company’s earnings.
- PEG Ratio (PE-to-Growth): This metric compares the PE ratio to the earnings growth rate percentage. As a rule of thumb, PEG ratios less than one are considered attractive to some investors, regardless of the absolute PE level.
- Price-to-Sales: This ratio is less precise in my mind because companies can’t pay investors dividends, buy back stock, or make acquisitions with “sales” – discretionary capital comes from earnings and cash flows.
- Price-to-Book: Compares the market capitalization (price) of the company with the book value (or equity) component on the balance sheet.
- EV/EBITDA: Enterprise value (EV) is the total value of the market capitalization plus the value of the debt, divided by EBITDA (Earnings Before Interest Taxes Depreciation and Amortization). Some investors use EBITDA as an income-based surrogate of cash flow.
- FCF Yield: One of my personal favorites – you can think of this percentage as an inverted PE ratio that substitutes free cash flow for earnings. Rather than a yield on a bond, this ratio effectively provides investors with a discretionary cash yield on a stock.
*All The ratios above should be reviewed both on an absolute basis and relative basis in conjunction with comparable companies in an industry. Faster growing industries, in general, should carry higher ratio metrics.
Taking Facebook and Twitter Public
Before we can even take a stab at some of these growth company valuations, we need to look at the historical financial statements (income statement, balance sheet, and cash flow statement). In the case of Facebook and Twitter, since these companies are private, there are no publically available financial statements to peruse. Private investors are generally left in the dark, limited to public news related to what other early investors have paid for ownership stakes. For example, in July, a Russian internet company paid $100 million for a stake in Facebook, implying a $6.5 billion valuation for the total company. Twitter recently obtained a $100 million investment from T. Rowe Price and Insight Venture Partners thereby valuing the total company at $1 billion.
Valuing growth companies is quite different than assessing traditional value companies. Because of the earnings and cash flow volatility in growth companies, the short-term financial results can be distorted. I choose to find market leading franchises that can sustain above average growth for longer periods of time (i.e., companies with “long runways”). For a minority of companies that can grow earnings and cash flows sustainably at above-average rates, I will take advantage of the perception surrounding current short-term “expensive” metrics, because eventually growth will convert valuation perception to “cheap.” Google Inc. (GOOG) is a perfect example – what many investors thought was ridiculously expensive, at the $85 per share Initial Public Offering (IPO) price, ended up skyrocketing to over $700 per share and continues to trade near a very respectable level of $500 per share.
The IPO market is heating up and A123 Systems Inc (AONE) is a fresh example. Often these companies are volatile growth companies that require a deep dive into the financial statements. There is no silver bullet, so different valuation metrics and techniques need to be reviewed in order to come up with more reasonable valuation estimates. Valuation measuring is no cakewalk, but I’ll take this challenge over estimating the number of ping pong balls I can fit in an airplane, any day. Valuing growth companies just requires an understanding of how the essential earnings and cash flow metrics integrate with the fundamental dynamics surrounding a particular company and industry. Now that you have graduated with a degree in Growth Company Valuation 101, you are ready to open your boutique investment bank and advise Facebook and Twitter on their IPO price (the fees can be lucrative if you are not under TARP regulations).
DISCLOSURE: Sidoxia Capital Management and client accounts do not have direct long positions AONE, however some Sidoxia client accounts do hold GOOG securities at the time this article was published. No information accessed through the Investing Caffeine (IC) website constitutes investment, financial, legal, tax or other advice nor is to be relied on in making an investment or other decision. Please read disclosure language on IC “Contact” page.


