Posts tagged ‘technical analysis’
Technical Analysis – Astrology or Lob Wedge?

Investing comes in many shapes and sizes. And like religion (see Investing Religion article), most investment strategies are built on the essential belief that following certain rules and conventions will eventually lead to profit enlightenment. When it comes to technical analysis (TA), a discipline used with the principal aim of predicting future prices from past patterns, some consider it a necessity for making money in the market. Others, regard the practice of TA as a pseudoscience, much like astrology.
I feel there is a proper place for TA on selective basis, which I will describe later, but for the most part I agree with some of the legendary investors who have chimed in on the subject:
Warren Buffett: “I realized technical analysis didn’t work when I turned the charts upside down and didn’t get a different answer.”
Peter Lynch: “Charts are great for predicting the past.”
Technical Analysis Linguistics
Fundamental analysis, the antithesis of technical analysis, strives to predict future price direction by analyzing facts and data surrounding a company, industry, and/or economy. It too comes with its own syntax and versions, for example: value, growth, top-down, bottom-up, quantitative, etc.
I do not claim to be a TA expert, however in my many years of investing I have come across a smorgasbord of terms and flavors surrounding the discipline. Describing and explaining the density of material surrounding TA would encompass too large of a scope for this article, but here are some prevalent terms one should come to grips with if you want to become a technical analysis guru:
Technical Analysis Approaches
- Elliot Wave
- Relative strength / Momentum (see Momentum Investing article)
- MACD (Moving Average Convergence / Divergence)
- Fibonacci retracement
- Dow Theory
- Stochastics
- Bollinger bands
Price Patterns
- Head and shoulders
- Double bottom
- Cup and handle
- Channels
- Breakouts
- Pivot points
- Candlesticks
- Resistance/Support
- Dead cat bounce (my personal favorite)
Each of these patterns are supposes to provide insight into the future direction of price. At best, I would say the academic research surrounding the subject is “inconclusive,” and at worst I’d say it’s considered a complete “sham.”
The Lob Wedge

As I’ve stated earlier, I fall in the skeptical camp when it comes to TA, since fundamental analysis is the main engine I use for generating and tracking my investment ideas. For illustrative purposes, you may consider fundamental analysis as my group of drivers and irons. I do, however, utilize selective facets of TA much like I use a lob wedge in golf for a limited number of specific situations (e.g., shots over high trees, downhill lies, and fast greens). When it comes to trading, I do believe there is some value in tracking the relationship of extreme trading volume (high or low), especially when it is coupled with extreme price movement (high or low). The economic laws of supply and demand hold true for stock trades just as they do for guns and butter, and sharp moves in these components can provide insights into the psychological mindset of investors with respect to a security (or broader market). Beyond trading volume, there are a few other indicators that I utilize as part of my trading strategies, but these tactics play a relatively minor role, since most of my core positions are held on a multi-year time horizon.
Overall, there is a stream of wasteful noise, volatility, and misinformation that permeates the financial markets on a daily basis. A major problem with technical analysis is the many false triggered signals, which in many cases lead to excessive trading, transaction costs, and ultimately subpar investment returns. Although I remain a skeptic on the subject of technical analysis and I may not read my horoscope today, I will continue to keep a lob wedge in my golf bag with the hopes of finding new, creative ways of using it to my advantage.
Wade W. Slome, CFA, CFP®
Plan. Invest. Prosper.
DISCLOSURE: Sidoxia Capital Management (SCM) and some of its clients own exchange traded funds and various securities, including BRK.B, but at time of publishing had no direct position in BRK.A or any company mentioned in this article. No information accessed through the Investing Caffeine (IC) website constitutes investment, financial, legal, tax or other advice nor is to be relied on in making an investment or other decision. Please read disclosure language on IC “Contact” page.
Day Trading Your House

By several measures, this economic recovery has been the slowest, most-challenging expansion since World War II. Offsetting the painfully slow recovery has been a massive bull market in stocks, now hovering near all-time record highs, after about tripling in value since early 2009. Unfortunately, many investors have missed the boat (see Markets Soar – Investors Snore and Gallup Survey) with stock ownership near a 15-year low.
But it’s not too late for the “sideliners” to get in…is it? (see Get out of Stocks!*). Milfred and Buford are asking themselves that same question (see Investor Wake-Up Call). Milfred and Buford are like many other individuals searching for the American Dream and are looking for ways to pad their retirement nest egg. The seasoned couple has been around the block a few times and are somewhat familiar with one get-rich-quick strategy…day trading stocks. Thankfully, they learned that day trading stocks didn’t work out too well once the technology boom music ended in the late 1990s. Here’s what the SEC has to say about day trading on their government site:
Be prepared to suffer severe financial losses. Day traders typically suffer severe financial losses in their first months of trading, and many never graduate to profit-making status. Given these outcomes, it’s clear: day traders should only risk money they can afford to lose. They should never use money they will need for daily living expenses, retirement, take out a second mortgage, or use their student loan money for day trading.
Milfred & Buford Day Trade House
Milfred: “Now, Buford, I know we lost of our IRA retirement money day trading tech stocks, but if technical analysis works and all the financial news shows and talking babies on TV say it will make us a lot of cabbage, maybe we should try day trading our house?”
Buford: “Now I know why I married you 60 years ago – it’s that brilliant mind of yours that complements that sexy figure!”
Veteran readers of Investing Caffeine know I’ve been a skeptic of technical analysis (see Technical Analysis: Astrology or Lob Wedge), but a successful investor has to be open to new ideas, correct? So, if technical analysis works for stocks, then why not for houses? The recovery in housing prices hasn’t been nearly as robust as we’ve seen in stocks, so perhaps there’s more upside in housing. If I can get free stock charting technicals from my brokerage firm or online, there’s no reason I couldn’t access free charting technicals from Zillow (or Trulia) to make my fortunes. Case in point, I think I see a double-bottom and reverse head-and-shoulders pattern on the home price chart of Kim Kardashian’s house:
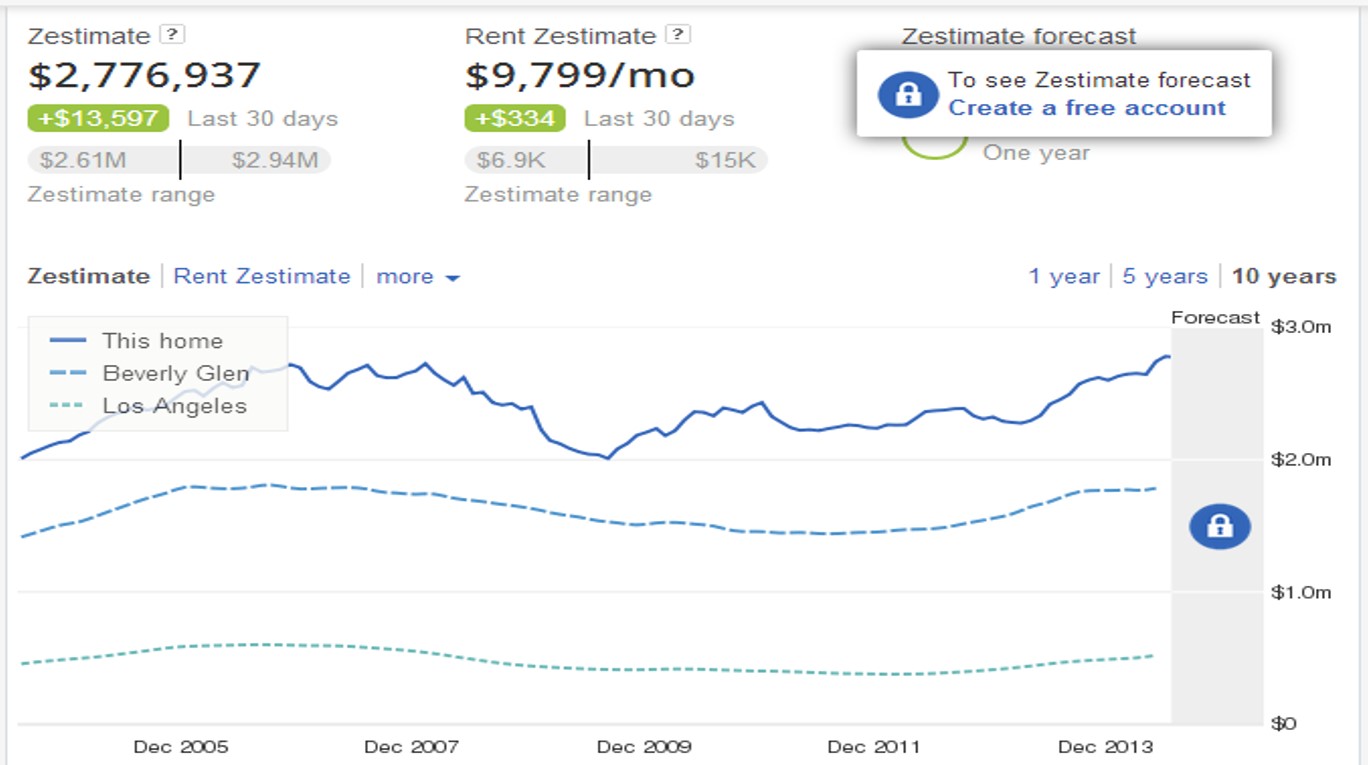
Source: Zillow
Of course, day trading isn’t solely dependent on random chart part patterns. Pundits, bloggers, and brokerage firms would also have you believe instant profits are attainable by trading based on the flow of news headlines. This is how Milfred and Buford would make their millions:
Milfred: “Snookums, it’s time for you to pack up all our stuff.”
Buford: “Huh? What are you talking about honey buns?”
Milfred: “Didn’t you see?! The University of Michigan consumer confidence index fell to a level of 81.3 vs. Wall street estimates of 83.0, bringing this measure to a new 4-month low.”
Buford: “I can’t believe I missed that. Nice catch ‘hun’. I’ll start packing, but where will we stay after we sell the house?”
Milfred: “We can hang out at the Motel 6, but it shouldn’t be long. I’m expecting the Philly Fed Manufacturing index to come in above 23 and I also expect a cease fire in Ukraine and Gaza. We can buy a new house then.”
I obviously frame this example very tongue-in-cheek, but buying and selling a house based on squiggly lines and ever-changing news headlines is as ridiculous as it sounds for trading stocks. The basis for any asset purchase or sale should be primarily based on the cash flow dynamics (e.g., rent, dividends, interest, etc., if there are any) of the asset, coupled with the appreciation/depreciation expectations based on a rigorous long-term analysis.
When Day Trading Works
Obviously there are some differences between real estate and stocks (see Stocks & Real Estate), including the practical utility of real estate and other subjective factors (i.e., proximity to family, schools, restaurants, beach, crime rates, etc.). Real estate is also a relatively illiquid and expensive asset to buy or sell compared to stocks. – However, that dynamic is rapidly changing. Like we witness in stocks, technology and the internet is making real estate cheaper and easier to match buyers and sellers.
Does day trading a stock ever work? Sure, even after excluding the factor of luck, having a fundamental information advantage can lead to immediate profits, but one must be careful how they capture the information. Raj Rajaratnam used this strategy but suffered the consequences of his insider trading conviction. Furthermore, the information advantage game can be expensive, as proven by Steven Cohen’s agreement to pay $1.2 billion to settle criminal charges. While I remain a day trading and technical analysis skeptic, I have noted a few instances when I use it.
Whatever your views are on the topics of day trading and technical analysis, do Milfred and Buford a favor by leading by example…invest for the long-term.
Wade W. Slome, CFA, CFP®
Plan. Invest. Prosper.
DISCLOSURE: Sidoxia Capital Management (SCM) and some of its clients hold long positions in certain exchange traded funds, but at the time of publishing SCM had no direct position in Z, TRLA, or any other security referenced in this article. No information accessed through the Investing Caffeine (IC) website constitutes investment, financial, legal, tax or other advice nor is to be relied on in making an investment or other decision. Please read disclosure language on IC Contact page.
Investing, Housing, and Speculating

We all know there was a lot of speculation going on in the housing market during 2005-2007 as risk-loving adventurists loaded up on NINJA loans (No Income, No Job, and No Assets) and subprime CDS (Credit Default Swap) securities. But there is a different kind of speculation going on now, and it isn’t tied directly to housing. Instead of buying a house with no down payment and a no interest loan, speculators are leaping into other hazardous areas of danger. Like a frog jumping from lily pad to lily pad, speculators are now hopping around onto money-chasing industries, including biotech, social media, Bitcoin, and alternative energy.
As French novelist Jean-Baptise Alphonse Karr noted, “The more things change, the more they stay the same.” Irrespective of the painful consequences of the bubble-bursting aftermaths, human behavior and psychology addictively succumb to the ever-seductive emotion of greed. Over the last 15 years, massive fortunes have been gained and lost while chasing frothy financial dreams in areas like technology, housing, and gold.
Most get-rich-quick dream chasers have no idea of how to invest in or value a stock, but they sure know a good story when they hear one. Chasing top performing stocks is lot like jumping off a bridge – anyone can do it, and it feels exhilarating until you hit the ground. However, there is a better way to create wealth. Despite rampant speculation, most individuals understand the principles behind buying a house, which if applied to stocks, can make you a superior investor, and assist you in avoiding dangerous, speculative investments.
Here are some valuable housing insights to improve your stock buying:
#1.) Price is the Almighty Variable: Successful real estate investors don’t make their fortunes by chasing properties that double or triple in value. Buying a rusty tool shed for $1 million makes about as much sense as Facebook paying $19 billion (1,000 x’s the estimated 2013 annual revenues) for a money-losing company, WhatsApp. Better to buy real estate when there is blood in the street. Like the stock market, housing is cyclical. Many traders believe that price patterns are more important than the actual price. If squiggly, technical price moving averages (see Technical Analysis article) make so much money for stock-renting speculators, then how come day traders haven’t used their same crossing-lines and Point & Figure software in the housing market? Yes, it’s true that the real estate transactions costs and illiquidity can be costly for real estate buyers, but 6% load fees, lockup periods, 20% hedge fund fees, and 9% margin rates haven’t stopped stock speculators either.
#2). Cash is King: It doesn’t take a genius to purchase a rental property – I know because practically half the people I know in Southern California own rental properties. For example, if I buy a rental property for $1 million cash, is it a good purchase? Well, it depends on how much after-tax cash I can collect by renting it out? If I can only net $3,000 per month (3.6% annualized return), and be responsible for replacing roofs, fixing toilets, and evicting tenants, then perhaps I would be better off by collecting 6.5% from a low-cost, tax-efficient exchange traded real estate fund, without having to suffer from all the headaches that physical real estate investing brings. Forecasting future asset price appreciation is tougher, but the point is, understanding the underlying cash flow dynamics of a company is just as important as it is for housing purchases.
#3). Debt/Leverage Cuts in Both Directions: Adding debt (or leverage) to a housing or stock investment can be fantastic if prices go up, and disastrous if prices go down. Putting a 20% down payment on a $1 million house works out wonderfully, if the price of the house increases to $1.2 million. My $200,000 down payment is now worth $400,000, or up +100%. The same math works in reverse. If the price of the home drops to $800,000, then my $200,000 down payment is now worth $0, or down -100% (ouch). Margin debt on an equity brokerage account works in a similar fashion, but usually a 50% down payment is needed (less risky than real estate). That’s why I always chuckle when many real estate investors tell me they steer clear of stocks because they are “too risky”.
#4). Growth Matters: If you buy a home for $1 million, is it likely to be worth more if you add a kitchen, tennis court, swimming pull, third floor, and putting green? In short, the answer is yes. The same principle applies to stocks. All else equal, if a company based in Los Angeles, establishes new offices in New York, London, Beijing, and Rio de Janeiro, and then acquires a profitable competitor at a discounted price, chances are the company will be much more valuable after the additions. The key concept here is that asset values are not static. Asset valuations are impacted in both directions, whether we are talking about positive growth opportunities or negative disruptions.
Overall, speculatively chasing performance is tempting, but if you don’t want your financial foundation to crumble, then build your successful investment future by sticking to the fundamentals and financial basics.
Wade W. Slome, CFA, CFP®
Plan. Invest. Prosper.
DISCLOSURE: Sidoxia Capital Management (SCM) and some of its clients hold long positions in certain exchange traded funds (ETFs), but at the time of publishing SCM had no direct discretionary position in FB, Bitcoin, or any other security referenced in this article. No information accessed through the Investing Caffeine (IC) website constitutes investment, financial, legal, tax or other advice nor is to be relied on in making an investment or other decision. Please read disclosure language on IC Contact page.
Winning the Stock Rock Turning Game

There are a few similarities between dieting and investing. There are no shortcuts or panaceas to achieving success in either endeavor – they both require plain old hard work. Any winning investment process will have some sort of mechanism(s) to generate new stock ideas, whether done quantitatively through a screening process or more subjectively through other avenues (e.g., conferences, journals, investor contacts, field research, or Investing Caffeine – ha). As many investors would agree, discovering remarkable stock picks is no effortless undertaking. A lot of meaningless rocks need to be turned before a gem can be found, especially in an age of information overload. I believe investing guru Peter Lynch said it best:
“I always thought if you looked at ten companies, you’d find one that’s interesting, if you’d look at 20, you’d find two, or if you look at hundred you’ll find ten. The person that turns over the most rocks wins the game.”
Depending on the duration of your investment time horizon, stock gems can be more abundant in certain time periods relative to others. The shorter the timeframe, the more important timing becomes. Looking at a few major turning points illustrates my point. Although hindsight is 20/20, it is clear now (and for a minority of investors 11 years ago) that the pickings were slim in March 2000 and virtually endless in March 2009 –practically anything purchased then went up in price.
Investing is not a game of certainty, because if it was certain, everyone would be sipping umbrella drinks on their personal islands. Since investing involves a great deal of uncertainty, the name of the game is stacking probabilities in your favor. If you have a repeatable process, you should be able to outperform the markets in the long-run. In the short-run, a good process can have a bad outcome, and a bad process can have a good outcome.
Macro vs. Bottom-Up
Gaining a rough sense of the macro picture can increase the probabilities of success, but more importantly I believe a bottom-up approach (i.e., flipping over lots of stock rocks) is a better approach to raising odds in your favor. The recent volatility and pullback in the market has left a sour taste in investors’ mouths, but great opportunities still abound. That’s the thing about great stocks, they never disappear in bear markets and they eventually flourish – more often when a bull market returns.
Characterizing the macro game as difficult is stating the obvious. Although there are only about two recessions every decade, if you watch CNBC or read the paper, there are probably about 20 or 30 recessions predicted every 10 years. Very few, if any, can profitably time the scarce number of actual recessions, but many lose tons of money from the dozens of false alarms. You’re much better off by following Lynch’s credo: “Assume the market is going nowhere and invest accordingly.”
Land Mine or Gold Mine?
Not everyone believes in the painstaking process of fundamental analysis, but I in fact come from the COFC (Church of Fundamental Research), which firmly believes fundamental research is absolutely necessary in determining whether an investment is a land mine or a gold mine. Others believe that a quantitative black box (see Butter in Bangladesh), or technical analysis (see Astrology or Lob Wedge) can do the trick as a substitute. These strategies may be easier to implement, but as well-known money manager Bill Miller indicated, “This is not a business where ignorance is an asset; the more you work at it, the better you ought to be, other things equal.”
By doing your investment homework on companies, not only will you gain better knowledge of your investment, but you will better understanding of the company. Regardless of your process, I’m convinced any worthwhile strategy requires conviction. If you have loose roots of interest in a stock, the wind will blow you all over the place, and ultimately rip the roots of your flimsy thesis out of the foundation. I contend that most lazy and simplistic processes, such as buying off tips, chasing winners, or letting computers buy stocks might create short-term profits, but these methods do not engender conviction and will eventually lead speculators to the poor house. If simple short-cuts worked so well, I think the secret would have gotten out to the masses by now. Rather than trading off of tips or questionable technical indicators, Peter Lynch advises investors to do their homework and “buy what you know.”
There is no single way of making money in the stock market, but I’m convinced any worthwhile process incorporates a process of pulling weeds and watering new flowers. But to generate a continuous flow of new stock idea gems, which are necessary to win in the investment game, you will need to turn over a lot of stock rocks.
Wade W. Slome, CFA, CFP®
Plan. Invest. Prosper.
DISCLOSURE: Performance data from Morningstar.com. Sidoxia Capital Management (SCM) and some of its clients own certain exchange traded funds, but at the time of publishing SCM had no direct position in any security referenced in this article. No information accessed through the Investing Caffeine (IC) website constitutes investment, financial, legal, tax or other advice nor is to be relied on in making an investment or other decision. Please read disclosure language on IC “Contact” page.
Sentiment Indicators: Reading the Tea Leaves

Market commentators and TV pundits are constantly debating whether the market is overbought or oversold. Quantitative measures, often based on valuation measures, are used to support either case. But the debate doesn’t stop there. As a backup, reading the emotional tea leaves of investor attitudes is relied upon as a fortune telling stock market ritual (see alsoTechnical Analysis article). Generally these tools are used on a contrarian basis when deciding about purchase or sale timing. The train of thought follows excessive optimism is tied to being fully invested, therefore the belief is only one future direction left…down. The thought process is also believed to work in reverse.
Actions Louder Than Words
When it comes to investing, I believe actions speak louder than words. For example, words answered in a subjective survey mean much less to me in gauging optimism or pessimism than what investors are really doing with their cool, hard cash. Asset flow data indicates where money is in fact going. Currently the vast majority of money is going into bonds, meaning the public hates stocks. That’s fine, because without pessimism, there would be fewer opportunities.
Most sentiment indicators are an unscientific cobbling of mood surveys designed to check the pulse of investors. How is the data used? As mentioned above, the sentiment indicators are commonly used as a contrarian tool…meaning: sell the market when the mood is hot and buy the market when it is cold.
Here are some of the more popular sentiment indicators:
1) Sentiment Surveys (AAII/NAAIM/Advisors): Each measures different bullish/bearish opinions regarding the stock market.
2) CBOE Volatility Index (VIX): The “fear gauge” developed using implied option volatility (read also VIX article).
3) Breadth Indicators (including Advanced-Decline and High-Low Ratios): Measures the number of up stocks vs. down stocks. Used as measurement device to identify extreme points in a market cycle.
4) NYSE Bullish Percentage: Calculates the percentage of bullish stock price patterns and used as a contrarian indicator.
5) NYSE 50-Day and 200-Day Moving Average: Another technical price indicator that is used to determine overbought and oversold price conditions.
6) Put/Call Ratio: The number of puts purchased relative to calls is used by some to measure the relative optimism/pessimism of investors.
7) Volume Spikes: Optimistic or pessimistic traders will transact more shares, therefore sentiment can be gauged by tracking volume metrics versus historical averages.
Sentiment Shortcomings
From a ten thousand foot level, the contrarian premise of sentiment indicators makes sense, if you believe as Warren Buffett does that it is beneficial to buy fear and sell greed. However, many of these indicators are more akin to reading tea leaves, than utilizing a scientific tool. Investors enjoy black and white simplicity, but regrettably the world and the stock market come in many shades of gray. Even if you believe mood can be accurately measured, that doesn’t account for the ever-changing state of human temperament. For instance, in a restaurant setting, my wife will change her menu choice four times before the waiter/waitress takes her order. Investor sentiment can be just as fickle depending on the Dubai, Greece, Swine Flu, or foreclosure headline du jour.
Other major problems with these indicators are time horizon and degree of imbalance. Yeah, an index or stock may be oversold, but by how much and over what timeframe? Perhaps a security is oversold on an intraday chart, but dramatically overbought on a monthly basis? Then what?
The sentiment indicators can also become distorted by a changing survey population. Average investors have fled the equity markets and have followed the pied piper Bill Gross to fixed income nirvana. What we have left are a lot of unstable high frequency traders who often change opinions in a matter of seconds. These loose hands are likely to warp the sentiment indicator results.
Strange Breed
Investors are strange and unique animals that continually react to economic noise and emotional headlines in the financial markets. Despite the infinitely complex world we live in, people and investors use everything available at their disposal in an attempt to make sense of our endlessly random financial markets. One day interest rate declines are said to be the cause of market declines because of interest rate concerns. The next day, interest rate declines due to “quantitative easing” comments by Federal Reserve Chairman Ben Bernanke are attributed to the rise in stock prices. So, which one is it? Are rate declines positive or negative for the market?
On a daily basis, the media outlets are arrogant enough to act like they have all the answers to any price movement, rather than chalking up the true reason to random market volatility, sensationalistic noise, or simply more sellers than buyers. Virtually any news event will be handicapped for its market impact. If Ben Bernanke farts, people want to know what he ate and what impact it will have on Fed policy.
Sentiment indicators are some of the many tools used by professionals and non-professionals alike. While these indicators pose some usefulness, overreliance on reading these sentiment tea leaves could prove hazardous to your fortune telling future.
Wade W. Slome, CFA, CFP®
Plan. Invest. Prosper.
DISCLOSURE: Sidoxia Capital Management (SCM) and some of its clients own certain exchange traded funds, but at the time of publishing SCM had no direct position in any other security referenced in this article. No information accessed through the Investing Caffeine (IC) website constitutes investment, financial, legal, tax or other advice nor is to be relied on in making an investment or other decision. Please read disclosure language on IC “Contact” page.
Technical Analysis – Astrology or Lob Wedge?
Investing comes in many shapes and sizes. And like religion (see Investing Religion article), most investment strategies are built on the essential belief that following certain rules and conventions will eventually lead to profit enlightenment. When it comes to technical analysis (TA), a discipline used with the principal aim of predicting future prices from past patterns, some consider it a necessity for making money in the market. Others, regard the practice of TA as a pseudoscience, much like astrology.
I feel there is a proper place for TA on selective basis, which I will describe later, but for the most part I agree with some of the legendary investors who have chimed in on the subject:
Warren Buffett: “I realized technical analysis didn’t work when I turned the charts upside down and didn’t get a different answer.”
Peter Lynch: “Charts are great for predicting the past.”
Technical Analysis Linguistics
Fundamental analysis, the antithesis of technical analysis, strives to predict future price direction by analyzing facts and data surrounding a company, industry, and/or economy. It too comes with its own syntax and versions, for example: value, growth, top-down, bottom-up, quantitative, etc.
I do not claim to be a TA expert, however in my many years of investing I have come across a smorgasbord of terms and flavors surrounding the discipline. Describing and explaining the density of material surrounding TA would encompass too large of a scope for this article, but here are some prevalent terms one should come to grips with if you want to become a technical analysis guru:
Technical analysis Approaches
- Elliot Wave
- Relative strength / Momentum (see Momentum Investing article)
- MACD (Moving Average Convergence / Divergence)
- Fibonacci retracement
- Dow Theory
- Stochastics
- Bollinger bands
Price Patterns
- Head and shoulders
- Double bottom
- Cup and handle
- Channels
- Breakouts
- Pivot points
- Candlesticks
- Resistance/Support
- Dead cat bounce (my personal favorite)
Each of these patterns are supposes to provide insight into the future direction of price. At best, I would say the academic research surrounding the subject is “inconclusive,” and at worst I’d say it’s considered a complete “sham.”
The Lob Wedge
As I’ve stated earlier, I fall in the skeptical camp when it comes to TA, since fundamental analysis is the main engine I use for generating and tracking my investment ideas. For illustrative purposes, you may consider fundamental analysis as my group of drivers and irons. I do, however, utilize selective facets of TA much like I use a lob wedge in golf for a limited number of specific situations (e.g., shots over high trees, downhill lies, and fast greens). When it comes to trading, I do believe there is some value in tracking the relationship of extreme trading volume (high or low), especially when it is coupled with extreme price movement (high or low). The economic laws of supply and demand hold true for stock trades just as they do for guns and butter, and sharp moves in these components can provide insights into the psychological mindset of investors with respect to a security (or broader market). Beyond trading volume, there are a few other indicators that I utilize as part of my trading strategies, but these tactics play a relatively minor role, since most of my core positions are held on a multi-year time horizon.
Overall, there is a stream of wasteful noise, volatility, and misinformation that permeates the financial markets on a daily basis. A major problem with technical analysis is the many false triggered signals, which in many cases lead to excessive trading, transaction costs, and ultimately subpar investment returns. Although I remain a skeptic on the subject of technical analysis and I may not read my horoscope today, I will continue to keep a lob wedge in my golf bag with the hopes of finding new, creative ways of using it to my advantage.
Wade W. Slome, CFA, CFP®
Plan. Invest. Prosper.
DISCLOSURE: Sidoxia Capital Management (SCM) and some of its clients own exchange traded funds and various securities, but at time of publishing had no direct position in BRKA/B or any company mentioned in this article. No information accessed through the Investing Caffeine (IC) website constitutes investment, financial, legal, tax or other advice nor is to be relied on in making an investment or other decision. Please read disclosure language on IC “Contact” page.


