Posts tagged ‘tablets’
NASDAQ 5,000…Irrational Exuberance Déjà Vu?

Investors love round numbers and with the Dow Jones Industrial index recently piercing 17,000 and the S&P 500 index having broken 2,000 , even novice investors have something to talk about around the office water cooler. While new all-time records are being set for the major indices during September, the unsung, tech-laden NASDAQ index has yet to surpass its all-time high of 5,132 achieved 14 and ½ years ago during March of 2000.
A lot has changed since then. Leading up to the pricking of the technology bubble, talks of an overhyped market started as early as December 5, 1996, when then Federal Reserve Chairman Alan Greenspan made his infamous “irrational exuberance” speech.
“But how do we know when irrational exuberance has unduly escalated asset values, which then become subject to unexpected and prolonged contractions as they have in Japan over the past decade?”-Alan Greenspan (Federal Reserve Chairman 1987 – 2006)
On that date, the NASDAQ closed at 1,300. A little over three years later, before values cratered by -78%, the index almost quadrupled higher to 5,132. Looked at from a slightly different lens, here is how the major indexes have fared since Greenspan’s widely referenced speech almost 18 years ago:

Despite the world’s most powerful banker calling stock prices irrational, the Dow & S&P have almost tripled in value (+164% & +167%, respectively) and the NASDAQ has almost quadrupled (+251%). The 80%+ outperformance (excluding dividends) is impressive, but reasonable if you consider this increase amounts to about a +7.2% compounded annual appreciation value. Investors have experienced a lot of heartburn over that long timeframe, but for any buy-and-holders, these returns would have trounced returns realized in alternative safe haven vehicles like CDs, savings accounts, or bonds.
Price: The Almighty Metric
There are many valuation metrics to evaluate but the most universal one is the Price/Earnings ratio (P/E). Just as in the process of assessing the value of a car, house, or stock, the price you pay is usually the most important factor of the purchase. The same principle applies to stock indexes. The cheaper the price paid, the greater probability of earning superior returns in the future. Unfortunately for investors in technology stocks, there was not much value in the NASDAQ index during late-1999, early-2000. Historical P/E data for the NASDAQ index is tough to come by, but some estimates pegged the index value at 200x’s its earnings at the peak of the 2000 technology mania. In other words, for every $1 in profit the average NASDAQ company earned, investors were willing to pay $200…yikes.
Today, the NASDAQ 100 index (the largest 100 non-financial companies in the NASDAQ index), which can serve as a proxy for the overll NASDAQ index, carries a reasonable P/E ratio of approximately 20x on a forward basis (24x on a trailing basis) – about 90% lower than the peak extremes of the NASDAQ index in the year 2000.
Although NASDAQ valuations are much lower today than during the bursting 2000 tech bubble, P/E ratios for the NASDAQ 100 still remain about +20% higher than the S&P 500, which begs the question, “Is the premium multiple deserved?”
As I wrote about in the NASDAQ Tech Revolution, you get what you pay for. If you pay a peanut multiple, many times you get a monkey stock. In the technology world, there is often acute obsolescence risk (remember Blackberry – BBRY?) that can lead to massive losses, but there also exists a winner-takes-all dynamic. Just think of the dominance of Google (GOOG/L) in search advertising, Microsoft (MSFT) in the PC, or Amazon (AMZN) in e-commerce. It’s a tricky game, but following the direction of cash, investments, and product innovation are key in my mind if you plan on finding the long-term winners. For example, the average revenue growth for the top 10 companies in the NASDAQ 100 averaged more than +100% annually from the end of 1999 to the end of 2013. Identifying the “Old Tech Guard” winners is not overly challenging, but discovering the “New Tech Guard” is a much more demanding proposition.
In the winner-takes-all hunt, one need not go any further than looking at the massive role technology plays in our daily lives. Twenty years ago, cell phones, GPS, DVRs (Digital Video Recorders), e-Readers, tablets, electric cars, iPods/MP3s, WiFi mobility, on-demand digital media, video-conferencing, and cloud storage either did not exist or were nowhere near mainstream. Many of these technologies manifest themselves into a whole host of different applications that we cannot live without. One can compile a list of these life-critical applications by thumbing through your smartphone or PC bookmarks. The list is ever-expanding, but companies like Twitter (TWTR), Facebook (FB), Amazon (AMZN), Uber, Netflix (NFLX), Priceline (PCLN), Yelp, Zillow (Z), and a bevy of other “New Tech Guard” companies have built multi-billion franchises that have become irreplaceable applications in our day-to-day lives.
Underlying all the arbitrary index value milestones (e.g., Dow 17,000 and S&P 2,000) since the 1990s has a persistent and unstoppable proliferation of technology adoption across virtually every aspect of our lives. NASDAQ 5,000 may not be here quite yet, but getting there over the next year or two may not be much of a stretch. Speculative tendencies could get us there sooner, and macro/geopolitical concerns could push the milestone out, but when we do get there the feeling of NASDAQ 5,000 déjà vu will have a much stronger foundation than the fleeting euphoric emotions felt when investors tackled the same level in year 2000.

Wade W. Slome, CFA, CFP®
Plan. Invest. Prosper.
DISCLOSURE: Sidoxia Capital Management (SCM) and some of its clients own AAPL, GOOG/L, AMZN, NFLX bonds (short the equity), FB (non-discretionary), MSFT (non-discretionary), PCLN (non-discretionary) and a range of positions in certain exchange traded fund positions, but at the time of publishing SCM had no direct position in TWTR, Uber, YELP, Z, or any other security referenced in this article. No information accessed through the Investing Caffeine (IC) website constitutes investment, financial, legal, tax or other advice nor is to be relied on in making an investment or other decision. Please read disclosure language on IC Contact page.
Gobbling Up the All-You-Can-Eat Data Buffet

Gorging oneself at an all-you-can eat buffet has its advantages, but managing the associated extra pounds and bloatedness carries its own challenges. In a similar fashion, businesses and consumers are devouring data at an exponential rate, while simultaneously attempting to slice, dice, manage, and store all of this information. Data is quickly becoming as cheap as oxygen, and there are virtually no limitations on the amount consumed.
With the help of my handy smart phone, tablet, and digital camera, I can almost store and watch every moment of my life, very much like the movie The Truman Show. Social media and cloud services, coupled with inexpensive storage, have only made it simpler to digitally archive my life. Pretty soon, with the click of a mouse (or tap of the tablet) everyone will be able to instantaneously access every important moment of their life from cradle to grave.
Consuming Data Bytes at a Time
If you are in the mood for consuming free data, there are plenty of free multi-gigabyte services to choose from, including Dropbox, Mozy, and SkyDrive among other. For those chomping on more than 25 gigabytes of data, paid services like Amazon.com’s (AMZN) Simple Storage Service (a.k.a, “S3”) allow users to store a terabyte of data for about $0.01 – $0.05 per month. However, if renting storage is not your gig (no pun intended), you can own your personal storage device for next to nothing. In fact, you can buy a 1 terabyte (equal to 1,000 gigabytes) external hard drive today for less than $70. If that’s too rich for your blood, then just wait 12 months or so and pay $50 bucks. To put a terabyte in context, this amount of storage can hold approximately 625,000 high quality photos or 412 DVD quality movies, according to a Financial Times article talking about “big data.”
A terabyte may sound like a lot, but if we’re going to be honest, this amount of storage is Tiddly Winks. Once we start talking about petabytes (1,000 terabytes), exabytes (1,000,000 terabytes), and zettabytes (1 billion terabytes), things begin to get a little more interesting (see chart below). If you consider that 2012 global data center traffic estimates amount to 2.6 zettabytes (or 2.6 billion terabytes), it doesn’t take long to appreciate the enormity of the data management challenge facing billions of people.
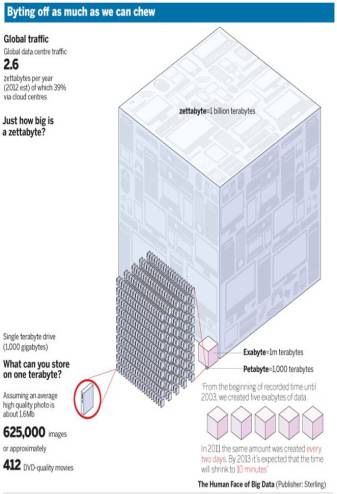
Source: The Financial Times
The Financial Times also points out the following:
“From the beginning of recorded time until 2003, we created five exabytes of data. In 2011 the same amount was created every two days. By 2013 it’s expected that the time will shrink to 10 minutes.”
Digital World Driving Data Appetite
What’s driving the global gusher of data growth? There’s not just one answer, but one can start understanding the scope of the issue after contemplating the trillions of annual text messages; 1 billion Facebook (FB) users; 800 million monthly YouTube visitors watching 4 billion hours of videos; six billion cell phones worldwide; and a global 122 million tablet market (IDC).
I certainly wasn’t the first person to discover this megatrend, but I am not hesitating to invest both my client’s money and my money into benefiting from this massive growth trend. Businesses are prospering from the data tidal wave too, as evidenced in part by Oracle Corp’s (ORCL) stellar quarterly earnings results reported just a few days ago. The mass migration of services to the “cloud” (software delivered over the internet) combined with the need to manage and store exploding industry data, resulted in Oracle reporting growth of +18% in its profitable Software License Sales and Cloud Subscriptions segment. With results like these, no wonder Oracle’s founder and CEO Larry Ellison owns a 141-mile square island, a multi-hundred million yacht, and is worth $41 billion according to Forbes (#3 on the Forbes 400 list).
Whether you realize it or not, we are all consuming heaps of all-you-can eat data at the digital buffet. Rather than rolling over into a data consumption coma, you will be much better off figuring out how to profit from the exploding data trends.
See also: The Age of Information Overload
Wade W. Slome, CFA, CFP®
Plan. Invest. Prosper.
DISCLOSURE: Sidoxia Capital Management (SCM) and some of its clients hold positions in certain exchange traded funds (ETFs), GOOG, and AMZN, but at the time of publishing SCM had no direct positions in FB, ORCL, or any other security referenced in this article. No information accessed through the Investing Caffeine (IC) website constitutes investment, financial, legal, tax or other advice nor is to be relied on in making an investment or other decision. Please read disclosure language on IC Contact page.
Chewing on Some Apple Pie

Apple pie is an unrivaled American dessert that optimally mixes the elements of dough, sugar, cinnamon, and apples. With Thanksgiving just around the corner, I can already taste that Costco (COST) apple pie that is about to snap my belt buckle open as I proceed to eat pie for breakfast, lunch, and dinner. A different dessert of the stock variety, Apple Inc. (AAPL), recently received a sour reception after reporting its 3rd quarter financial results.
Despite reporting +27% year-over-year revenue growth and +23% earnings growth, investors have continued to spew the stock out as the share price has fallen from $700 per share down to $600 per share in about a month. With all this indigestion, is now the time to reach for the Tums or should we serve ourselves up another helping of some tasty Apple pie? Not everybody loves this particular fruity dessert, so let’s cut into the Apple pie stock and see if there is any dough to be made here.
Point #1 (Cash Giant): Apple Inc. is a profit machine with a fortress balance sheet. More specifically, Apple has around $121 billion dollars in cash in its checking account and generated over $42 billion in free cash flow in fiscal 2012. And by free cash flow, I mean the excess cash Apple gets to stuff in its pockets after ALL expenses have been paid AND after spending more than $8 billion in capital expenditures (including spending for their new 2.8 million sq. foot spaceship campus expected to open in 2015 and house 13,000 employees).
Point #2: (Brand): A brand has value that will not show up on a balance sheet, and according to Forbes, Apple’s brand is rated #1 on a global basis, outstripping iconic brands like IBM, McDonald’s (MCD) and Microsoft (MSFT). BrandZ, a division of advertising giant WPP, values Apple’s 2012 brand value at approximately $183 billion.
Point #3 (Product Pipeline): Apple is no one-trick pony. Apple’s iPhone sales account for about half of the company’s sales, but a whole new slate of products positions them well for the critical calendar fourth quarter period. Apple’s iPhone 5, iPad 3 (aka, “New iPad”), and iPad Mini should translate into robust holiday sales for Apple. What’s more, a +39% increase in Apple’s fiscal 2012 R&D (research and development) should mean a continued healthy pipeline of new products, including the ever-rumored new integrated version of Apple TV that could be coming in 2013.
Point #4 (Mobile & Tablets): Apple is at the center of the mobile revolution. There are approximately 5 billion cell phones globally, and about 2 billion new phones are sold each year. Of that 2 billion, Apple sold a paltry 125 million units (tongue firmly in cheek) with the market growing faster in Apple iPhone’s key smart phone market. As the approximately 500 million smart phone market grows to about 5 billion units over the next decade, Apple is uniquely positioned to capitalize on this trend. Beyond cell phones, the table market is bursting as traditional personal computer growth declines. Although Apple has made computers for 36 years, the company impressively generated +40% more revenue from fiscal 2012 iPad tablet sales, relative to Apple desktop and laptop sales.
Point #5 (Valuation): With all these positives, what type of premium would you pay for Apple’s stock? Does a +100% premium sound reasonable? OK, maybe a tad high, so how about a +50% premium? Alright, alright, I know you want a good bargain, so surely a +20% premium is warranted? Well in fact, if you account for Apple’s $121 billion cash hoard, Apple’s stock is currently trading at about a -22% DISCOUNT to the average S&P 500 stock on a P/E basis (Price-Earnings). You heard that correctly, a significant discount. If Apple is trading at a P/E discount, surely mature staple stocks like Procter & Gamble (PG) and Colgate Palmolive (CL), which both reported negative Q3 revenue declines coupled with meager bottom-line growth of 5%, deserve even steeper discounts…right? WRONG. These stocks trade at a 70-80% PREMIUM to Apple and a 35-40% PREMIUM to the overall market. Toilet paper and toothpaste I guess are a lot more popular than consumer electronics these days. Clear as mud to me.
Risks: I understand that Apple is not a risk-free Treasury security. Research in Motion’s (RIMM) rapid collapse over the last two years serves as a fresh reminder that in technology land, competition and obsolescence risks play a much larger role compared to other industries. Apple must still deliver on its product visions, and as the king of the hill Apple will have a big bulls-eye on its back from both competitors and regulators. Hence, we will continue to read overblown headlines about map application glitches and photographic purple haze.
In the end, a significant amount of pessimism is already built into Apple’s stock price (yes, I did say “pessimism” – even with the stock’s share price up +49% this year). If Apple can uphold the quality of its products and maintain modest growth, then I’m confident shareholders will happily eat another slice of Apple pie.
Wade W. Slome, CFA, CFP®
Plan. Invest. Prosper.
DISCLOSURE: Sidoxia Capital Management (SCM) and some of its clients hold positions in certain exchange traded funds (ETFs) and AAPL, but at the time of publishing SCM had no direct positions in COST, IBM, MCD, CL, PG, MSFT, WPP, RIMM, or any other security referenced in this article. No information accessed through the Investing Caffeine (IC) website constitutes investment, financial, legal, tax or other advice nor is to be relied on in making an investment or other decision. Please read disclosure language on IC Contact page.


