Posts tagged ‘stock market’
Invest with a Telescope…Not a Microscope

It was another bloody week in the stock market (S&P 500 index dropped -3.1%), and any half-glass full data was interpreted as half-empty. The week was epitomized by a Citigroup report entitled “World Economy Trapped in a Death Spiral.” A sluggish monthly jobs report on Friday, which registered a less than anticipated addition of 151,000 jobs, painted a weakening employment picture. Professional social media site LinkedIn Corp. (LNKD) added fuel to the fire with a soft profit forecast, which resulted in the stock getting almost chopped in half (-44%)…in a single day (ouch).
It’s funny how quickly the headlines can change – just one week ago, the Dow Jones Industrial index catapulted higher by almost +400 points in a single day and we were reading about soaring stocks.
Coherently digesting the avalanche of diverging and schizophrenic headlines is like attempting to analyze a windstorm through a microscope. A microscope is perfect for looking at a single static item up close, but a telescope is much better suited for analyzing a broader set of data. With a telescope, you are better equipped to look farther out on the horizon, to anticipate what trends are coming next. The same principle applies to investing. Short-term traders and speculators are great at using a short-term microscope to evaluate one shiny, attention-grabbing sample every day. The investment conclusion, however, changes the following day, when a different attention-grabbing headline is analyzed to a different conclusion. As Mark Twain noted, “If you don’t read the newspaper, you are uninformed. If you do read the newspaper, you are misinformed.”
Short-termism is an insidious disease that will slowly erode short-run performance and if not controlled will destroy long-run results as well. This is not a heretic concept. Some very successful investors have preached this idea in many ways. Here are a few of them:
‘‘We will continue to ignore political and economic forecasts which are an expensive distraction for many investors and businessmen.” –Warren Buffett (Annual Newsletter 1994)
‘‘If you spend more than 14 minutes a year worrying about the market, you’ve wasted 12 minutes’’ –Peter Lynch
“Excessive short-termism results in permanent destruction of wealth, or at least permanent transfer of wealth” -Jack Gray Grantham
On the flip side, those resilient investors who have succeeded through investment cycles understand the importance of taking a long-term view.
“Whatever method you use to pick stocks or stock mutual funds, your ultimate success or failure will depend on your ability to ignore the worries of the world long enough to allow your investments to succeed.” –Peter Lynch
“The farther you can lengthen your time horizon in the investment process, the better off you will be.” – David Nelson (Legg Mason)
“Long term owners are more relaxed, more informed, more patient, less emotional.” –John Templeton
“If you are really a long-term investor, you will view a bear market as an opportunity to make money.” –John Templeton
“Long term is not a popular time-horizon for today’s hedge fund short-term mentality. Every wiggle is interpreted as a new secular trend.” –Don Hays
“In the long run, one of the greatest risk to your net worth is not owning stocks. Bonds do not grow. They can only return their face value at maturity…Inflation is a silent, insidious tax that erodes your net worth…Fortunately, there is an easy way to keep pace with and even beat inflation, and this is stocks.” – John Spears
“In the short-term, the stock market is a voting machine; in the long-term a weighing machine.” -Benjamin Graham
There has been a lot of pain experienced so far in 2016, and there may be more to come. However, trying to time the market and call a bottom is a fruitless effort. Great companies and investments do not disappear in a bear market. At times like these, it is important to stick to a systematic, disciplined approach that integrates valuation and risk controls based on where we are in an economic cycle. Despite all the recent volatility, as I’ve repeated many times, the key factors driving the direction of the stock market are the following: 1) Corporate profits; 2) Interest rates; 3) Valuations; and 4) Sentiment (see also Don’t Be a Fool, Follow the Stool). Doom and gloom “Death Spiral” headlines may currently rule the day, but the four key stock-driving factors on balance remain skewed towards the positive…if you have the ability to put away your microscope and take out your telescope.

Wade W. Slome, CFA, CFP®
Plan. Invest. Prosper.
DISCLOSURE: Sidoxia Capital Management (SCM) and some of its clients hold positions in certain exchange traded funds (ETFs), but at the time of publishing had no direct position in LNKD or any other security referenced in this article. No information accessed through the Investing Caffeine (IC) website constitutes investment, financial, legal, tax or other advice nor is to be relied on in making an investment or other decision. Please read disclosure language on IC Contact page.
Financial Markets Recharge with a Nap…Zzzzzz

This article is an excerpt from a previously released Sidoxia Capital Management complimentary newsletter (January 4, 2016). Subscribe on the right side of the page for the complete text.
Did you enjoy your New Year’s festivities? If you were like me and ate excessively and drank too much egg nog, you may have decided along the line to take a nap. It’s not a bad idea to recharge those batteries before implementing those New Year’s resolutions and jumping on the treadmill. That’s exactly what happened in the financial markets this year. After six consecutive years of positive returns in the Dow Jones Industrial Average (2009 – 2014), stock markets took a snooze in 2015, as measured by the S&P 500 and Dow, which were each down -0.7% and -2.2%, respectively. And bonds didn’t fare any better, evidenced by the -1.9% decline in the Aggregate Bond ETF (AGG), over the same time period. Given the deep-seated fears about the Federal Reserve potentially catapulting interest rates higher in 2015, investors effectively took a big yawn by barely nudging the 10-year Treasury Note yield higher by +0.1% from 2.2% to 2.3%.
Even though 2015 ended up being a quiet year overall, there were plenty of sweet dreams mixed in with scary nightmares during the year-long nap:
INVESTMENT SWEET DREAMS
Diamonds in the Rough: While 2015 stock prices were generally flat to down around the globe (Vanguard Total Word -4.2%), there was some sunshine and rainbows gleaming for a number of segments in the market. For example, handsome gains were achieved in the NASDAQ index (+5.7%); Biotech Index – BTK (+10.9%); Consumer Discretionary ETF – XLY (+8.3%); Health Care ETF – VHT (+5.8%); Information Technology ETF – VGT (+4.6%); along with numerous other investment areas.
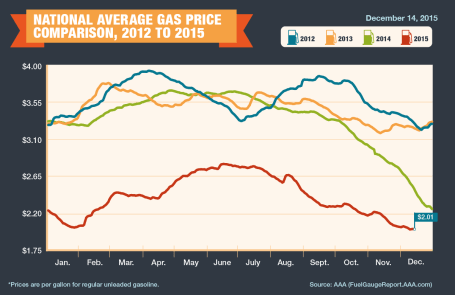
Fuel Fantasy Driven by Low Gas Prices: Gas prices averaged $2.01 per gallon nationally in December (see chart below), marking the lowest prices seen since 2009. Each penny in lower gas prices roughly equates to $1 billion in savings, which has strengthened consumers’ balance sheets and contributed to the multi-year economic expansion. Although these savings have partially gone to pay down personal debt, these gas reserves have also provided a financial tailwind for record auto sales (estimated 17.5million in 2015) and a slow but steady recovery in the housing market. The outlook for “lower-for-longer” oil prices is further supported by an expanding oil glut from new, upcoming Iranian supplies. Due to the lifting of economic sanctions related to the global nuclear deal, Iran is expected to deliver crude oil to an already over-supplied world energy market during the first quarter of 2016. Additionally, the removal of the 40-year ban on U.S. oil exports -could provide a near-term ceiling on energy prices as well.
Counting Cash Cows
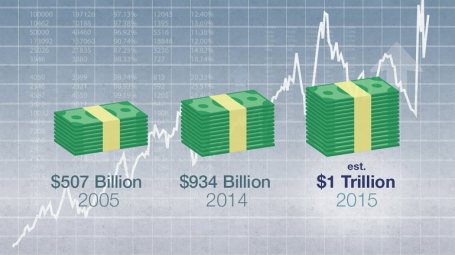
Catching some shut-eye after reading frightening 2015 headlines on the China slowdown, $96 billion Greek bailout/elections, and Paris/San Bernardino terrorist attacks forced some nervous investors to count sheep to fall asleep. However, long-term investors understand that underpinning this long-lived bull market are record revenues, profits, and cash flows. The record $4.7 trillion dollars in 2015 estimated mergers along with approximately $1 trillion in dividends and share buybacks (see chart below) is strong confirmation that investors should be concentrating on counting more cash cows than sheep, if they want to sleep comfortably.
INVESTMENT NIGHTMARES
Creepy Commodities: Putting aside the -30% collapse in WTI crude oil prices last year, commodity investors overall were exhausted in 2015. The -24% decline in the CRB Commodity Index and the -11% weakening in the Gold Index (GLD) was further proof that a strong U.S. dollar, coupled with stagnant global growth, caused investors a lot of tossing and turning. While bad for commodity exporting countries, the collapse in commodity prices will ultimately keep a lid on inflation and eventually become stimulative for those consumers suffering from lower standards of living.
Dollar Dread: The +25% spike in the value of the U.S. dollar over the last 18 months has made life tough for multinational companies. If your business received approximately 35-40% of their profits overseas and suddenly your goods cost 25% more than international competitors, you might grind your teeth in your sleep too. Monetary policies around the globe, including the European Union, will have an impact on the direction of future foreign exchange rates, but after a spike in the value of the dollar in early 2015, there are signs this scary move may now be stabilizing. Although multinationals are getting squeezed, now is the time for consumers to load up on cheap imports and take that bargain foreign vacation they have long been waiting for.
January has been a challenging month the last couple years, and inevitably there will be additional unknown turbulence ahead – the opening day of 2016 not being an exception (i.e., China slowdown concerns and Mideast tensions). However, given near record-low interest rates, record corporate profits, and accommodative central bank policies, the 2015 nap taken by global stock markets should supply the necessary energy to provide a lift to financial markets in the year ahead.
Wade W. Slome, CFA, CFP®
Plan. Invest. Prosper.
DISCLOSURE: Sidoxia Capital Management (SCM) and some of its clients hold positions VHT, AGG, and in certain exchange traded funds (ETFs), but at the time of publishing had no direct position VT, BTK, XLY, VGT, GLD, or in any other security referenced in this article. No information accessed through the Investing Caffeine (IC) website constitutes investment, financial, legal, tax or other advice nor is to be relied on in making an investment or other decision. Please read disclosure language on IC Contact page.
Bargain Hunting for Doorbuster Discounts

This article is an excerpt from a previously released Sidoxia Capital Management complimentary newsletter (December 1, 2015). Subscribe on the right side of the page for the complete text.
It’s that time of year again when an estimated 135 million bargain shoppers set aside personal dignity and topple innocent children in the name of Black Friday holiday weekend, doorbuster discounts. Whether you are buying a new big screen television at Amazon for half-off or a new low-cost index fund, everyone appreciates a good value or bargain, which amplifies the importance of the price you pay. Even though consumers are estimated to have spent $83 billion over the post-turkey-coma, holiday weekend, this spending splurge only represents a fraction of the total 2015 holiday shopping season frenzy. When all is said and done, the average person is projected to dole out $805 for the full holiday shopping season (see chart below) – just slightly higher than the $802 spent over the same period last year.

While consumers have displayed guarded optimism in their spending plans, Americans have demonstrated the same cautiousness in their investing behavior, as evidenced by the muted 2015 stock market gains. More specifically, for the month of November, stock prices increased by +0.32% for the Dow Jones Industrial Average (17,720) and +0.05% for the S&P 500 index (2,080). For the first 11 months of the year, the stock market results do not look much different. The Dow has barely slipped by -0.58% and the S&P 500 has inched up by +1.01%.
Given all the negative headlines and geopolitical concerns swirling around, how have stock prices managed to stay afloat? In the face of significant uncertainty, here are some of the calming factors that have supported the U.S. financial markets:
- Jobs Piling Up: The slowly-but-surely expanding economy has created about 13 million new jobs since late 2009 and the unemployment rate has been chopped in half (from a peak of 10% to 5%).

Source: Calafia Beach Pundit
- Housing Recovery: New and existing home sales are recovering and home prices are approaching previous record levels, as the Case-Shiller price indices indicate below.

Source: Calculated Risk Blog
- Strong Consumer: Cars are flying off the shelves at a record annualized pace of 18 million units – a level not seen since 2000. Lower oil and gasoline prices have freed up cash for consumers to pay down debt and load up on durable goods, like some fresh new wheels.

Source: Calculated Risk Blog
Despite a number of positive factors supporting stock prices near all-time record highs and providing plenty of attractive opportunities, there are plenty of risks to consider. If you watch the alarming nightly news stories on TV or read the scary newspaper headlines, you’re more likely to think it’s Halloween season rather than Christmas season.
At the center of the recent angst are the recent coordinated terrorist attacks that took place in Paris, killing some 130 people. With ISIS (Islamic State of Iraq and Syria) claiming responsibility for the horrific acts, political and military resources have been concentrated on the ISIS occupied territories of Syria and Iraq. Although I do not want to diminish the effects of the appalling and destructive attacks in Paris, the events should be placed in proper context. This is not the first or last large terrorist attack – terrorism is here to stay. As I show in the chart below, there have been more than 200 terrorist attacks that have killed more than 10 people since the 9/11 attacks. Much of the Western military power has turned a blind eye towards these post-9/11 attacks because many of them have taken place off of U.S. or Western country soil. With the recent downing of the Russian airliner (killing all 224 passengers), coupled with the Paris terror attacks, ISIS has gained the full military attention of the French, Americans, and Russians. As a result, political willpower is gaining momentum to heighten military involvement.

Source: Wikipedia
Investor anxiety isn’t solely focused outside our borders. The never ending saga of when the Federal Reserve will initiate its first Federal Funds interest rate target increase could finally be coming to an end. According to the CME futures market, there currently is a 78% probability of a 0.25% interest rate increase on December 16th. As I have said many times before, interest rates are currently near generational lows, and the widely communicated position of Federal Reserve Chairwoman Yellen (i.e., shallow slope of future interest rate hike trajectory) means much of the initial rate increase pain has likely been anticipated already by market participants. After all, a shift in your credit card interest rate from 19.00% to 19.25% or an adjustment to your mortgage rate from 3.90% to 4.15% is unlikely to have a major effect on consumer spending. In fact, the initial rate hike may be considered a vote of confidence by Yellen to the sustainability of the current economic expansion.
Shopping Without My Rose Colored Glasses
Regardless of the state of the economic environment, proper investing should be instituted through an unemotional decision-making process, just as going shopping should be an unemotional endeavor. Price and value should be the key criteria used when buying a specific investment or holiday gift. Unfortunately for many, emotions such as greed, fear, impatience, and instant gratification overwhelm objective measurements such as price and value.
As I have noted on many occasions, over the long-run, money unemotionally moves to where it is treated best. From a long-term perspective, that has meant more capital has migrated to democratic and capitalistic countries with a strong rule of law. Closed, autocratic societies operating under corrupt regimes have been the big economic losers.
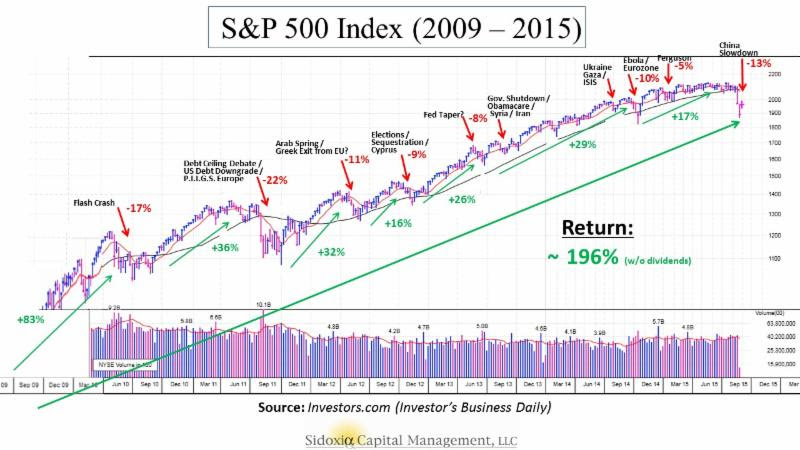
With all of that set aside, the last six years have created tremendous investment opportunities due to the extreme investor risk aversion created by the financial crisis – hence the more than tripling in U.S. stock prices since March 2009.
When comparing the yield (i.e., profit earned on an investment) between stocks and bonds, as shown in the chart below, you can see that stock investors are being treated significantly better than bond investors (6.1% vs. 4.0%). Not only are bond investors receiving a lower yield than stock investors, but bond investors also have no hope of achieving higher payouts in the future. Stocks, on the other hand, earn the opportunity of a double positive whammy. Not only are stocks currently receiving a higher yield, but stockholders could achieve a significantly higher yield in the future. For example, if S&P 500 earnings can grow at their historic rate of about 7%, then the current stock earnings yield of 6.1% would about double to 12.0% over the next decade at current prices. The inflated price and relative attractiveness of stocks looks that much better if you compare the 6.1% earnings yield to the paltry 2.2% 10-Year Treasury yield.

Source: Yardeni.com
This analysis doesn’t mean everyone should pile 100% of their portfolios into stocks, but it does show how expensively nervous investors are valuing bonds. Time horizon, risk tolerance, and diversification should always be pillars to a disciplined, systematic investment strategy, but as long as these disparities remain between the earnings yields on stocks and bonds, long-term investors should be able to shop for plenty of doorbuster discount bargain opportunities.
Wade W. Slome, CFA, CFP®
Plan. Invest. Prosper.
DISCLOSURE: Sidoxia Capital Management (SCM) and some of its clients hold positions in AMZN and certain exchange traded funds (ETFs), but at the time of publishing had no direct position in any other security referenced in this article. No information accessed through the Investing Caffeine (IC) website constitutes investment, financial, legal, tax or other advice nor is to be relied on in making an investment or other decision. Please read disclosure language on IC Contact page.
More Treats, Less Tricks

This article is an excerpt from a previously released Sidoxia Capital Management complimentary newsletter (November 2, 2015). Subscribe on the right side of the page for the complete text.
Have you finished licking the last of your Halloween chocolate-covered fingers and scheduled your next cavity-filled dental appointment? After a few challenging months, the normally spooky month of October produced an abundance of sweet treats rather than scary tricks for stock market investors. In fact, the S&P 500 index finished the month with a whopping +8.3% burst, making October the tastiest performing month since late 2010. This came in stark contrast to the indigestion experienced with the -8.7% decline over the previous two months.
What’s behind all these sweet gains? For starters, fears of a Chinese economic sugar-high ending in a crash have abated for now. With that said, “Little Red Riding Hood” is not out of the woods quite yet. Like a surprising goblin or ghost popping out to scare you at a Halloween haunted house, China could still rear its ugly head in the future due to its prominent stature as the second largest global economy. We have been forced to deal with similar on-again-off-again concerns associated with Greece.
The good news is the Chinese government and central bank are not sitting on their hands. In addition to interest rate cuts and corruption crackdowns, Chinese government officials have even recently halted its decades-long one-child policy. China’s new two-child policy is designed to spur flagging economic growth and also reverse the country’s aging demographic profile.
Also contributing to the stock market’s sugary October advances is an increasing comfort level with the Federal Reserve’s eventual interest rate increase. Just last week, the central bank released the statement from its October Federal Open Market Committee meetings stating it will determine whether it will be “appropriate” to increase interest rates at its next meetings, which take place on December 15th and 16th. Interest rate financial markets are now baking in a roughly 50% probability of a Fed interest rate hike next month. Initially, the October Fed statement was perceived negatively by investors due to fears that higher rates could potentially choke off economic growth. Within a 30 minute period after the announcement, stock prices reversed course and surged higher. Investors interpreted the Fed signal of a possible interest rate hike as an upbeat display of confidence in a strengthening economy.
As I have reiterated on numerous occasions (see also Fed Fatigue), a +0.25% increase in the Federal Funds rate from essentially a level of 0% is almost irrelevant in my eyes – just like adjusting the Jacuzzi temperature from 102 degrees down to 101 degrees is hardly noticeable. More practically speaking, an increase from 14.00% to 14.25% on a credit card interest rate will not deter consumers from spending, just like a 3.90% mortgage rising to 4.15% will not break the bank for homebuyers. On the other hand, if interest rates were to spike materially higher by 3.00% – 4.00% over a very short period of time, this move would have a much more disruptive impact, and would be cause for concern. Fortunately for equity investors, this scenario is rather unlikely in the short-run due to virtually no sign of inflation at either the consumer or worker level. Actually, if you read the Fed’s most recent statement, Fed Chairwoman Janet Yellen indicated the central bank intends to maintain interest rates below “normal” levels for “some time” even if the economy keeps chugging along at a healthy clip.
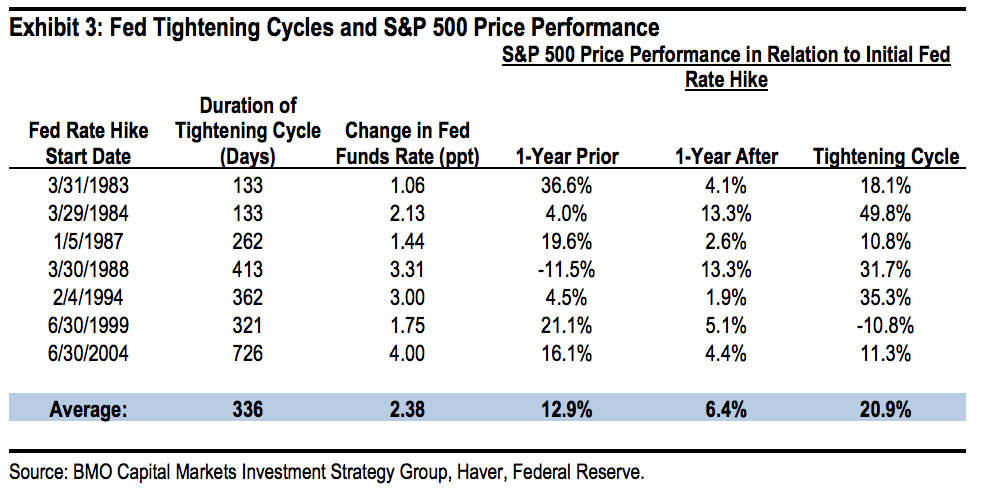
If you think my interest rate perspective is the equivalent of me whistling past the graveyard, history proves to be a pretty good guide of what normally happens after the Fed increases interest rates. Bolstering my argument is data observed over the last seven Federal Reserve interest rate hike cycles from 1983 – 2006 (see table below). As the statistics show, stock prices increased an impressive +20.9% on average over Fed interest rate “Tightening Cycles.” It is entirely conceivable that the announcement of a December interest rate hike could increase short-term volatility. We saw this rate hike fear phenomenon a few months ago, and also a few years ago in 2013 (see also Will Rising Rates Murder Market?) when Federal Reserve Chairman Ben Bernanke threatened an end to quantitative easing (a.k.a., “Taper Tantrum”), but eventually people figured out the world was not going to end and stock prices ultimately moved higher.
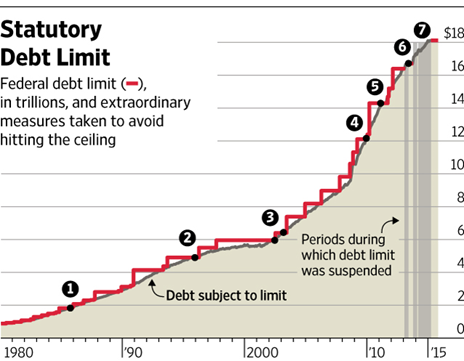
Besides increased comfort with Fed interest rate policies, another positive contributing factor to the financial market rebound was the latest Congressional approval of a two-year budget deal that prevents the government from defaulting on its debt. Not only does the deal suspend the $18.1 trillion debt limit through March 2017 (see chart below), but the legislation also lowers the chance of a government shutdown in December. Rather than creating a contentious battle for the fresh, incoming Speaker of the House (Paul Ryan), the approved budget deal will allow the new Speaker to start with a clean slate with which he can use to negotiate across a spectrum of political issues.
Source: Wall Street Journal
Remain Calm – Not Frightened
Humans, including all investors, are emotional beings, but the best investors separate fear from greed and are masters at making unemotional, objective decisions. Just as everything wasn’t a scary disaster when stocks declined during August and September, so too, the subsequent rise in October doesn’t mean everything is a bed of roses.
Every three months, thousands of companies share their financial report cards with investors, and so far with more than 65% of the S&P 500 companies reporting their results this period, corporate America is not making the honor roll. Collapsing commodity prices, including oil, along with the rapid appreciation in the value of the U.S. dollar (i.e., causing declines in relatively expensive U.S. exports), third quarter profit growth has declined -1%. If you exclude the energy sector from the equation, corporations are still not making the “Dean’s List,” however the report cards look a lot more respectable through this lens with profits rising +6% during the third quarter. A sluggish third quarter GDP (Gross Domestic Product) growth report of +1.5% is further evidence the economy has plenty of room to improve the country’s financial GPA.
Historically speaking, October has been a scary period, if you consider the 1929 and 1987 stock market crashes occurred during this Halloween month. Now that investors have survived this frightening period, we will see if the “Santa Claus Rally” will arrive early this season. Stock market treats have been sweet in recent weeks, but investors cannot lose sight of the long-term. With interest rates near generational lows, investors need to make sure they are efficiently investing their investment funds in a low-cost, tax-efficient, diversified manner, subject to personal time horizons and risk tolerances. Over the long-run, meeting these objectives will create a lot more treats than tricks.
Wade W. Slome, CFA, CFP®
Plan. Invest. Prosper.
DISCLOSURE: Sidoxia Capital Management (SCM) and some of its clients hold positions in certain exchange traded funds (ETFs) , but at the time of publishing, SCM had no direct position in any other security referenced in this article. No information accessed through the Investing Caffeine (IC) website constitutes investment, financial, legal, tax or other advice nor is to be relied on in making an investment or other decision. Please read disclosure language on IC Contact page.
The Bungee Market

This article is an excerpt from a previously released Sidoxia Capital Management complimentary newsletter (September 1, 2015). Subscribe on the right side of the page for the complete text.
Are you an adrenaline junkie? You may be one and not even know it. If you are an investor in the stock market, you may have noticed a sinking feeling in your investment portfolio before a sharp bounce-back, much like a bungee jump. Before the recent drop of -6.6% in the Dow during August, some stock investors got lulled into a state of complacency, considering a tripling in stock prices over the last six years.
Almost any current or future news headline has the capability of potentially triggering a short-term bungee jump in stock prices. Now, worries over the health of the Chinese economy and financial markets, coupled with concerns of an impending rate hike by the Federal Reserve have created some tension for global financial markets. The slowdown in China should not be ignored, but as famed investor Bill Nygren pointed out, its impact should be placed in the proper context. China only represents 15% of global economic activity and U.S. exports to China only account for 0.7% of our GDP.
- 5% market corrections, 3 times per year on average (“correction” = price decline);
- 10% market corrections, 1 time per year on average; and
- 20% market corrections, 1 time every 3.5 years on average.
Welcome Back Volatility! Mini Flash Crash
- Economic growth revised higher (Q2 GDP raised to +3.7% from +2.3%)
- Unemployment rate continues to drop ( at 5.3%, a 7-year low)
- Interest rates near historic lows (3.95%, 30-year mortgage rate), which will remain massively stimulative even if the Fed modestly increases short-term rates
- U.S. corporate profits are near record highs (despite dampening effect of the strong U.S. dollar on exports)
- Reasonable valuations (improved after latest index price declines)
- Housing market on a steady recovery (existing home sales at multi-year highs and pricing up +6% vs. July of last year)
- Massively accommodative central banks around the globe (e.g., European Central Bank and People’s Bank of China)
Wade W. Slome, CFA, CFP®
Plan. Invest. Prosper.
Investors Take a Vacation

This article is an excerpt from a previously released Sidoxia Capital Management complimentary newsletter (August 3, 2015). Subscribe on the right side of the page for the complete text.
It’s summertime and the stock market has taken a vacation, and it’s unclear when prices will return from a seven month break. It may seem like a calm sunset walk along the beach now that Greek worries have temporarily subsided, but concerns have shifted to an impending Federal Reserve interest rate hike, declining commodity prices, and a Chinese stock market crash, which could lead to a painful sunburn.
If you think about it, stock investors have basically been on unpaid vacation since the beginning of the year, with the Dow Jones Industrial Index (17,690) down -0.7% for 2015 and the S&P 500 (2,104) up + 2.2% over the same time period (see chart below). Despite mixed results for the year, all three main stock indexes rebounded in July (including the tech-heavy NASDAQ +2.8% for the month) after posting negative returns in June. Overall for 2015, sector performance has been muddled. There has been plenty of sunshine on the Healthcare sector (+11.7%), but Energy stocks have been stuck in the doldrums (-13.4%), over the same timeframe.

Source: Yahoo! Finance
Chinese Investors Suffer Heat Stroke
Despite gains for U.S. stocks in July, the overheated Chinese stock marketcaused some heat stroke for global investors with the Shanghai Composite index posting its worst one month loss (-15%) in six years, wiping out about $4 trillion in market value. Before coming back down to earth, the Chinese stock market inflated by more than +150% from 2014.
Driving the speculative fervor were an unprecedented opening of 12 million monthly accounts during spring, according to Steven Rattner, a seasoned financier, investor, and a New York Times journalist. Margin accounts operate much like a credit card for individuals, which allowed these investors to aggressively gamble on the China market upswing, but during the downdraft investors were forced to sell stocks to generate proceeds for outstanding loan repayments. It’s estimated that 25% of these investors only have an elementary education and a significant number of them are illiterate. Further exacerbating the sell-off were Chinese regulators artificially intervening by halting trading in about 500 companies on the Shanghai and Shenzhen exchanges last Friday, equivalent to approximately 18% of all listings.
Although China, as the second largest economy on the globe, is much more economically important than a country like Greece, recent events should be placed into proper context. For starters, as you can see from the chart below, the Chinese stock market is no stranger to volatility. According to Fundstrat Global Advisors, the Shanghai composite index has experienced 10 bear markets over the last 25 years, and the recent downdraft doesn’t compare to the roughly -75% decline we saw in 2007-2008. Moreover, there is no strong correlation between the Chinese stock market. Only 15% of Chinese households own stocks, or measured differently, only 6% of household assets are held in stocks, says economic-consulting firm IHS Global Insight. More important than the question, “What will happen to the Chinese stock market?,” is the question, “What will happen to the Chinese stock economy?,” which has been on a perennial slowdown of late. Nevertheless, China has a 7%+ economic growth rate and the highest savings rate of any major country, both factors for which the U.S. economy would kill.

Source: Yardeni.com
Don’t Take a Financial Planning Vacation
While the financial markets continue to bounce around and interest rates oscillate based on guesswork of a Federal Reserve interest rate hike in September, many families are now returning from vacations, or squeezing one in before the back-to-school period. The sad but true fact is many Americans spend more time planning their family vacation than they do planning for their financial futures. Unfortunately, individuals cannot afford to take a vacation from their investment and financial planning. At the risk of stating the obvious, planning for retirement will have a much more profound impact on your future years than a well-planned trip to Hawaii or the Bahamas.
We live in an instant gratification society where “spend now, save later” is a mantra followed by many. There’s nothing wrong with splurging on a vacation, and to maintain sanity and family cohesion it is almost a necessity. However, this objective does not have to come at the expense of compromising financial responsibility – or in other words spending within your means. Investing is a lot like consistent dieting and exercising…it’s easy to understand, but difficult to sustainably execute. Vacations, on the other hand, are easy to understand, and easy to execute, especially if you have a credit card with an available balance.
It’s never too late to work on your financial planning muscle. As I discuss in a previous article (Getting to Your Number) , one of the first key steps is to calculate an annual budget relative to your income, so one can somewhat accurately determine how much money can be saved/invested for retirement. Circumstances always change, but having a base-case scenario will help determine whether your retirement goals are achievable. If expectations are overly optimistic, spending cuts, revenue enhancing adjustments, and/or retirement date changes can still be made.
When it comes to the stock market, there are never a shortage of concerns. Today, worries include a Greek eurozone exit (“Grexit”); decelerating China economic growth and a declining Chinese stock market; and the viability of Donald’s Trump’s presidential campaign (or lack thereof). While it may be true that stock prices are on a temporary vacation, your financial and investment planning strategies cannot afford to go on vacation.

Wade W. Slome, CFA, CFP®
Plan. Invest. Prosper.
DISCLOSURE: Sidoxia Capital Management (SCM) and some of its clients hold positions in certain exchange traded funds (ETFs), but at the time of publishing, SCM had no direct position in any other security referenced in this article. No information accessed through the Investing Caffeine (IC) website constitutes investment, financial, legal, tax or other advice nor is to be relied on in making an investment or other decision. Please read disclosure language on IC Contact page.
Digesting Stock Gains

This article is an excerpt from a previously released Sidoxia Capital Management complementary newsletter (June 1, 2015). Subscribe on the right side of the page for the complete text.
Despite calls for “Sell in May, and go away,” the stock market as measured by both the Dow Jones Industrial and S&P 500 indexes grinded out a +1% gain during the month of May. For the year, the picture looks much the same…the Dow is up around +1% and the S&P 500 +2%. After gorging on gains of +30% in 2013 and +11% in 2014, it comes as no surprise to me that the S&P 500 is taking time to digest the gains. After eating any large pleasurable meal, there’s always a chance for some indigestion – just like last month. More specifically, the month of May ended as it did the previous six months…with a loss on the last trading day (-115 points). Providing some extra heartburn over the last 30 days were four separate 100+ point decline days. Realized fears of a Greek exit from the eurozone would no doubt have short-term traders reaching for some Tums antacid. Nevertheless, veteran investors understand this is par for the course, especially considering the outsized profits devoured in recent years.
The profits have been sweet, but not everyone has been at the table gobbling up the gains. And with success, always comes the skeptics, many of whom have been calling for a decline for years. This begs the question, “Are we in a stock bubble?” I think not.
Bubble Bites
Most asset bubbles are characterized by extreme investor/speculator euphoria. There are certainly small pockets of excitement percolating up in the stock market, but nothing like we experienced in the most recent burstings of the 2000 technology and 2006-07 housing bubbles. Yes, housing has steadily improved post the housing crash, but does this look like a housing bubble? (see New Home Sales chart)

Source: Dr. Ed’s Blog
Another characteristic of a typical asset bubble is rabid buying. However, when it comes to the investor fund flows into the U.S. stock market, we are seeing the exact opposite…money is getting sucked out of stocks like a Hoover vacuum cleaner. Over the last eight or so years, there has been almost -$700 billion that has hemorrhaged out of domestic equity funds – actions tend to speak louder than words (see chart below):
 Source: Investment Company Institute (ICI)
The shift to Exchange Traded Funds (ETFs) offered by the likes of iShares and Vanguard doesn’t explain the exodus of cash because ETFs such as S&P 500 SPDR ETF (SPY) are suffering dramatically too. SPY has drained about -$17 billion alone over the last year and a half.
With money flooding out of these stock funds, how can stock prices move higher? Well, one short answer is that hundreds of billions of dollars in share buybacks and trillions in mergers and acquisitions activity (M&A) is contributing to the tide lifting all stock boats. Low interest rates and stimulative monetary policies by central banks around the globe are no doubt contributing to this positive trend. While the U.S. Federal Reserve has already begun reversing its loose monetary policies and has threatened to increase short-term interest rates, by any objective standard, interest rates should remain at very supportive levels relative to historical benchmarks.
Besides housing and fund flows data, there are other unbiased sentiment indicators that indicate investors have not become universally Pollyannaish. Take for example the weekly AAII Sentiment Survey, which shows 73% of investors are currently Bearish and/or Neutral – significantly higher than historical averages.
The Consumer Confidence dataset also shows that not everyone is wearing rose-colored glasses. Looking back over the last five decades, you can see the current readings are hovering around the historical averages – nowhere near the bubblicious 2000 peak (~50% below).

Source: Bespoke
Recession Reservations
Even if you’re convinced there is no imminent stock market bubble bursting, many of the same skeptics (and others) feel we’re on the verge of a recession – I’ve been writing about many of them since 2009. You could choke on an endless number of economic indicators, but on the common sense side of the economic equation, typically rising unemployment is a good barometer for any potentially looming recession. Here’s the unemployment rate we’re looking at now (with shaded periods indicating prior recessions):

As you can see, the recent 5.4% unemployment rate is still moving on a downward, positive trajectory. By most peoples’ estimation, because this has been the slowest recovery since World War II, there is still plenty of labor slack in the market to keep hiring going.
An even better leading indicator for future recessions has been the slope of the yield curve. A yield curve plots interest rate yields of similar bonds across a range of periods (e.g., three-month bill, six-month bill, one-year bill, two-year note, five-year note, 10-year note and 30-year bond). Traditionally, as short-term interest rates move higher, this phenomenon tends to flatten the yield curve, and eventually inverts the yield curve (i.e., short-term interest rates are higher than long-term interest rates). Over the last few decades, when the yield curve became inverted, it was an excellent leading indicator of a pending recession (click here and select “Animate” to see amazing interactive yield curve graph). Fortunately for the bulls, there is no sign of an inverted yield curve – 30-year rates remain significantly higher than short-term rates (see chart below).

Stock market skeptics continue to rationalize the record high stock prices by pointing to the artificially induced Federal Reserve money printing buying binge. It is true that the buffet of gains is not sustainable at the same pace as has been experienced over the last six years. As we continue to move closer to full employment in this economic cycle, the rapid accumulated wealth will need to be digested at a more responsible rate. An unexpected Greek exit from the EU or spike in interest rates could cause a short-term stomach ache, but until many of the previously mentioned indicators reach dangerous levels, please pass the gravy.
Wade W. Slome, CFA, CFP®
Plan. Invest. Prosper.
DISCLOSURE: Sidoxia Capital Management (SCM) and some of its clients hold positions in SPY and other certain exchange traded funds (ETFs), but at the time of publishing, SCM had no direct position in any other security referenced in this article. No information accessed through the Investing Caffeine (IC) website constitutes investment, financial, legal, tax or other advice nor is to be relied on in making an investment or other decision. Please read disclosure language on IC Contact page.
Time for Your Retirement Physical

This article is an excerpt from a previously released Sidoxia Capital Management complementary newsletter (October 1, 2014). Subscribe on the right side of the page for the complete text.
As a middle-aged man, I’ve learned the importance of getting my annual physical to improve my longevity. The same principle applies to the longevity of your retirement account. With the fourth quarter of the calendar year officially underway, there is no better time to probe your investment portfolio and prescribe some recommendations relating to your financial goals.
A physical is especially relevant given all the hypertension raising events transpiring in the financial markets during the third quarter. Although the large cap biased indexes (Dow Jones Industrials and S&P 500) were up modestly for the quarter (+1.3% and +0.6%, respectively), the small and mid-cap stock indexes underperformed significantly (-8.0% [IWM] and -4.2% [SPMIX], respectively). What’s more, all the daunting geopolitical headlines and uncertain macroeconomic data catapulted the Volatility Index (VIX – aka, “Fear Gauge”) higher by a whopping +40.0% over the same period.
- What caused all the recent heartburn? Pick your choice and/or combine the following:
- ISIS in Iraq
- Bombings in Syria
- End of Quantitative Easing (QE) – Impending Interest Rate Hikes
- Mid-Term Elections
- Hong Kong Protests
- Tax Inversions
- Security Hacks
- Rising U.S. Dollar
- PIMCO’s Bill Gross Departure
(See Hot News Bites in Newsletter for more details)
As I’ve pointed out on numerous occasions, there is never a shortage of issues to worry about (see Series of Unfortunate Events), and contrary to what you see on TV, not everything is destruction and despair. In fact, as I’ve discussed before, corporate profits are at record levels (see Retail Profits chart below), companies are sitting on trillions of dollars in cash, the employment picture is improving (albeit slowly), and companies are finally beginning to spend (see Capital Spending chart below):
Retail Profits

Source: Dr. Ed’s Blog
Capital Spending

Source: Calafia Beach Pundit
Even during prosperous times, you can’t escape the dooms-dayers because too much of a good thing can also be bad (i.e., inflation). Rather than getting caught up in the day-to-day headlines, like many of us investment nerds, it is better to focus on your long-term financial goals, diversification, and objective financial metrics. Even us professionals become challenged by sifting through the never-ending avalanche of news headlines. It’s better to stick with a disciplined, systematic approach that functions as shock absorbers for all the inevitable potholes and speed bumps. Investment guru Peter Lynch said it best, “Assume the market is going nowhere and invest accordingly.” Everyone’s situation and risk tolerance is different and changing, which is why it’s important to give your financial plan a recurring physical.
Vacation or Retirement?
Keeping up with the Joneses in our instant gratification society can be a taxing endeavor, but ultimately investors must decide between 1) Spend now, save later; or 2) Save now, spend later. Most people prefer the more enjoyable option (#1), however these individuals also want to retire at a young age. Often, these competing goals are in conflict. Unless, you are Oprah or Bill Gates (or have rich relatives), chances are you must get into the practice of saving, if you want a sizeable nest egg…before age 85. The problem is Americans typically spend more time planning their vacation than they do planning for retirement. Talking about finances with an advisor, spouse, or partner can feel about as comfortable as walking into a cold doctor’s office while naked under a thin gown. Vulnerability may be an undesirable emotion, but often it is a necessity to reach a desired goal.
Ignorance is Not Bliss – Avoid Procrastination
Many people believe “ignorance is bliss” when it comes to healthcare and finance, which we all know is the worst possible strategy. Normally, individuals have multiple IRA, 401(k), 529, savings, joint, trust, checking and other accounts scattered around with no rhyme or reason. As with healthcare, reviewing finances most often takes place whenever there is a serious problem or need, which is usually at a point when it’s too late. Unfortunately, procrastination typically wins out over proactiveness. Just because you may feel good, or just because you are contributing to your employer’s 401(k), doesn’t mean you shouldn’t get an annual physical for your health and finances. I’m the perfect example. While I feel great on the outside, ignoring my high cholesterol lab results would be a bad idea.
And even for the DIY-ers (Do-It-Yourself-ers), rebalancing your portfolio is critical. In the last fifteen years, overexposure to technology, real estate, financials, and emerging markets at the wrong times had the potential of creating financial ruin. Like a boat, your investment portfolio needs to remain balanced in conjunction with your goals and risk tolerance, or your savings might tip over and sink.
Financial markets go up and down, but your long-term financial well-being does not have to become hostage to the daily vicissitudes. With the fourth quarter now upon us, take control of your financial future and schedule your retirement physical.
Wade W. Slome, CFA, CFP®
Plan. Invest. Prosper.
DISCLOSURE: Sidoxia Capital Management (SCM) and some of its clients hold positions in certain exchange traded funds (ETFs), but at the time of publishing SCM had no direct position in IWM, SPMIX, or any other security referenced in this article. No information accessed through the Investing Caffeine (IC) website constitutes investment, financial, legal, tax or other advice nor is to be relied on in making an investment or other decision. Please read disclosure language on IC Contact page.
Back to the Future: Mag Covers (Part I)
Magazine Covers Part II – – – Magazine Covers Part III
I’m not referring to the movie, Back to the Future, about a plutonium-powered DeLorean time machine that finds Marty McFly (played by Michael J. Fox) traveling back in time. Rather, I am shining the light on the uncanny ability of media outlets (specifically magazines) to mark key turning points in financial markets – both market bottoms and market tops. This will be the first in a three part series, providing a few examples of how magazines have captured critical periods of maximum fear (buying opportunities) and greed (selling signals).
People tend to have short memories, especially when it comes to the emotional rollercoaster ride we call the stock market. Thanks to globalization, the internet, and the 24/7 news cycle, we are bombarded with some fear factor to worry about every day. Although I might forget what I had for breakfast, I have been a student of financial market history and have experienced enough cycles to realize as Mark Twain famously stated, “History never repeats itself, but it often rhymes” (read previous market history article). In that vein, let us take a look at a few covers from the 1970s:

Newsweek’s “The Big Bad Bear” issue came out on September 9, 1974 when the collapse of the so-called “Nifty Fifty” (the concentrated set of glamour stocks or “Blue Chips”) was in full swing. This group of stocks, like Avon, McDonalds, Polaroid, Xerox, IBM and Disney, were considered “one-decision” stocks investors could buy and hold forever. Unfortunately, numerous of these hefty priced stocks (many above a 50 P/E) came crashing down about 90% during the1973-74 period.
Why the glum sentiment? Here are a few reasons:
- Exiting Vietnam War
- Undergoing a Recession
- 9% Unemployment
- Arab Oil Embargo
- Watergate: Presidential Resignation
- Franklin National Failure

A cartoon from the same bearish 1974 cover article.
Not a rosy backdrop, but was this scary and horrific phase the ideal time to sell, as the magazine cover may imply? No, actually this was a shockingly excellent time to purchase equities. The Dow Jones Industrial Average, priced at 627 when the magazine was released, is now trading around 10,247…not too shabby a return considering the situation looked pretty darn bleak at the time.
Reports of the Market’s Death Greatly Exaggerated

Sticking with the Mark Twain theme, the reports of the market’s demise was greatly exaggerated too – much the same way we experienced the overstated reaction to the financial crisis early in 2009. BusinessWeek’s August 13, 1979 magazine captured the essence of the bearish mood in the article titled, “The Death of Equities.” This article came out, of course, about 18 months before a multi-decade upward explosion in prices that ended in the “Dot-com” crash of 2000. In the late 1970s, inflation reached double digit levels; gold and oil had more than doubled in price; Paul Volcker became the Federal Reserve Chairman and put on the economic brakes via a tough, anti-inflationary interest rate program; and President Jimmy Carter was dealing with an Iranian Revolution that led to the capture of 63 U.S. hostages. Like other bear market crashes in our history, this period also served as a tremendous time to buy stocks. As you can see from the chart above, the Dow was at 833 at the time of the magazine printing – in the year 2000, the Dow peaked at over 14,000.
This walk down memory lane is not complete. Conveniently, the Back to the Future story was designed as a trilogy (just like my three-part magazine review). You can relive Parts II & III here: Magazine Covers Part II – – – Magazine Covers Part III
Wade W. Slome, CFA, CFP®
Plan. Invest. Prosper.
DISCLOSURE: Sidoxia Capital Management (SCM) has a short position in MCD at the time this article was originally posted. SCM owns certain exchange traded funds, IBM, and DIS, but currently has no direct position in Avon (AVP), Polaroid, Xerox (XRX). No information accessed through the Investing Caffeine (IC) website constitutes investment, financial, legal, tax or other advice nor is to be relied on in making an investment or other decision. Please read disclosure language on IC “Contact” page.
Market Champagne Sits on Ice

Summer may be coming to an end, but the heat in the stock market has not cooled down, as the stock market registered its hottest August performance in 14 years (S&P 500 index up +3.8%). With these stellar results, one would expect the corks to be popping, cash flowing into stocks, and the champagne flowing. However, for numerous reasons, we have not seen this phenomenon occur yet. Until the real party begins, I suppose the champagne will stay on ice.
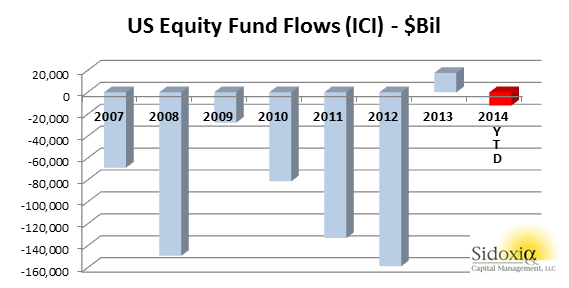
At the end of last year, I wrote further about the inevitable cash tsunami topic in an article entitled, “Here Comes the Dumb Money.” At that point in time, stocks had remarkably logged an approximate +30% return, and all indications were pointing towards an upsurge of investor interest in the stock market. So far in 2014, the party has continued as stocks have climbed another +8.4% for the year, but a lot of the party guests have not arrived yet. With the water temperature in the pool being so enticing, one would expect everyone to jump in the stock market pool. Actually, we have seen the opposite occur as -$12 billion has been pulled out of U.S. stock funds so far in 2014 (see ICI chart below).
How can the market be up +8.4% when money is coming out of stocks? For starters, companies are buying stock by the hundreds of billions of dollars. An estimated $480 billion of stock was purchased by corporations last year via share repurchase authorizations. Adding fuel to the stock fire are near record low interest rates. The ultra-low rates have allowed companies to borrow money at unprecedented rates for the purpose of not only buying back chunks of stock, but also buying the stock of whole companies (Mergers & Acquisitions). Thomson Reuters estimates that M&A activity in 2014 has already reached $2.2 trillion, up more than +70% compared to the same period last year.
Another factor contributing to the lackluster appetite for stocks is the general public’s apathy and disinterest in the market. This disconnected sentiment was captured beautifully by a recent Gallup survey, which asked people the following question:
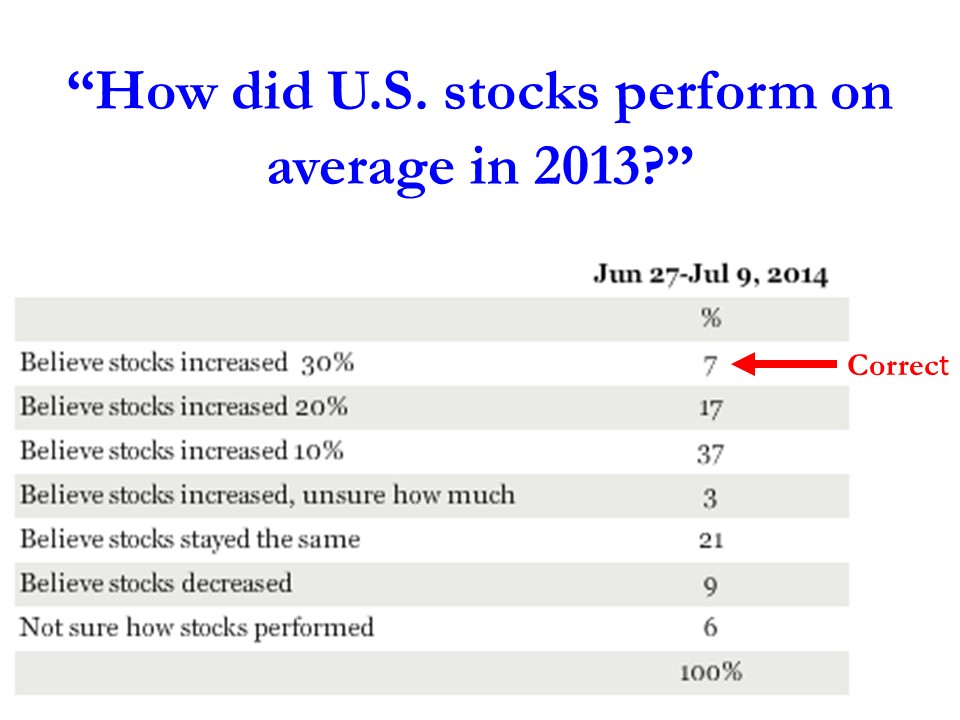
As you can see, only 7% of the respondents realized that stocks were up by more than +30% in 2013. More specifically, the S&P 500 (Large Cap) index was up +29.6%, S&P 600 (Small Cap) +39.7%, and the S&P 400 (Mid Cap) +31.6% (all percentages exclude dividends). Despite these data points, if taken with near 15-year low household stock ownership data, the results prove sentiment is nowhere near the euphoric phases reached before the 2000 bubble burst or the 2006-2008 real estate collapse.
Beyond the scarring effects of the 2008-2009 financial crisis, tempered moods regarding stocks can also be attributed to fresher geopolitical concerns (i.e., military tensions in Ukraine, Islamic extremists in Iraq, and missile launches from the Gaza Strip). The other area of never-ending anxiety is Federal Reserve monetary policy. The stock market, which has tripled in value from early 2009, has skeptics continually blaming artificial Quantitative Easing/QE policies (stimulative bond purchases) as the sole reason behind stocks advance. With current Fed Chair Janet Yellen pulling 70% of the QE punch bowl away (bond purchases now reduced to $25 billion per month), the bears are having a difficult time explaining rising stock prices and declining interest rates. Once all $85 billion in monthly QE purchases are expected to halt in October, skeptics will have one less leg on their pessimistic stool to sit on.
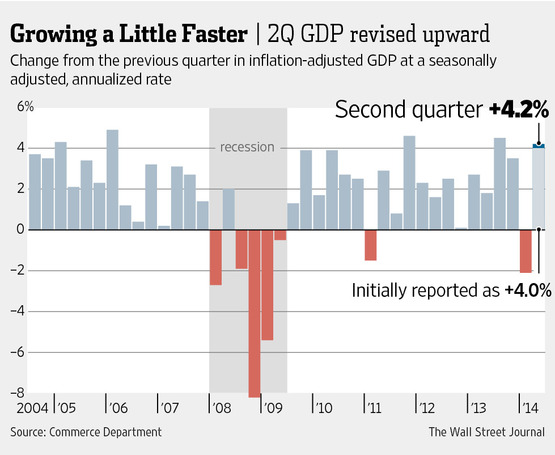
Economy and Profits Play Cheery Tune
While geopolitical and Federal Reserve clouds may be preventing many sourpusses from joining the stock party, recent economic and corporate data have party attendees singing a cheery tune. More specifically, the broadest measurement of economic activity, GDP (Gross Domestic Product), came in at a higher-than-expected level of +4.2% for the 2nd quarter (see Wall Street Journal chart below).
Moreover, the spike in July’s Durable Goods orders also paints a healthy economic picture (see chart below). The data is volatile (i.e., Boeing Co orders – BA), nevertheless, CEO confidence is on the rise. Improved confidence results in executives opening up their wallets and investing more into their businesses.
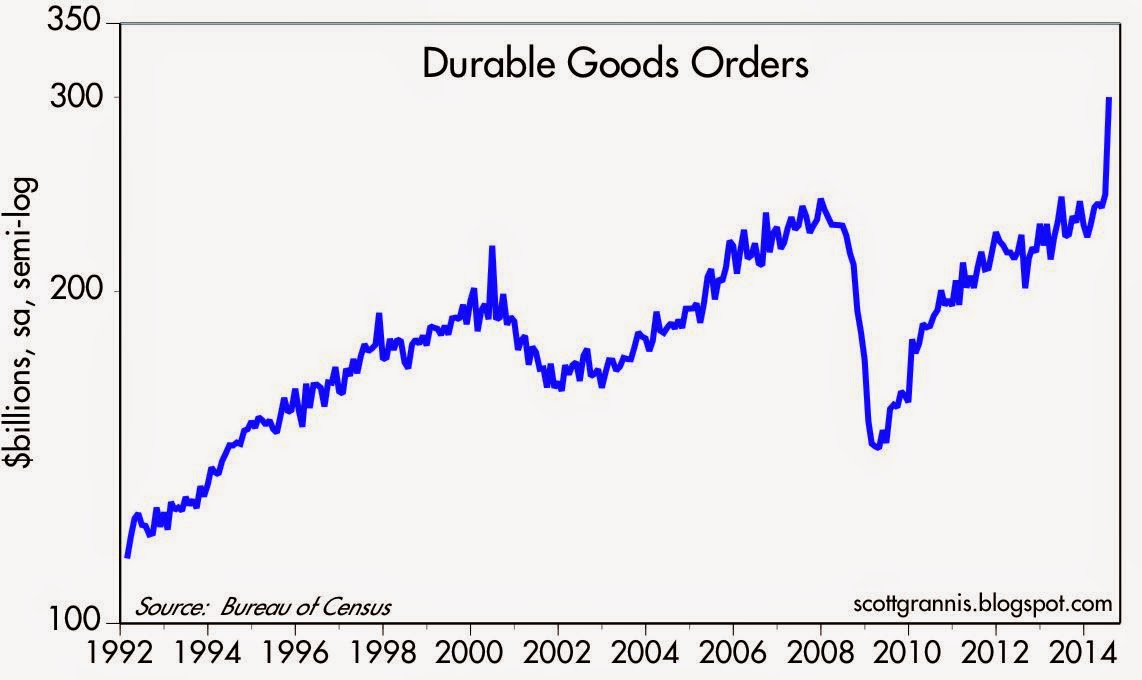
Source: Calafia Beach Pundit
Last but not least, the lifeblood of appreciating stock prices (earnings/profits) have been accelerating higher. In the most recent quarterly results, we saw a near doubling of the growth rate from 1st quarter’s +5% growth rate to 2nd quarter’s +10% growth rate (see chart below).
Source: Dr. Ed’s Blog
With the S&P 500 continuing to make new record highs despite scary geopolitical and Federal Reserve policy concerns, the stock market party is still waiting for guests to arrive. When everyone arrives and jumps in the pool, it will be time to pop the corks and sell. Until then, there is plenty of appreciation potential as the champagne sits on ice.


