Posts tagged ‘S&P 500’
Half Trump Empty, or Half Trump Full?

This article is an excerpt from a previously released Sidoxia Capital Management complimentary newsletter (December 1, 2016). Subscribe on the right side of the page for the complete text.
It was a bitter U.S. presidential election, but fortunately, the nastiest election mudslinging has come to an end…at least until the next political contest. Unfortunately, like most elections, even after the president-elect has been selected, almost half the country remains divided and the challenges facing the president-elect have not disappeared.
While some non-Trump voters have looked at the glass as half empty, since the national elections, the stock market glass has been overflowing to new record highs. Similar to the unforeseen British Brexit outcome in which virtually all pollsters and pundits got the results wrong, U.S. experts and investors also initially took a brief half-glass full view of the populist victory of Donald Trump. More specifically, for a few hours on Election Day, stock values tied to the Dow Jones Industrial Average index collapsed by approximately -5%.
It didn’t take long for stock prices to quickly reverse course, and when all was said and done, the Dow Jones Industrial Average finished the month higher by almost +1,000 points (+5.4%) to finish at 19,124 – a new all-time record high (see chart below). Worth noting, stocks have registered a very respectable +10% return during 2016, and the year still isn’t over.
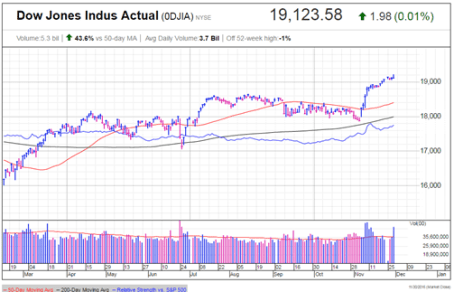
Source: Investors.com (IBD)
Drinking the Trump Egg Nog
Why are investors so cheery? The proof will be in the pudding, but current optimism is stemming from a fairly broad list of anticipated pro-growth policies.
At the heart of the reform is the largest expected tax reform since Ronald Reagan’s landmark legislation three decades ago. Not only is Trump proposing stimulative tax cuts for corporations, but also individual tax reductions targeted at low-to-middle income taxpayers. Other facets of the tax plan include simplification of the tax code; removal of tax loopholes; and repatriation of foreign cash parked abroad. Combined, these measures are designed to increase profits, wages, investment spending, productivity, and jobs.
On the regulatory front, the President-elect has promised to repeal the Obamacare healthcare system and also overhaul the Dodd-Frank financial legislation. These initiatives, along with talk of dialing back other regulatory burdensome laws and agencies have many onlookers hopeful such policies could aid economic growth.
Fueling further optimism is the prospect of a trillion dollar infrastructure spending program created to fix our crumbling roads and bridges, while simultaneously increasing jobs.
No Free Lunch
As is the case with any economic plan, there is never a free lunch. Every cost has a benefit, and every benefit has a cost. The cost of the 2008-2009 Financial crisis is reflected in the sluggish economic growth seen in the weak GDP (Gross Domestic Product) statistics, which have averaged a modest +1.6% growth rate over the last year. Scott Grannis points out how the slowest recovery since World War II has resulted in a $3 trillion economic gap (see chart below).
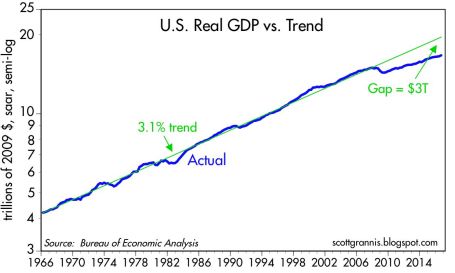
Source: Calafia Beach Pundit
The silver lining benefit to weak growth has been tame inflation and the lowest interest rate levels experienced in a generation. Notwithstanding the recent rate rise, this low rate phenomenon has spurred borrowing, and improved housing affordability. The sub-par inflation trends have also better preserved the spending power of American consumers on fixed incomes.
If executed properly, the benefits of pro-growth policies are obvious. Lower taxes should mean more money in the pockets of individuals and businesses to spend and invest on the economy. This in turn should create more jobs and growth. Regulatory reform and infrastructure spending should have similarly positive effects. However, there are some potential downside costs to the benefits of faster growth, including the following:
- Higher interest rates
- Rising inflation
- Stronger dollar
- Greater amount of debt
- Larger deficits (see chart below)
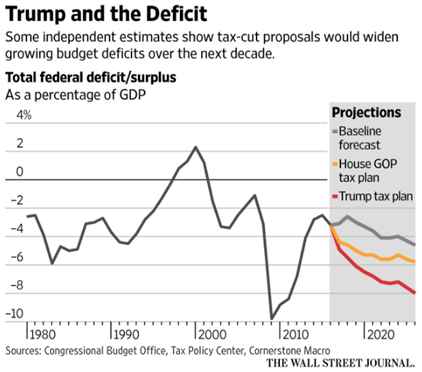
Source: The Wall Street Journal
Even though President-elect Trump has not even stepped foot into the Oval Office yet, signs are already emerging that we could face some or all of the previously mentioned headwinds. For example, just since the election, the yield on 10-Year Treasury Notes have spiked +0.5% to 2.37%, and 30-Year Fixed Rate mortgages are flirting with 4.0%. Social and economic issues relating to immigration legislation and Supreme Court nominations are likely to raise additional uncertainties in the coming months and years.
Attempting to anticipate and forecast pending changes makes perfect sense, but before you turn your whole investment portfolio upside down, it’s important to realize that actions speak louder than words. Even though Republicans have control over the three branches of government (Executive, Legislative, Judicial), the amount of control is narrow (i.e., the Senate), and the nature of control is splintered. In other words, Trump will still have to institute the “art of the deal” to persuade all factions of the Republicans (including establishment, Tea-Party, and rural) and Democrats to follow along and pass his pro-growth policies.
Although I do not agree with all of Trump’s policies, including his rhetoric on trade (see Free Trade Boogeyman), I will continue paying closer attention to his current actions rather than his past words. Until proven otherwise, I will keep on my rose colored glasses and remain optimistic that the Trump glass is half full, not half empty.

Wade W. Slome, CFA, CFP®
Plan. Invest. Prosper.
DISCLOSURE: Sidoxia Capital Management (SCM) and some of its clients hold positions in certain exchange traded funds (ETFs), but at the time of publishing had no direct position in any other security referenced in this article. No information accessed through the Investing Caffeine (IC) website constitutes investment, financial, legal, tax or other advice nor is to be relied on in making an investment or other decision. Please read disclosure language on IC Contact page.
Cleaning Out Your Investment Fridge

This article is an excerpt from a previously released Sidoxia Capital Management complimentary newsletter (June 1, 2016). Subscribe on the right side of the page for the complete text.
Summer is quickly approaching, but it’s not too late to do some spring cleaning. This principle not only applies to your cluttered refrigerator with stale foods but also your investment portfolio with moldy investments. In both cases, you want to get rid of the spoiled goods. It’s never fun discovering a science experiment growing in your fridge.
Over the last three months, the stock market has been replenished after a rotten first two months of the year (S&P 500 index was down -5.5% January through February). The +1.5% increase in May added to a +6.6% and +0.3% increase in March and April (respectively), resulting in a three month total advance in stock prices of +8.5%. Not surprisingly, the advance in the stock market is mirroring the recovery we have seen in recent economic data.
After digesting a foul 1st quarter economic Gross Domestic Product (GDP) reading of only +0.8%, activity has been smelling better in the 2nd quarter. A recent wholesome +3.4% increase in April durable goods orders, among other data points, has caused the Atlanta Federal Reserve Bank to raise its 2nd quarter GDP estimate to a healthier +2.9% growth rate (from its prior +2.5% forecast).
Consumer spending, which accounts for roughly 70% of our country’s economic activity, has been on the rise as well. The improving employment picture (5.0% unemployment rate last month) means consumers are increasingly opening their wallets and purses. In addition to spending more on cars, clothing, movies, and vacations, consumers are also doling out a growing portion of their income on housing. Housing developers have cautiously kept a lid on expansion, which has translated into limited supply and higher home prices, as evidenced by the Case-Shiller indices charted below.
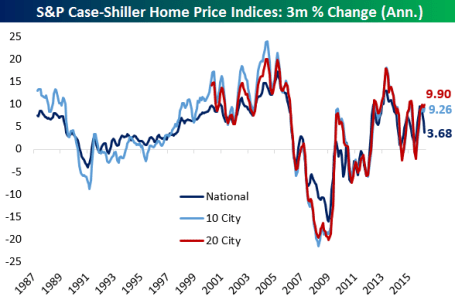
Source: Bespoke
Spoiling the Fun?
While the fridge may look like it’s fully stocked with fresh produce, meat, and dairy, it doesn’t take long for the strawberries to get moldy and the milk to sour. Investor moods can sour quickly too, especially as they fret over the impending “Brexit” (British Exit) referendum on June 23rd when British voters will decide whether they want to leave the European Union. A “yes” exit vote has the potential of roiling the financial markets and causing lots of upset stomachs.
Another financial area to monitor relates to the Federal Reserve’s monetary policy and its decision when to further increase the Federal Funds interest rate target at its June 14th – 15th meeting. With the target currently set at an almost insignificantly small level of 0.25% – 0.50%, it really should not matter whether Chair Janet Yellen decides to increase rates in June, July, September and/or November. Considering interest rates are at/near generational lows (see chart below), a ¼ point or ½ point percentage increase in short-term interest rates should have no meaningfully negative impact on the economy. If your fridge was at record freezing levels, increasing the temperature by a ¼ or ½ degree wouldn’t have a major effect either. If and when short-term interest rates increase by 2.0%, 3.0%, or 4.0% in a relatively short period will be the time to be concerned.
Source: Scott Grannis
Keep a Fresh Financial Plan
As mentioned earlier, your investments can get stale too. Excess cash sitting idly earning next-to-nothing in checking, savings, CDs, or in traditional low-yielding bonds is only going to spoil rapidly to inflation as your savings get eaten away. In the short-run, stock prices will move up and down based on frightening but insignificant headlines. However, in the long-run, the more important issues are determining how you are going to reach your retirement goals and whether you are going to outlive your savings. This mindset requires you to properly assess your time horizon, risk tolerance, income needs, tax situation, estate plan, and other unique circumstances. Like a balanced diet of various food groups in your refrigerator, your key personal financial planning factors are dependent upon you maintaining a properly diversified asset allocation that is periodically rebalanced to meet your long-term financial goals.
Whether you are managing your life savings, or your life-sustaining food supply, it’s always best to act now and not be a couch potato. The consequences of sitting idle and letting your investments spoil away are a lot worse than letting the food in your refrigerator rot away.
Wade W. Slome, CFA, CFP®
Plan. Invest. Prosper.
DISCLOSURE: Sidoxia Capital Management (SCM) and some of its clients hold positions in certain exchange traded funds (ETFs), but at the time of publishing had no direct position in any other security referenced in this article. No information accessed through the Investing Caffeine (IC) website constitutes investment, financial, legal, tax or other advice nor is to be relied on in making an investment or other decision. Please read disclosure language on IC Contact page.
NASDAQ Redux

The NASDAQ Composite index once again crossed the psychologically, all-important 5,000 threshold this week for the first time since the infamous tech-bubble burst in the year 2000. Of course, naturally, the media jumped on a non-stop, multi-day offensive comparing and contrasting today’s NASDAQ vs. the NASDAQ twin of yesteryear. Rather than rehash the discussion once again, I have decided to post three articles I published in recent years on the topic covering the outperformance of the spotlighted, tech-heavy index.
NASDAQ 5,000 Irrational Exuberance Déjà Vu?

Investors love round numbers and with the Dow Jones Industrial index recently piercing 17,000 and the S&P 500 index having broken 2,000 , even novice investors have something to talk about around the office water cooler. While new all-time records are being set for the major indices during September, the unsung, tech-laden NASDAQ index has yet to surpass its all-time high of 5,132 achieved 14 and ½ years ago during March of 2000.
Click Here to Read the Rest of the Article
NASDAQ and the R&D Tech Revolution

It’s been a bumpy start for stocks so far in 2014, but the fact of the matter is the NASDAQ Composite Index is up this year and hit a 14-year high in the latest trading session (highest level since 2000). The same cannot be said for the Dow Jones Industrial and S&P 500 indices, which are both lagging and down for the year. Not only did the NASDAQ outperform the Dow by almost +12% in 2013, but the NASDAQ has also trounced the Dow by over +70% over the last five years.
Click Here to Read the Rest of the Article
NASDAQ: The Ugly Stepchild

All the recent media focus has been fixated on whether the Dow Jones Industrial Average index (“The Dow”) will close above the 13,000 level. In the whole scheme of things, this specific value doesn’t mean a whole lot, but it does make for a great topic of conversation at a cocktail party. Today, the Dow is trading at 12,983, a level not achieved in more than three and a half years. Not a bad accomplishment, given the historic financial crisis on our shores and the debacle going on overseas, but I’m still not so convinced a miniscule +0.1% move in the Dow means much. While the Dow and the S&P 500 indexes garner the hearts and minds of journalists and TV reporters, the ugly stepchild index, the NASDAQ, gets about as much respect as Rodney Dangerfield (see also No Respect in the Investment World).
Click Here to Read the Rest of the Article

Wade W. Slome, CFA, CFP®
Plan. Invest. Prosper.
DISCLOSURE: Sidoxia Capital Management (SCM) and some of its clients hold positions in certain exchange traded funds (ETFs) , but at the time of publishing, SCM had no direct position in any other security referenced in this article. No information accessed through the Investing Caffeine (IC) website constitutes investment, financial, legal, tax or other advice nor is to be relied on in making an investment or other decision. Please read disclosure language on IC Contact page.
The Gift that Keeps on Giving

There have been numerous factors contributing to this bull market, even in the face of a slew of daunting and exhausting headlines. Contributing to the advance has been a steady stream of rising earnings; a flood of price buoying stock buybacks; and the all-important gift of growing dividends that keep on giving. Bonds have benefited to a lesser extent than stocks over the last five years in part because bonds lack the gift of rising dividend payouts. Life would be grander for bondholders, if the issuers had the heart to share generous news like this:
“Good day Mr. & Mrs. Jones. As your bond issuer, we value our mutually beneficial relationship so much that we would like to reward you as a bond investor. In addition to the 2.5% we are paying you now, we have decided to increase your annual payments by 6% per year for the next 20 years. In other words, we will increase your $2,500 in annual interest payments to over $8,000 per year. But wait…there’s more! You are such great people, we are going to increase the value of your initial $100,000 investment to $450,000.”
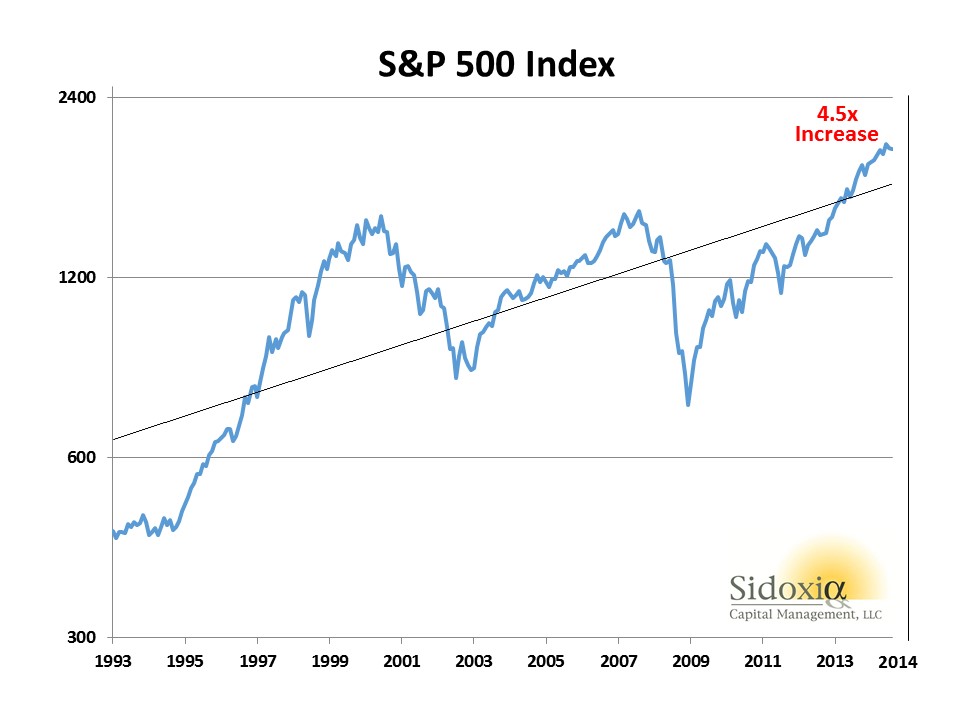
Does this sound too good to be true? Well, it’s not…sort of. However, the scenario is absolutely true, if you invested $100,000 in S&P 500 stocks during 1993 and held that investment until today. Unfortunately, the gift giving conversation above would be unattainable and the furthest from the truth, if you invested $100,000 into bonds. Today, if you decided to invest $100,000 in 20-year government bonds paying 2.5%, your $2,500 in annual payments will never increase over the next two decades. What’s more, by 2034 your initial principal of $100,000 won’t increase by a penny, while inflation slowly but surely crushes your investment’s purchasing power.
To illustrate the magical power of dividend compounding at a 6% CAGR, here is a chart of the S&P 500 dividend stream over the 21-year period of 1993 – 2014:

The trend of increasing dividends doesn’t appear to be slowing either. Here is a table showing the number of S&P 500 companies increasing their dividend payouts:
| COUNT OF DIVIDEND ACTIONS YEAR-TO-DATE | INCREASING THEIR DIVIDEND |
| 2014 YTD | 292 |
| 2013 | 366 |
| 2012 | 333 |
| 2011 | 320 |
| 2010 | 243 |
| 2009 | 151 |
Source: Standard and Poor’s
As I mentioned before, while dividends have more than tripled over the last twenty years, stock prices have gone up even more – appreciating about 4.5x’s (see chart below):
With aging demographics increasing retirement income needs, it comes as no surprise to me that the percentage of S&P 500 companies paying dividends has increased from 71% (351 companies) in 2001 to 84% (423 companies) at the end of Q3 – 2014. Interestingly, all 30 members of the Dow Jones Industrial Average currently pay a dividend. If you broaden out the perspective to all S&P Dow Jones Indices, you will discover the strength of dividends is particularly evident over the last 12 months. During this period, dividends increased by a whopping +27%, or $55 billion.
This trend in increasing dividends can also be seen through the lens of the dividend payout ratio. It is true that over longer timeframes the dividend payout ratio has been coming down (see Dividend Floodgates Widen) because of share buyback tax efficiency. Nevertheless, more recently the dividend payout ratio has drifted upwards to a range of about 32% of profits since 2011 (see chart below):

Source: FactSet
There’s no disputing the benefit of rising stock dividends. Baby Boomers, retirees, and other long-term investors are increasingly reaping the rewards of these dividend gifts that keep on giving.
Other Investing Caffeine articles on dividends:
Dividends: From Sapling to Abundant Fruit Tree
Wade W. Slome, CFA, CFP®
Plan. Invest. Prosper.
DISCLOSURE: Sidoxia Capital Management (SCM) and some of its clients hold positions in certain exchange traded funds (ETFs) including SPY, but at the time of publishing SCM had no direct position in any other security referenced in this article. No information accessed through the Investing Caffeine (IC) website constitutes investment, financial, legal, tax or other advice nor is to be relied on in making an investment or other decision. Please read disclosure language on IC Contact page.
Is the Stock Market Rigged? Yes…In Your Favor

Is the Market Rigged? The short answer is “yes”, but unlike gambling in Las Vegas, investing in the stock market rigs the odds in your favor. How can this be? The market is trading at record highs; the Federal Reserve is artificially inflating stocks with Quantitative easing (QE); there is global turmoil flaring up everywhere; and author Michael Lewis says the stock market is rigged with HFT – High Frequency Traders (see Lewis Sells Flash Boys Snake Oil). I freely admit the headlines have been scary, but scary headlines will always exist. More importantly for investors, they should be more focused on factors like record corporate profits (see Halftime Adjustments); near generationally-low interest rates; and reasonable valuation metrics like the price-earnings (P/E) ratios.
Even if you were to ignore these previously mentioned factors, one can use history as a guide for evidence that stocks are rigged in your favor. In fact, if you look at S&P 500 stock returns from 1928 (before the Great Depression) until today, you will see that stock prices are up +72.1% of the time on average.
If the public won at such a high rate in Las Vegas, the town would be broke and closed, with no sign of pyramids, Eiffel Towers, or 46-story water fountains. There’s a reason Las Vegas casinos collected $23 billion in 2013 – the odds are rigged against the public. Even Shaquille O’Neal would be better served by straying away from Vegas and concentrating on stocks. If Shaq could have improved his 52.7% career free-throw percentage to the 72.1% win rate for stocks, perhaps he would have earned a few more championship rings?
Considering a 72% winning percentage, conceptually a “Buy-and-Hold” strategy sounds pretty compelling. In the current market, I definitely feel this type of strategy could beat most market timing and day trading strategies over time. Even better than this strategy, a “Buy Winners-and-Hold Winners” strategy makes more sense. In other words, when investing, the question shouldn’t revolve around “when” to buy, but rather “what” to buy. At Sidoxia Capital Management we are primarily bottom up investors, so the appreciation potential of any security in our view is largely driven by factors such as valuation, earnings growth, and cash flows. With interest rates near record lows and a scarcity of attractive alternatives, the limited options actually make investing decisions much easier.
Scarcity of Alternatives Makes Investing Easier
U.S. investors moan and complain about our paltry 2.42% yield on the 10-Year Treasury Note, but how appetizing, on a risk-reward basis, does a 2.24% Irish 10-year government bond sound? Yes, this is the same country that needed a $100 billion+ bailout during the financial crisis. Better yet, how does a 1.05% yield or 0.51% yield sound on 10-year government treasury bonds from Germany and Japan, respectively? Moreover, what these minuscule yields don’t factor in is the potentially crippling interest rate risk investors will suffer when (not if) interest rates rise.
Fortunately, Sidoxia’s client portfolios are diversified across a broad range of asset classes. The quantitative results from our proprietary 5,000 SHGR (“Sugar”) security database continue to highlight the significant opportunities in the equities markets, relative to the previously discussed “bubblicious” parts of the fixed income markets. Worth noting, investors need to also remove their myopic blinders centered on U.S. large cap stocks. These companies dominate media channel discussions, however there are no shortage of other great opportunities in the broader investment universe, including such areas as small cap stocks, floating-rate bonds, real estate, commodities, emerging markets, alternative investments, etc.
I don’t mind listening to the bearish equity market calls for stock market collapses due to an inevitable Fed stimulus unwind, mean reverting corporate profit margins, or bubble bursting event in China. Nevertheless, when it comes to investing, there is always something to worry about. While there is always some uncertainty, the best investors love uncertainty because those environments create the most opportunities. Stocks can and eventually will go down, but rather than irresponsibly flailing around in and out of risk-on and risk-off trades to time the market (see Market Timing Treadmill), we will continue to steward our clients’ money into areas where we see the best risk-reward prospects.
For those other investors sitting on the sidelines due to market fears, I commend you for coming to the proper conclusion that stock markets are rigged. Now you just need to understand stocks are rigged for you (not against you)…at least 72% of the time.
Wade W. Slome, CFA, CFP®
Plan. Invest. Prosper.
DISCLOSURE: Sidoxia Capital Management (SCM) and some of its clients hold a range of exchange traded fund positions, but at the time of publishing SCM had no direct position in any other security referenced in this article. No information accessed through the Investing Caffeine (IC) website constitutes investment, financial, legal, tax or other advice nor is to be relied on in making an investment or other decision. Please read disclosure language on IC Contact page.
Shiller CAPE Peaches Smell Like BS

If something sounds like BS, looks like BS, and smells like BS, there’s a good chance you’re probably eyeball-deep in BS. In the investment world, I encounter a lot of very intelligent analysis, but at the same time I also continually step into piles of investment BS. One of those piles of BS I repeatedly step into is the CAPE ratio (Cyclically Adjusted Price-to-Earnings) created by Robert Shiller. For those who are not familiar with Shiller, he is a Nobel Prize winner in economics who won the award in 2013 for his work on the “empirical analysis of asset prices.” Shiller vaulted into fame in large part due to the timing of his book, Irrational Exuberance, which was published during the 2000 technology market peak. He gained additional street-credibility in the mid-2000s when he spoke about the bubble developing in the real estate markets.
What is the CAPE?
Besides being a scapegoat for every bear that has missed the tripling of stock prices in the last five years, the CAPE effectively is a simple 10-year average of the P/E ratio for the S&P 500 index. The logic is simple, like many theories in finance and economics, there often are inherent mean-reverting principles that are accepted as rules-of-thumb. It follows that if the current 10-year CAPE is above the 134-year CAPE average, then stocks are expensive and you should avoid them. On the other hand, if the current CAPE were below the long-term CAPE average, then stocks are cheap and you should buy. Here is a chart of the Shiller CAPE:
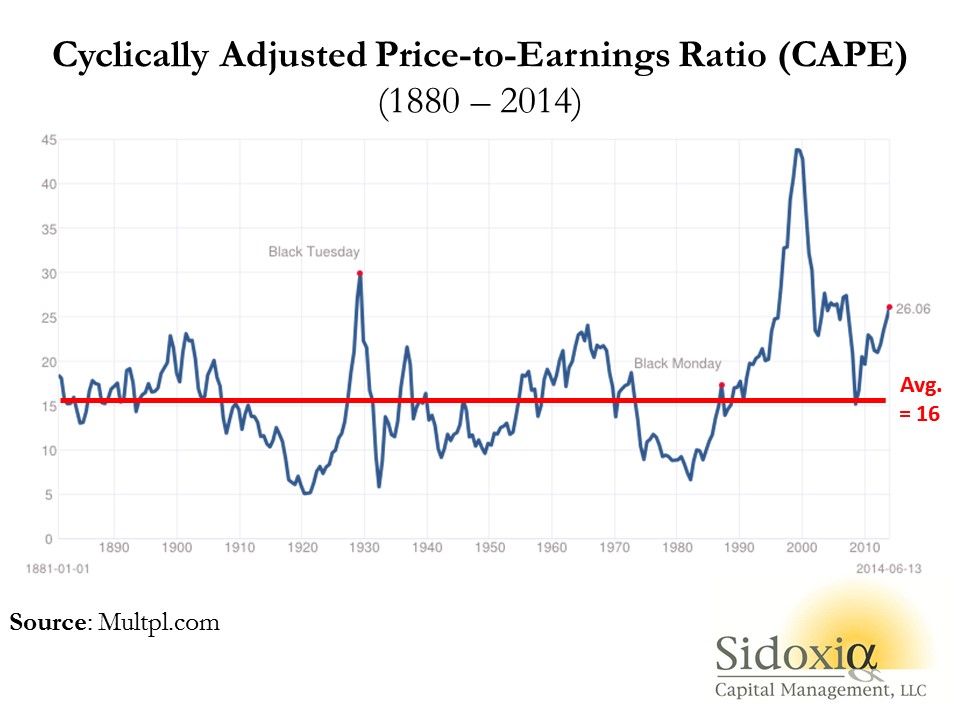
As you can see from the chart above, the current CAPE ratio of 26x is well above the 134-year average of 16x, which according to CAPE disciples makes the stock market very expensive. Or as a recent Business Insider article stated, the Shiller CAPE is “higher than at any point in the 20th century with the exception of the peaks of 1929 and 2000 – you know what happened after those.”
Problems Behind the Broken CAPE Tool
There are many problems with Shiller’s CAPE analysis, but let’s start with the basics by first asking, how useful has this tool actually been over the last, 10, 20, or 30 years? The short answer…not very. For example, if investors followed the implicit recommendation of the CAPE for the periods when Shiller’s model showed stocks as expensive (see above chart 1990 – 2014), they would have missed a more than quintupling (+469% ex-dividends) in the S&P 500 index. Over a shorter timeframe (2009 – 2014) the S&P 500 is up +114% ex-dividends (+190% since March 2009).
Even if you purchased at the worst time at the peak of the stock market in 2000 when the CAPE was 44 (S&P 500 – 1553), an investor would still have earned a total return of about +45% from 2000 – 2014, despite the CAPE still being 63% higher (more expensive) than the 134-year CAPE average of 16.
Peaches for $.25 Post-Bubble?
To illustrate a point, let’s assume you are a peach lover and due to a bubble in peach demand, prices spiked to an elevated level of $2.60 per pound for 9 years, but in year 10 the price plummeted to $.25 per pound today (see chart below). Assuming the 134-year average for peach prices was $1.60 per pound, would you still want to purchase your beloved peaches for the fire sale price of $.25 per pound? Common sense tells you $.25/lb. is a bargain, but if you asked the same question to Robert Shiller, he would say absolutely “NO”! The 10-year Peach CAPE ratio would be $2.37 ([9 yrs X $2.60] + [1 yr X $.25]) #1, but since the 10-year CAPE is greater than the LT-Average peach price of $1.60 per pound #2, Shiller would say peaches are too expensive, even though you could go to Kroger (KR) and buy a pound of peaches today for $0.25 #3.
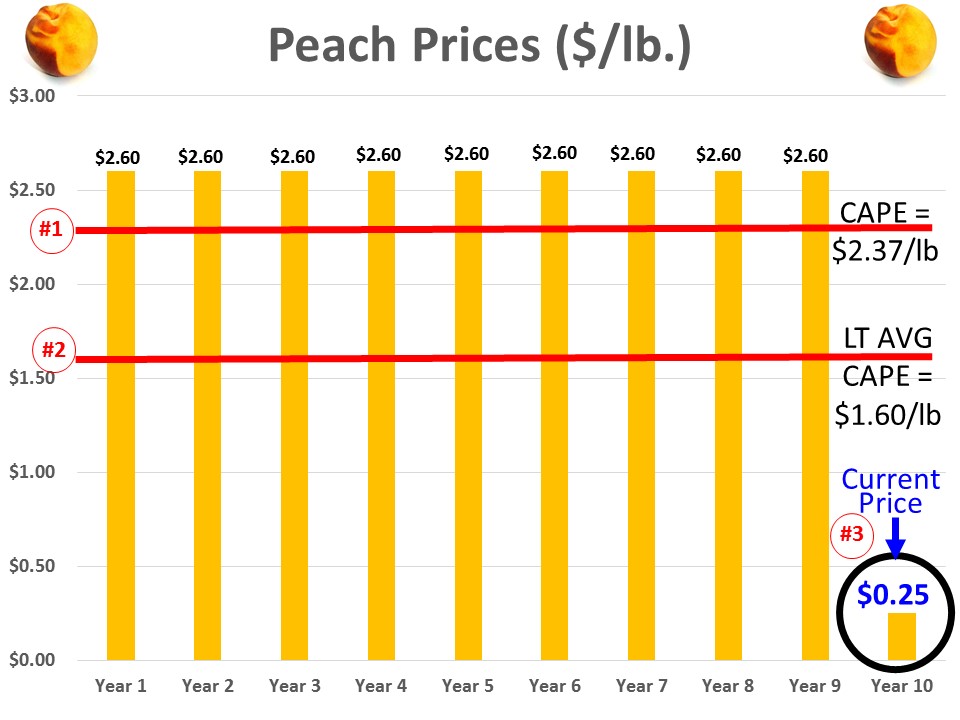
This complete neglect of current market prices in the calculation of CAPE makes absolutely no sense, but this same dynamic of ignoring current pricing reality is happening today in the stock market. Effectively what’s occurring is the higher P/E ratios experienced over the last 10 years are distorting the Shiller CAPE ratio, thereby masking the true current value of stocks. In other words the current CAPE of 26x vastly exaggerates the pricey-ness of the actual S&P 500 P/E ratio of 16x for 2014 and 14x for 2015.
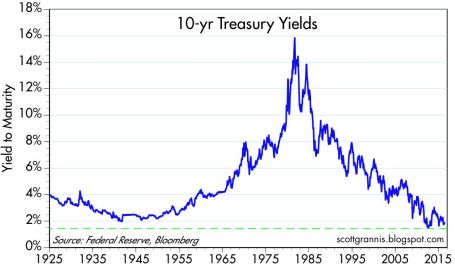
There are plenty of other holes to poke into CAPE, but the last major component of Shiller’s ratio I want to address is interest rates. Even if you disregard my previous negative arguments against Shiller’s CAPE, should anyone be surprised that the ratio troughed in the early 1980s of 7x when long-term interest rates peaked. If I could earn 18% on a CD with little risk in 1981, not many people should be dumbfounded that demand for risky stocks was paltry. Today, the reverse environment is in place – interest rates are near record lows. It should therefore come as no surprise, that all else equal, a higher P/E (and CAPE) is deserved when interest rates are this low. Nevertheless, this discussion of P/E and CAPE rarely integrates the critical factor of interest rates.
While I have spent a decent amount of time trashing the CAPE-BS ratio, I want to give my pal Bob Shiller a fair shake. I can do this by looking into a mirror and admitting there are periods when the CAPE ratio can actually work. Although the CAPE is effectively useless during long, multi-year upward and downward trending markets (think bubbles & depressions), the CAPE makes perfect sense in sideway, trendless markets (see chart below).
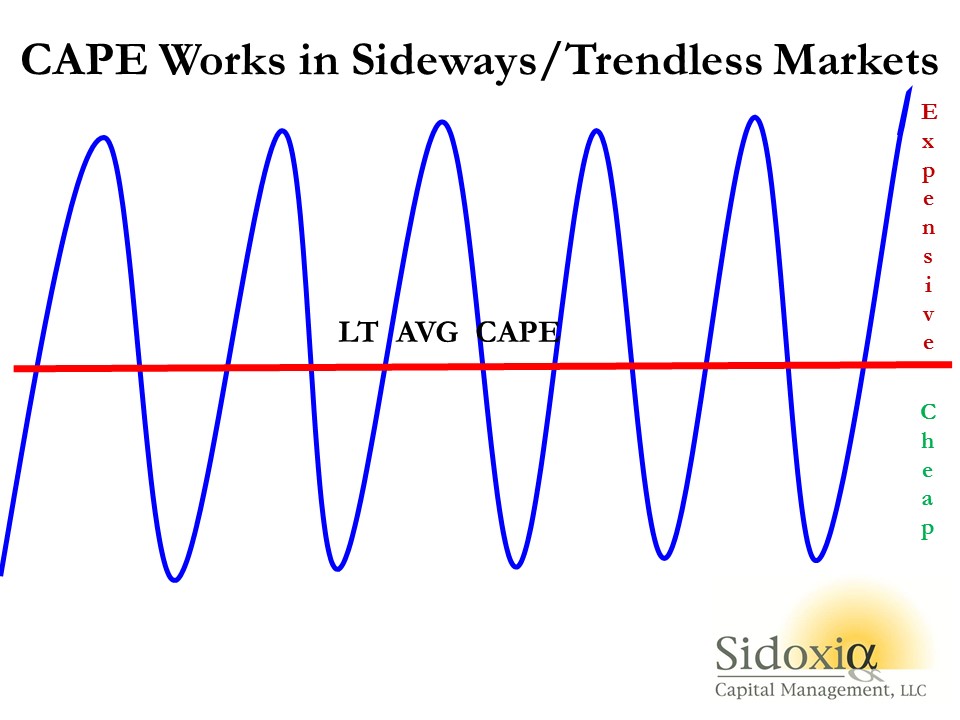
The investing public is always looking for a Holy Grail financial indicator that will magically guide them to riches in both up and down markets. Despite the popularity of Shiller’s CAPE ratio, regrettably no one perfect indicator exists. So before you jump on the bandwagon and chase the hot indicator du jour, make sure to look down and make sure you haven’t stepped in any Shiller CAPE-BS.
Wade W. Slome, CFA, CFP®
Plan. Invest. Prosper.
DISCLOSURE: Sidoxia Capital Management (SCM) and some of its clients hold long positions in certain exchange traded funds, but at the time of publishing SCM had no direct position in KR, or any other security referenced in this article. No information accessed through the Investing Caffeine (IC) website constitutes investment, financial, legal, tax or other advice nor is to be relied on in making an investment or other decision. Please read disclosure language on IC Contact page.
NASDAQ and the R&D-Tech Revolution
It’s been a bumpy start for stocks so far in 2014, but the fact of the matter is the NASDAQ Composite Index is up this year and hit a 14-year high in the latest trading session (highest level since 2000). The same cannot be said for the Dow Jones Industrial and S&P 500 indices, which are both lagging and down for the year. Not only did the NASDAQ outperform the Dow by almost +12% in 2013, but the NASDAQ has also trounced the Dow by over +70% over the last five years.
Is this outperformance a fluke or random coincidence? I’d beg to differ, and we will explore the reasons behind the NASDAQ being treated like the Rodney Dangerfield of indices. Or in other words, why the NASDAQ gets “no respect!” (see also NASDAQ Ugly Step Child).
Compared to the “bubble” days of the nineties, today’s discussions more rationally revolve around profits, cash flows, and valuations. Many of us old crusty veterans remember all the crazy talk of the “New Economy,” “clicks,” and “eyeballs” that took place in the mid-to-late 1990s. Those metrics and hyperbole are used less today, but if NASDAQ’s dominance extends significantly, I’m sure some new and old descriptive euphemisms will float to the conversational surface.
The technology bubble may have burst in 2000, and scarred memories of the -78% collapse in the NASDAQ (5,100 to 1,100) from 2000-2002 have not been forgotten. Despite that carnage, technology has relentlessly advanced through Moore’s Law, while internet connectivity has proliferated in concert with globalization. FedEx’s (FDX) Chief Information Officer Rob Carter summed it up nicely when he noted, “The sound we heard wasn’t the [tech] bubble bursting; it was the big bang.”
Even with the large advance in the NASDAQ index in recent years, valuations of the tech-heavy index remain within reasonable ranges. Accurate gauges of the NASDAQ Composite price-earnings ratio (P/E) are scarce, but just a few months ago, strategist Ned Davis pegged the index P/E at 21, well below the peak of 49 at the end of 1999. For now, the scars and painful memories of the 2000 crash have limited the amount of frothiness, although pockets of it certainly still exist (greed will never be fully eradicated).
Why NASDAQ & Technology Continue to Flourish
Regardless of how one analyzes the stock market, ultimately long-term stock prices follow the direction of profits and cash flows. Profits and cash flows don’t however grow out of thin air. Sustainable growth requires competitiveness. For most industries, a long-term competitive advantage requires a culture of innovation and technology adoption. As you can see from the NASDAQ listed companies BELOW, there is no shortage of innovation.
CLICK TO ENLARGE
Sources: ADVFN, SEC, Other
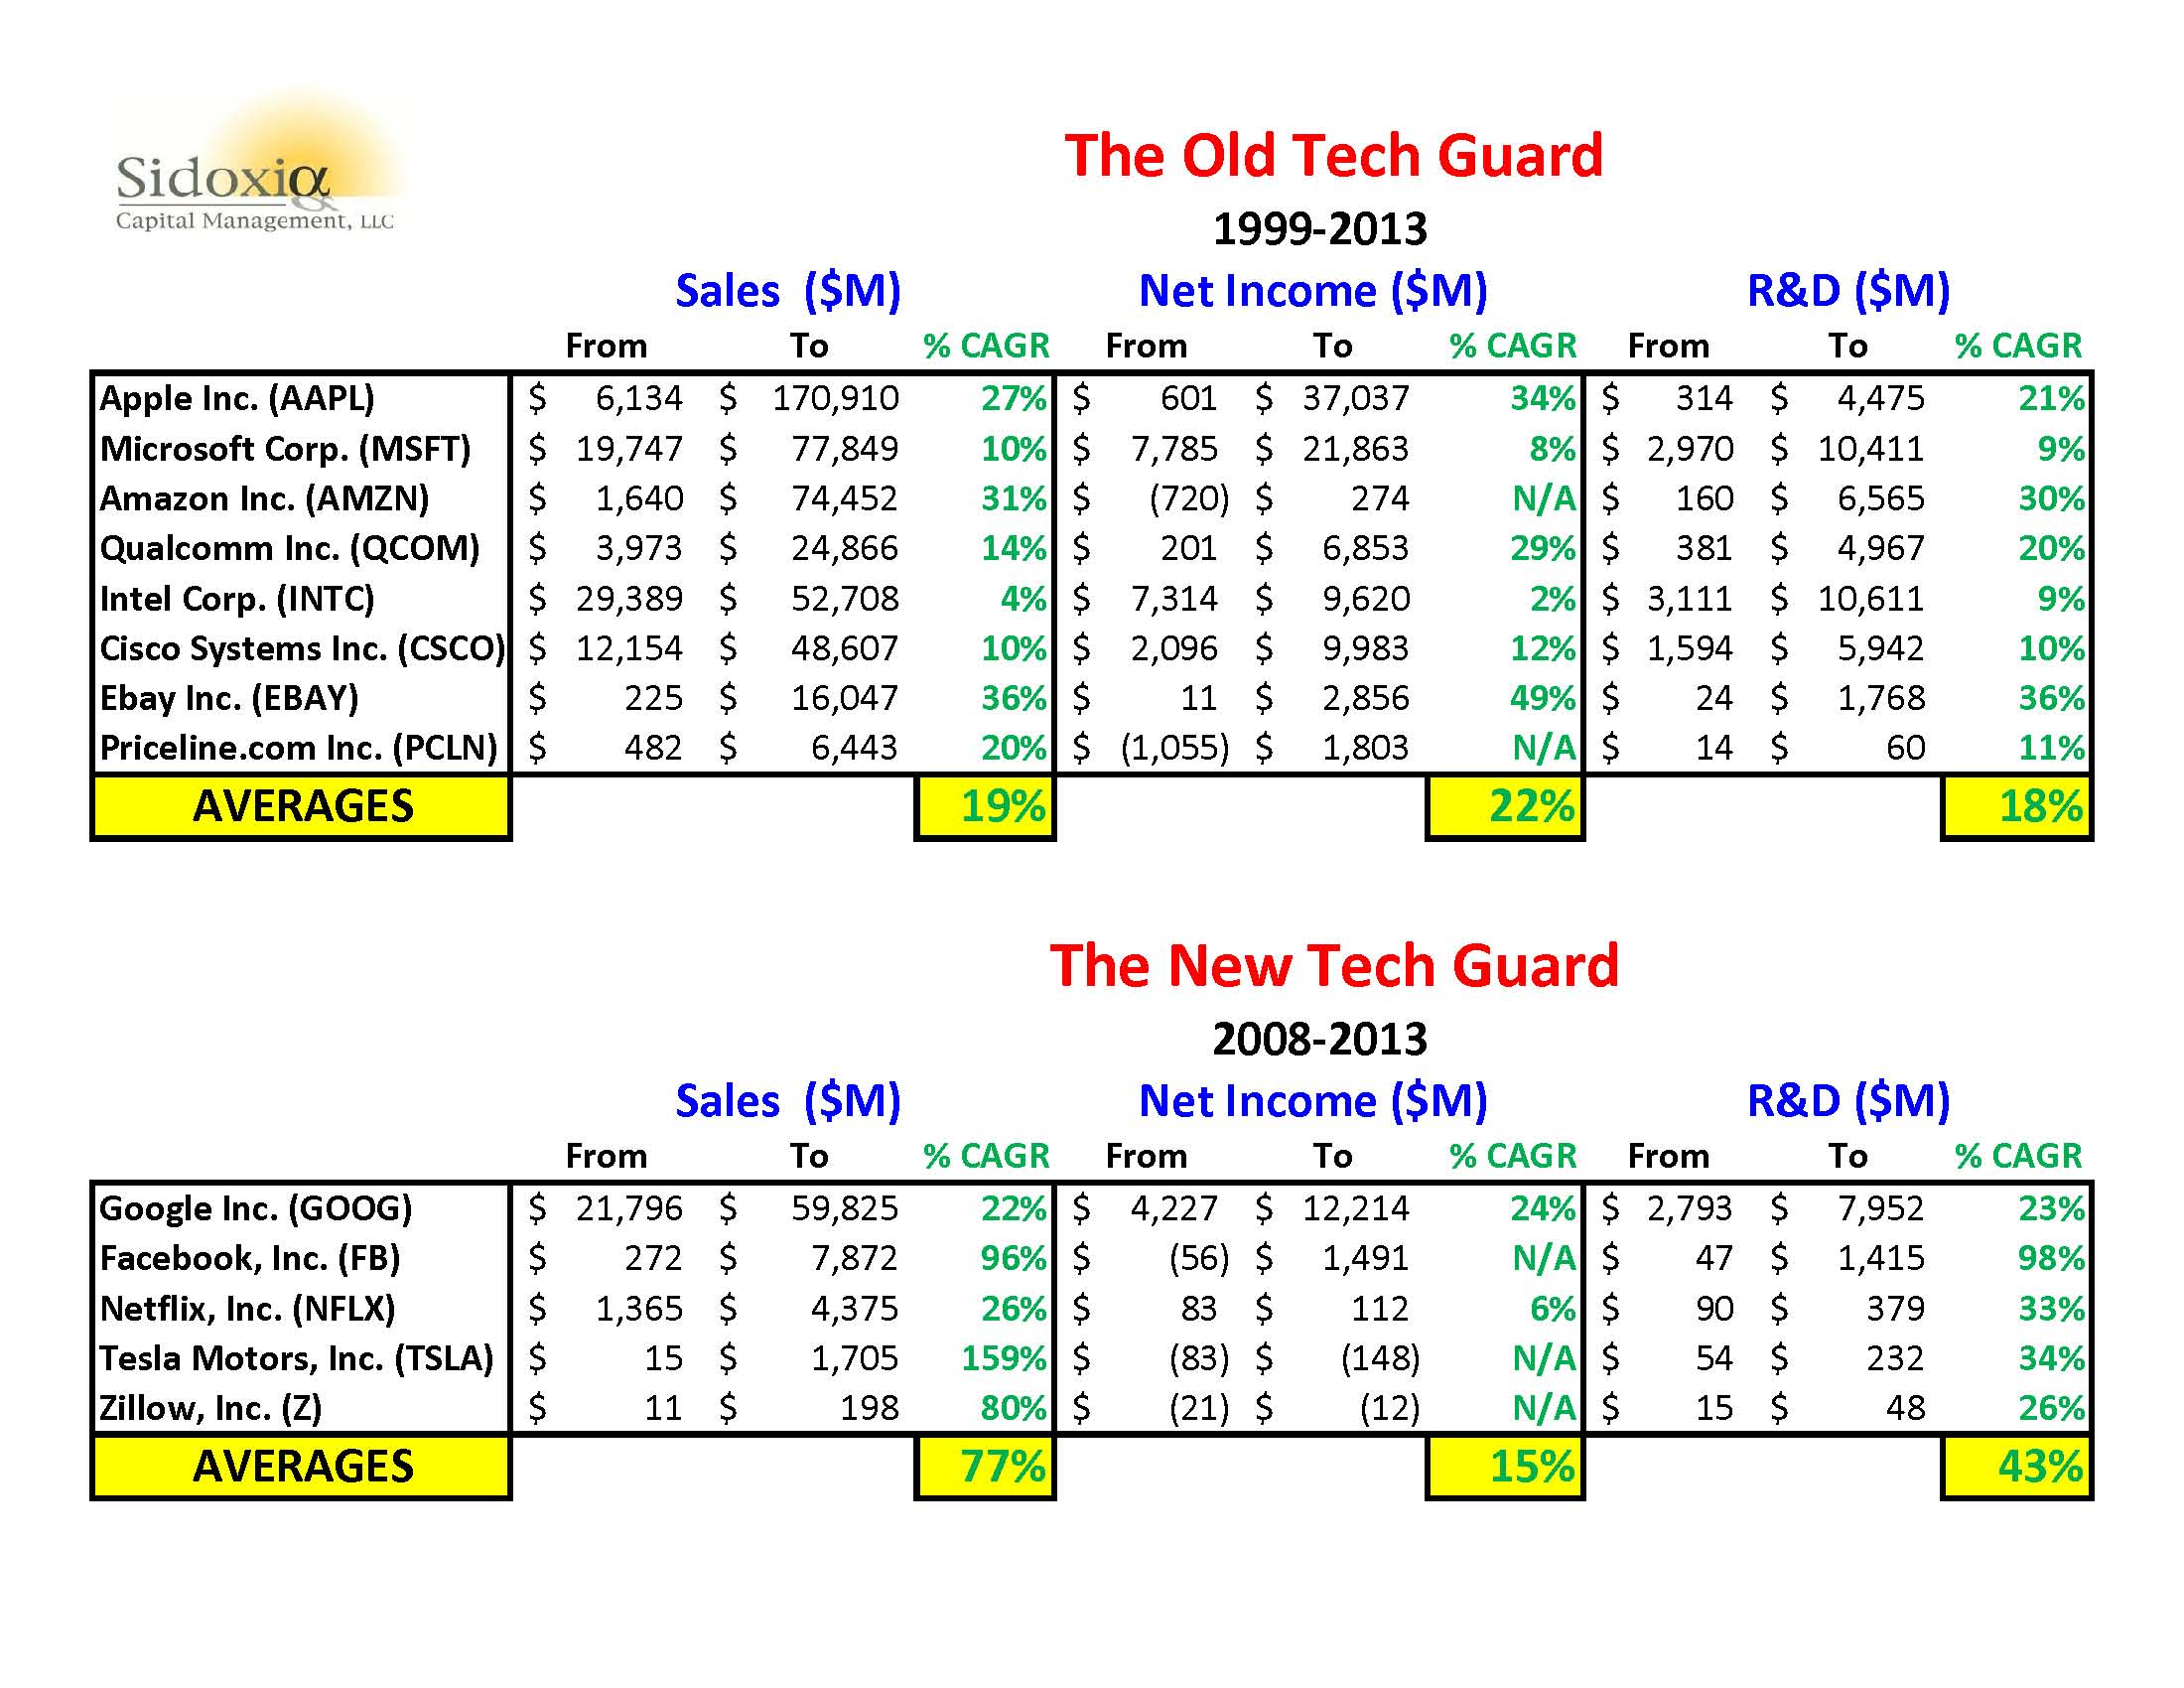
I’ve divided the largest technology companies in the NASDAQ 100 index that survived the bursting of the 2000 technology bubble into “The Old Tech Guard.” This group of eight stocks represents a total market value of about $1.5 trillion – equivalent to almost 10% of our country’s Gross Domestic Product (GDP). Incredibly, this select collection of companies achieved an average sales growth rate of +19%; income growth of +22%; and research & development growth of +18% over a 14-year period (1999-2013).
The second group of younger stocks (a.k.a., The New Tech Guard) that launched their IPOs post-2000 have accomplished equally impressive results. Together, these handful of companies have earned a market value of over $625 billion. There’s a reason investors are gobbling up these stocks. Over the last five years, The New Tech Guard companies have averaged an unbelievable +77% sales growth rate, coupled with a remarkable +43% expansion in average annual R&D expenditures.
Innovation Dead?
Who said innovation is dead? Not me. Combined, these 13 companies (Old Guard + New Guard) are spending about $55,000,000,000 on research and development…annually! If you consider the hundreds and thousands of other technology companies that are also investing aggressively for the future, it should come as no surprise that the pace of innovation is only accelerating.
While newscasters, bloggers, and newspapers will continue to myopically focus on the Dow and S&P 500 indices, do your investment portfolio a favor by not forgetting about the relentless R&D and tech revolution taking place within the innovative and often overlooked NASDAQ index.
Wade W. Slome, CFA, CFP®
Plan. Invest. Prosper.
DISCLOSURE: Sidoxia Capital Management (SCM) and some of its clients hold long positions in certain exchange traded funds (ETFs), AAPL, GOOG, AMZN, FDX, QCOM, and a short position in NFLX, but at the time of publishing SCM had no direct discretionary position in MSFT, INTC, CSCO, EBAY, PCLN, FB, TSLA, Z, or any other security referenced in this article. No information accessed through the Investing Caffeine (IC) website constitutes investment, financial, legal, tax or other advice nor is to be relied on in making an investment or other decision. Please read disclosure language on IC Contact page.
Earnings Coma: Digesting the Gains

Over the last five years, the stock market has been an all-you-can-eat buffet of gains for investors. It has been almost two years since the spring of 2012 when the Arab Spring and potential exit of Greece from the EU caused a -10% correction in the S&P 500 index (see Series of Unfortunate Events). Indigestion of this 10% variety is typically on the menu and ordered at least once per year. With stocks up about +50% over the last two years, performance has tasted sweet. But even binging on your favorite entrée or dessert will eventually lead to a food coma. At that bloated point, a digestion phase is required before another meal of gains can be consumed.
So far investors haven’t been compelled to expel their meals quite yet, but it’s clear to me the rate of appreciation is not sustainable over the long-term. Could the incredible returns continue in the short-run during 2014? Certainly. As I’ve written before, the masses remain skeptical of the recovery/rally and any definitive acceleration in economic growth could spark the powder-keg of skeptics to come join the party (see Here Comes the Dumb Money). If and when that happens, I will be gladly there to systematically ring the register of profits I’ve consumed, by locking in gains and reallocating to less loved areas (i.e., go on a stock diet).
Q4 Appetizers Here, Main Course Not Yet
The 4th quarter earnings appetizers have been served, evidenced by the 50-odd S&P 500 corporations that have reported their financial results, and thus far some Tums may be needed to relieve some heartburn. Although about half of those companies reporting have beat Wall Street estimates, 37% of the group have missed expectations, according to Thomson Reuters. It’s still early in the earnings season, but as of now, the ratio of companies beating Wall Street forecasts is below historical averages.
We can put a little meat on the earnings bone by highlighting the disappointing profit warnings and lackluster results from bellwether companies like United Parcel Service (UPS), Intel Corp (INTC), General Electric (GE), CSX Corp (CSX), and Royal Dutch Shell (RDSA), to name a few. Is it time to panic and run for the restroom (or exits)? Probably not. About 90% of the S&P 500 companies still need to give their Q4 profitability state of the union. What’s more, another reason to not throw in the white towel yet is the global economic environment looks significantly better in areas like Europe, China, and other emerging markets.
Worth remembering, the stock market is a discounting mechanism. The market pays much more attention to the future versus the past. So, even if the early earnings read doesn’t look so great now, the fact that the S&P 500 is down less than -1% off of its all-time, record highs may be an indication of better things ahead.
Recipe for a Pullback?
If earnings continue to drag on in a disappointing fashion, and political brinkmanship materializes surrounding the debt ceiling, it could easily be enough to spark some profit-taking in stocks. While Sidoxia is finding no shortage of opportunities, it has become apparent some speculative pockets of euphoria have developed. Areas like social media and biotech are ripe for corrections.
While the gains over the last few years have been tantalizing, investors must be reminded to not overindulge. Carefully selecting stocks to chew and digest is a better strategy than recklessly binging on everything in the buffet line. There are plenty of healthy areas of the market to choose from, so it’s important to be discriminating…or your portfolio could end up in a coma.
Wade W. Slome, CFA, CFP®
Plan. Invest. Prosper.
DISCLOSURE: Sidoxia Capital Management (SCM) and some of its clients hold positions in certain exchange traded funds (ETFs), but at the time of publishing SCM had no direct position in UPS, INTC, GE, CSX, RDSA, or any other security referenced in this article. No information accessed through the Investing Caffeine (IC) website constitutes investment, financial, legal, tax or other advice nor is to be relied on in making an investment or other decision. Please read disclosure language on IC Contact page.
Take Me Out to the Stock Game

This article is an excerpt from a previously released Sidoxia Capital Management complementary newsletter (October 1, 2013). Subscribe on the right side of the page for the complete text.
The Major League Baseball playoffs are just about to start, and the struggling U.S. economy is also trying to score some more wins to make the postseason as well. In 2008 and early 2009, the stock market looked more like The Bad News Bears with the S&P 500 index losing -58% of its value from the peak to the trough. The overleveraged (debt-laden) financial system, banged by a speculative housing bubble, swung the global economy into recession and put a large part of the economic team onto the disabled list.
Since the lows of 2009, S&P 500 stocks have skyrocketed +152%, including an +18% gain in 2013, and a +3% jump in September alone. With that incredible track record, one might expect a euphoric wave of investors pouring into the stock market stadium, ready to open their wallets at the financial market concession stand. Au contraire. Despite the dramatic winning streak, investors remain complacent skeptics, analyzing and critiquing every political, economic, and financial market movement and gyration.
Unfortunately, as stock prices have scored massive gains, many market followers have been too busy eating peanuts and drinking beer, rather than focusing on the positive economic statistics in the scorebook, such as these:
15/16 Quarters of Positive GDP Growth:
 |
| Source: Crossing Wall Street |
Precipitous Drop in Unemployment Claims: The lowest level since 2007 (7.5 million private sector jobs added since employment trough).
 |
| Source: Bespoke |
All-Time Record Corporate Profits:
 |
| Source: Ed Yardeni |
Financially Healthier Consumer – Lower Debt & Higher Net Worth:
 |
| Source: Scott Grannis |
Improving Housing Market:
 |
| Source: Scott Grannis |
While you can see a lot of financial momentum is propelling Team USA, there are plenty of observers concerned more about potential slumps and injuries emanating from a lineup of uncertainties. Currently, the fair-weather fans who are sitting in the bleachers are more interested in the uncertainty surrounding a government shutdown, debt ceiling negotiations, Syrian unrest, Iranian nuclear discussions, Obamacare defunding, and an imminent tapering of the Federal Reserve’s QE bond purchasing program (see Perception vs. Reality). The fearful skepticism of the fans has manifested itself in the form of a mountain of cash ($7 trillion), which is rapidly eroding to inflation and damaging millions of retirees’ long-term goals (see chart below). The fans sitting in the bleachers are less likely to buy long-term season tickets until some of these issues are settled.
 |
| Source: Scott Grannis – $3 trillion added since crisis. |
The aforementioned list of worries are but a few of the concerns that have investors biting their nails. While there certainly is a possibility the market could be thrown a curve ball by one of these issues, veteran all-star investors understand there are ALWAYS uncertainties, and when the current list of concerns eventually gets resolved or forgotten, you can bet there will be plenty of new knuckle-balls and screw-balls (i.e., new list of worries) to fret over in the coming weeks, months, and years (see Back to the Future I, II,& III). Ultimately, the vast majority of concerns fade away.
Yoooouuuuuu’rrrreee Out!
The politicians in Washington are a lot like umpires, but what our country really needs are umpires who can change and improve the rules, especially the silly, antiquated ones (see also Strangest Baseball Rules). The problem is that bad rules (not good ones) often get put in place so the umpires/politicians can keep their jobs at the expense of the country’s best interest.
When umpires (politicians) cannot agree on how to improve the rules, gridlock actually is the next best outcome (see Who Said Gridlock is Bad?). The fact of the matter is that deficits and debt/GDP ratios have declined dramatically in recent years due in part to bitter political feuds (see chart below). When responsible spending is put into action, good things happen and a stronger economic foundation can be established to cushion future crises.
 |
| Source: Scott Grannis |
There is plenty of room for improvement, but the statistics speak for themselves, which help explain why patient fans/investors have been handsomely rewarded with a homerun over the last four years. October historically has been a volatile month for the stock market, and the looming government shutdown and $16.7 trillion debt ceiling negotiations may contribute to some short-term strike-outs. However, if history proves to be a guide, stocks on average rise +4.26% during the last three months of the year (source: Bespoke), meaning the game may just not be over yet. With plenty of innings remaining for stocks to continue their upward trajectory, I still have ample time to grab my hot dog and malt during the 7th inning stretch.
Wade W. Slome, CFA, CFP®
Plan. Invest. Prosper.
DISCLOSURE: Sidoxia Capital Management (SCM) and some of its clients hold positions in certain exchange traded funds (ETFs), but at the time of publishing, SCM had no direct position in TSLA, PBI, or any other security referenced in this article. No information accessed through the Investing Caffeine (IC) website constitutes investment, financial, legal, tax or other advice nor is the information to be relied on in making an investment or other decision. Please read disclosure language on IC Contact page.
Stocks Take a Breather after Long Sprint

Like a sprinter running a long sprint, the stock market eventually needs to take a breather too, and that’s exactly what investors experienced this week as they witnessed the Dow Jones Industrial Average face its largest drop of 2013 (down -2.2%) – and also the largest weekly slump since 2012. Runners, like financial markets, sooner or later suffer fatigue, and that’s exactly what we’re seeing after a relatively unabated +27% upsurge over the last nine months. Does a -2% hit in one week feel pleasant? Certainly not, but before the next race, the markets need to catch their breath.
By now, investors should not be surprised that pitfalls and injuries are part of the investment racing game – something Olympian Mary Decker Slaney can attest to as a runner (see 1984 Olympic 3000m final against Zola Budd). As I have pointed out in previous articles (Most Hated Bull Market), the almost tripling in stock prices from the 2009 lows has not been a smooth, uninterrupted path-line, but rather investors have endured two corrections averaging -20% and two other drops approximating -10%. Instead of panicking by locking in damaging transaction costs, taxes, and losses, it is better to focus on earnings, cash flows, valuations, and the relative return available in alternative asset classes. With generationally low interest rates occurring over recent periods, the available subset of attractive investment opportunities has narrowed (see Confessions of a Bond Hater), leaving many investing racers to default to stocks.
Recent talk of potential Federal Reserve bond purchase “tapering” has led to a two-year low in bond prices and caused a mini spike in interest rates (10-year Treasury note currently yielding +2.83%). At the margin, this trend makes bonds more attractive (lower prices), but as you can see from the chart below, interest rates are still relatively close to historically low yields. For the time being, this still makes domestic equities an attractive asset class.
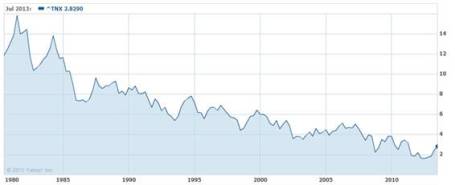
Source: Yahoo! Finance
Price Follows Earnings
The simple but true axiom that stock prices follow earnings over the long-run is just as true today as it was a century ago. Interest rates and price-earnings ratios can also impact stock prices. To illustrate my argument, let’s talk baseball. Wind, rain, and muscle (interest rates, PE ratios, political risk, etc.) are factors impacting the direction of a thrown baseball (stock prices), but gravity is the key factor influencing the ultimate destination of the baseball. Long-term earnings growth is the equivalent factor to gravity when talking about stock prices.
To buttress my point that stock prices following long-term earnings, consider the fact that S&P 500 annualized operating earnings bottomed in 2009 at $39.61. Since that point, annualized earnings through the second quarter of 2013 (~94% of companies reported results) have reached $99.30, up +151%. S&P 500 stock prices bottomed at 666 in 2009, and today the index sits at 1655, +148%. OK, so earnings are up +151% and stock prices are up +148%. Coincidence? Perhaps not.
If we take a closer look at earnings, the deceleration of earnings growth is unmistakable (see Financial Times chart below), yet the S&P 500 index is still up +16% this year, excluding dividends. In reality, predicting multiple expansion or contraction is nearly impossible. For example, earnings in the S&P 500 grew an incredible +15% in 2011, yet stock prices were anemically flat for that year, showing no price appreciation (+0.0%). Since the end of 2011, earnings have risen a meager +3%, however stock prices have catapulted +32%. Is this multiple expansion sustainable? Given stock P/E ratios remain in a reasonable 15-16x range, according to forward and trailing earnings, there is some room for expansion, but the low hanging fruit has been picked and further double-digit price appreciation will require additional earnings growth.
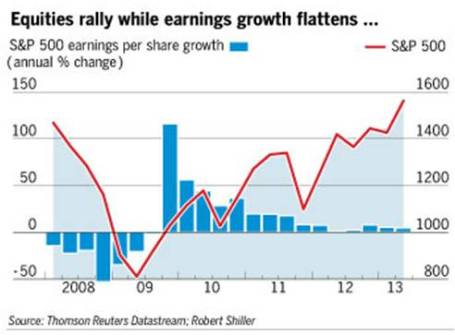
Source: Financial Times
But stocks should not be solely looked through a domestic lens…there is another 95% of the world’s population slowly embracing capitalism and democracy to fuel future dynamic earnings growth. At Sidoxia (www.Sidoxia.com), we are finding plenty of opportunities outside our U.S. borders, including alternative asset classes.
The investment race continues, and taking breathers is part of the competition, especially after long sprints. Rather than panic, enjoy the respite.
Wade W. Slome, CFA, CFP®
Plan. Invest. Prosper.
DISCLOSURE: Sidoxia Capital Management (SCM) and some of its clients hold positions in certain exchange traded funds (ETFs), but at the time of publishing, SCM had no direct position in any other security referenced in this article. No information accessed through the Investing Caffeine (IC) website constitutes investment, financial, legal, tax or other advice nor is to be relied on in making an investment or other decision. Please read disclosure language on IC Contact page.


