Posts tagged ‘Shiller’
Why Buy at Record Highs? Ask the Fat Turkey

This article is an excerpt from a previously released Sidoxia Capital Management complementary newsletter (December 1, 2014). Subscribe on the right side of the page for the complete text.
I’ve fulfilled my American Thanksgiving duty by gorging myself on multiple helpings of turkey, mash potatoes, and pumpkin pie. Now that I have loosened my belt a few notches, I have had time to reflect on the generous servings of stock returns this year (S&P 500 index up +11.9%), on top of the whopping +104.6% gains from previous 5 years (2009-2013).
Conventional wisdom believes the Federal Reserve has artificially inflated the stock market. Given the perceived sky-high record stock prices, many investors are biting their nails in anticipation of an impending crash. The evidence behind the nagging investor skepticism can be found in the near-record low stock ownership statistics; dismal domestic equity fund purchases; and apathetic investor survey data (see Market Champagne Sits on Ice).
Turkey-lovers are in a great position to understand the predicted stock crash expected by many of the naysayers. As you can see from the chart below, the size of turkeys over the last 50+ years has reached a record weight – and therefore record prices per turkey:
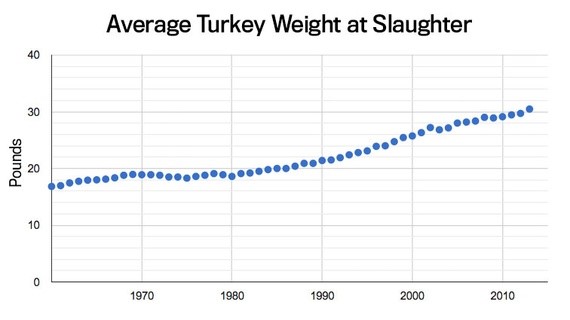
Source: The Atlantic
Does a record size in turkeys mean turkey meat prices are doomed for an imminent price collapse? Absolutely not. A key reason turkey prices have hit record levels is because Thanksgiving stomachs have been buying fatter and fatter turkeys every year. The same phenomenon is happening in the stock market. The reason stock prices have continued to move higher and higher is because profits have grown fatter and fatter every year (see chart below). Profits in corporate America have never been higher. CEOs are sitting on trillions of dollars of cash, and providing stock-investors with growing plump dividends (see also The Gift that Keeps on Giving), $100s of billions in shareholder friendly stock buybacks, while increasingly taking leftover profits to invest in growth initiatives (e.g., technology investments, international expansion, and job hiring).
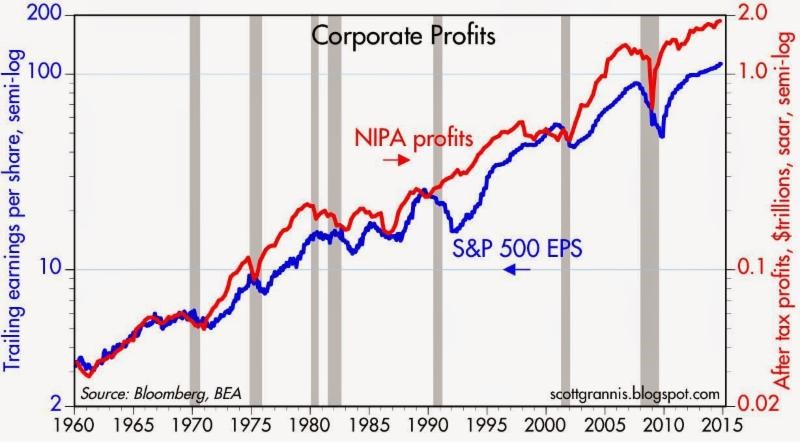
Source: Calafia Beach Pundit
Despite record turkey prices, I will make the bold prediction that hungry Americans will continue to buy turkey. More important than the overall price paid per turkey, the statistic that consumers should be paying more attention to is the turkey price paid per pound. Based on that more relevant metric, the data on turkey prices is less conclusive. In fact, turkey prices are estimated to be -13% cheaper this year on a per pound basis compared to last year ($1.58/lb vs. $1.82/lb).
The equivalent price per pound metric in the stock market is called the Price-Earnings (P/E) ratio, which is the price paid by a stock investor per $1 of profits (or earnings). Today that P/E ratio sits at approximately 17.5x. As you can see from the chart below, the current P/E ratio is reasonably near historical averages experienced over the last 50+ years. While, all else equal, anyone would prefer paying a lower price per pound (or price per $1 in earnings), any objective person looking at the current P/E ratio would have difficulty concluding recent stock prices are in “bubble” territory.
However, investor doubters who have missed the record bull run in stock market prices over the last five years (+210% since early 2009) have clung to a distorted, overpriced measurement called the CAPE or Shiller P/E ratio. Readers of my Investing Caffeine blog or newsletters know why this metric is misleading and inaccurate (see also Shiller CAPE Peaches Smell).
Don’t Be an Ostrich

While prices of stocks arguably remain reasonably priced for many Baby Boomers and retirees, the conclusion should not be to gorge 100% of investment portfolios into stocks. Quite the contrary. Everyone’s situation is unique, and every investor should customize a globally diversified portfolio beyond just stocks, including areas like fixed income, real estate, alternative investments, and commodities. But the exposures don’t stop there, because in order to truly have the diversified shock absorbers in your portfolio necessary for a bumpy long-term ride, investors need exposure to other areas. Such areas should include international and emerging market geographies; a diverse set of styles (e.g., Value, Growth, Blue Chip dividend-payers); and a healthy ownership across small, medium, and large equities. The same principles apply to your bond portfolio. Steps need to be taken to control credit risk and interest rate risk in a globally diversified fashion, while also providing adequate income (yield) in an environment of generationally low interest rates.
While I’ve spent a decent amount of time talking about eating fat turkeys, don’t let your investment portfolio become stuffed. The year-end time period is always a good time, after recovering from a food coma, to proactively review your investments. While most non-vegetarians love eating turkey, don’t be an investment ostrich with your head in the sand – now is the time to take actions into your own hands and make sure your investments are properly allocated.

Wade W. Slome, CFA, CFP®
Plan. Invest. Prosper.
DISCLOSURE: Sidoxia Capital Management (SCM) and some of its clients own a range of positions in certain exchange traded fund positions, but at the time of publishing SCM had no direct position in any other security referenced in this article. No information accessed through the Investing Caffeine (IC) website constitutes investment, financial, legal, tax or other advice nor is to be relied on in making an investment or other decision. Please read disclosure language on IC Contact page.
The Central Bank Dog Ate My Homework

It’s been a painful four years for the bears, including Peter Schiff, Nouriel Roubini, John Mauldin, Jimmy Rogers, and let’s not forget David Rosenberg, among others. Rosenberg was recently on CNBC attempting to clarify his evolving bearish view by explaining how central banks around the globe have eaten his forecasting homework. In other words, Ben Bernanke is getting blamed for launching the stock market into the stratosphere thanks to his quantitative easing magic. According to Rosenberg, and the other world-enders, death and destruction would have prevailed without all the money printing.
In reality, the S&P 500 has climbed over +140% and is setting all-time record highs since the market bottomed in early 2009. Despite the large volume of erroneous predictions by Rosenberg and his bear buddies, that development has not slowed the pace of false forecasts. When you’re wrong, one could simply admit defeat, or one could get creative like Rosenberg and bend the truth. As you can tell from my David Rosenberg article from 2010 (Rams Butting Heads), he has been bearish for years calling for outcomes like a double-dip recession; a return to 11% unemployment; and a collapse in the market. So far, none of those predictions have come to fruition (in fact the S&P is up about +40% from that period, if you include dividends). After being incorrect for so long, Rosenberg has switched his mantra to be bullish on pullbacks on selective dividend-paying stocks. When pushed whether he has turned bullish, here’s what Rosenberg had to say,
“So it’s not about is somebody bearish or is somebody bullish or whether you’re agnostic, it’s really about understanding what the principle driver of this market is…it’s the mother of all liquidity-driven rallies that I’ve seen in my lifetime, and it’s continuing.”
Rosenberg isn’t the only bear blaming central banks for the unexpected rise in equity markets. As mentioned previously, fear and panic have virtually disappeared, but these emotions have matured into skepticism. Record profits, cash balances, and attractive valuations are dismissed as artificial byproducts of a Fed’s monetary Ponzi Scheme. The fact that Japan and other central banks are following Ben Bernanke’s money printing lead only serves to add more fuel to the bears’ proverbial fire.
Speculative bubbles are not easy to identify before-the-fact, however they typically involve a combination of excessive valuations and/or massive amounts of leverage. In hindsight we experienced these dynamics in the technology collapse of the late-1990s (tech companies traded at over 100x’s earnings) and the leverage-induced housing crisis of the mid-2000s ($100s of billions used to speculate on subprime mortgages and real estate).
I’m OK with the argument that there are trillions of dollars being used for speculative buying, but if I understand correctly, the trillions of dollars in global liquidity being injected by central banks across the world is not being used to buy securities in the stock market? Rather, all the artificial, pending-bubble discussions should migrate to the bond market…not the stock market. All credit markets, to some degree, are tied to the trillions of Treasuries and mortgage-backed securities purchased by central banks, yet many pundits (i.e., see El-Erian & Bill Gross) choose to focus on claims of speculative buying in stocks, and not bonds.
While bears point to the Shiller 10 Price-Earnings ratio as evidence of a richly priced stock market, more objective measurements through FactSet (below 10-year average) and Wall Street Journal indicate a forward P/E of around 14. A reasonable figure if you consider the multiples were twice as high in 2000, and interest rates are at a generational low (see also Shiller P/E critique).
The news hasn’t been great, volatility measurements (i.e., VIX) have been signaling complacency, and every man, woman, and child has been waiting for a “pullback” – myself included. The pace of the upward advance we have experienced over the last six months is not sustainable, but when we finally get a price retreat, do not listen to the bears like Rosenberg. Their credibility has been shot, ever since the central bank dog ate their homework.
Wade W. Slome, CFA, CFP®
Plan. Invest. Prosper.
DISCLOSURE: Sidoxia Capital Management (SCM) and some of its clients hold positions in certain exchange traded funds (ETFs) , but at the time of publishing SCM had no direct position in any other security referenced in this article. No information accessed through the Investing Caffeine (IC) website constitutes investment, financial, legal, tax or other advice nor is to be relied on in making an investment or other decision. Please read disclosure language on IC Contact page.
The Rule of 20 Can Make You Plenty

There is an endless debate over whether the equity markets are overvalued or undervalued, and at some point the discussion eventually transitions to what the market’s appropriate P/E (Price-Earnings) level should be. There are several standard definitions used for P/Es, but typically a 12-month trailing earnings, 12-month forward earnings (using earnings forecasts), and multi-year average earnings (e.g., Shiller 10-year inflation adjusted P/E – see Foggy P/E Rearview Mirror) are used in the calculations. Don Hays at Hays Advisory (www.haysadvisory.com) provides an excellent 30+ year view of the historical P/E ratio on a forward basis (see chart below).

Blue Line: Forward PE - Red Line: Implied Equilibrium PE (Hays Advisory)
If you listen to Peter Lynch, investor extraordinaire, his “Rule of 20” states a market equilibrium P/E ratio should equal 20 minus the inflation rate. This rule would imply an equilibrium P/E ratio of approximately 18x times earnings when the current 2011 P/E multiple implies a value slightly above 11x times earnings. The bears may claim victory if the earnings denominator collapses, but if earnings, on the contrary, continue coming in better than expected, then the sun might break through the clouds in the form of significant price appreciation.
Just because prices have been chopped in half, doesn’t mean they can’t go lower. From 1966 – 1982 the Dow Jones Industrial index traded at around 800 and P/E multiples contracted to single digits. That rubber band eventually snapped and the index catapulted 17-fold from about 800 to almost 14,000 in 25 years. Even though equities have struggled at the start of this century, a few things have changed from the market lows of 30 years ago. For starters, we have not hit an inflation rate of 13% or a Federal Funds rate of 20% (~3.5% and 0% today, respectively), so we have some headroom before the single digit P/E apocalypse descends upon us.
Fed Model Implies Equity Throttle
Hays Advisory exhibits another key valuation measurement of the equity market (the so-called “Fed Model”), which compares the Treasury yield of the 10-year Note with the earnings yield of stocks (see chart below).

Blue Line: 10-Yr Treasury - Red Line: Forward PE (Hays Advisory)
Regardless of your perspective, the divergence will eventually take care of it in one of three ways:
1.) Bond prices collapse, and Treasury yields spike up to catch up with equity yields.
2.) Forward earnings collapse (e.g., global recession/depression), and equity yields plummet down to the low Treasury yield levels.
AND/OR
3.) Stock prices catapult higher (lower earnings yield) to converge.
At the end of the day, money goes where it is treated best, and at least today, bonds are expected to treat investors substantially worse than the unfaithful treatment of Demi Moore by Ashton Kutcher. The Super Committee may not have its act together, and Europe is a mess, but the significant earnings yield of the equity markets are factoring in a great deal of pessimism.
The holidays are rapidly approaching. If for some reason the auspice of gifts is looking scarce, then review the Fed Model and Rule of 20, these techniques may make you plenty.
Wade W. Slome, CFA, CFP®
Plan. Invest. Prosper.
DISCLOSURE: Sidoxia Capital Management (SCM) and some of its clients own certain exchange traded funds, but at the time of publishing SCM had no direct position in any other security referenced in this article. No information accessed through the Investing Caffeine (IC) website constitutes investment, financial, legal, tax or other advice nor is to be relied on in making an investment or other decision. Please read disclosure language on IC “Contact” page.
Professional Double-Dip Guesses are “Probably” Wrong

As you may have noticed from previous articles, I take a significant grain (or pound) of salt when listening to economists and strategists like Peter Schiff, Nouriel Roubini, Meredith Whitney, John Mauldin, et.al. Typically, these financial astrologists weave together convincing, elaborate, grand guesses that extrapolate every short-term, fleeting economic data point into an imposing (or magnificent) long-term secular trend.
With all this talk of “double-dip” recession, I cannot help but notice the latest verbal tool implemented by every Tom, Dick, and Harry economist when discussing this topic… the word “probability”. Rather than honestly saying I have no clue on what the economy will do, many strategists place a squishy numerical “probability” around the possibility of a “double-dip” recession consistent with the news du jour. Over recent weeks, unstable U.S. economic data have been coming in softer than expectations. So, guess what? Economists have become more pessimistic about the economy and raised the “probability” of a double dip recession. Thanks Mr. Professor “Obvious!” I’m going to go out on a limb, and say the probability of a double-dip recession will likely go down if economic data improves. Geez…thanks.
Here is a partial list of double-dip “probabilities” spouted out by some well-known and relatively unknown economists:
- Robert Shiller (Professor at Yale University): “The probability of that kind of double-dip is more than 50 percent.”
- Bill Gross (Founder/Managing Director at PIMCO): The New York Times described Gross’s double-dip radar with the following, “He put the probability of a recession — and of an accompanying bout of deflation — at 25 to 35 percent.”
- Mohamed El-Erian (CEO of PIMCO): “If you wonder how meaningful 25 per cent is, ask yourself the following question: if I offered you that I drive you back to work, but there’s a one in four chance that I get into a big accident, would you come with me?”
- David Rosenberg (Chief Economist at Gluskin Chef): In a recent newsletter, Rosenberg has raised the odds of a double-dip recession from 45 per cent a month ago to 67 per cent currently.
- Nouriel Roubini (Professor at New York University): “As early as August 2009 I expressed concern in a Financial Times op-ed about the risk of a double-dip recession, even if my benchmark scenario characterizes the risk of a W as still a low probability event (20% probability) as opposed to a 60% probability for a U-shaped recovery.”
- Robert Reich (Former Secretary of Labor): According to Martin Fridson, Global Credit Strategist at BNP Paribas, Robert Reich has assigned a 50% probability of a double dip, even if Reich believes we are actually in one “Long Dipper.”
- Graeme Leach (Chief Economist at the Institute of Directors): “I would give a 40 per cent probability to what I call ‘one L of a recovery’, in other words a fairly weak flattish cycle over the next 12 months. A double-dip recession would get a 40 per cent probability as well.”
- Ed McKelvey (Sr. U.S. Economist at Goldman Sachs): “We think the probability is unusually high — between 25 percent and 30 percent — but we do not see double dip as the base case.”
- Avery Shenfeld (Chief Economist at CIBC): “The probability estimate is likely more consistent with a slowdown rather than a true double-dip recession but, given the uncertainties, fiscal tightening ahead and the potential for a slow economy to be vulnerable to shocks, we will keep an eye on our new indicator nevertheless.” This guy can’t even be pinned down for a number!
- National Institute for Economic and Social Research (NIESR) : “The probability of seeing a contraction of output in 2011 as compared to 2010 has risen from 14 per cent to 19 per cent.”
- New York Fed Treasury Spread Model (see chart below): Professor Mark J. Perry notes, “For July 2010, the recession probability is only 0.06% and by a year from now in June of next year the recession probability is only slightly higher, at only 0.3137% (less than 1/3 of 1%).”

Listening to these economic armchair quarterbacks predict the direction of the financial markets is as painful as watching Jim Gray’s agonizing hour-long interview of Lebron James’s NBA contract decision (see also Lebron: Buy, Sell, or Hold?). Just what I want to hear – a journalist that probably has never dribbled a ball in his life, inquiring about cutting edge questions like whether Lebron is still biting his nails? Most of these economists are no better than Jim Gray. In many instances these professionals don’t invest in accordance with their recommendations and their probability estimates are about as reliable as an estimate of the volatility index (see chart below) or a prediction about Lindsay Lohan’s legal system status.

I can virtually guarantee you at least one of the previously mentioned economists will be correct on their forecasts. That isn’t much of an achievement, if you consider all the strategists’ guesses effectively cover every and any economic scenario possible. If enough guesses are thrown out there, one is bound to stick. And if they’re wrong, no problem, the economists can simply blame randomness of the lower probability event as the cause of the miscue.
Unlike Wayne Gretzky, who said, “I skate to where the puck is going to be, not where it has been,” economists skate right next to the puck. Because the economic data is constantly changing, this strategy allows every forecaster to constantly change their outlook in lock-step with the current conditions. This phenomenon is like me looking at the dark clouds outside my morning window and predicting a higher probability of rain, or conversely, like me looking at the blue skies outside and predicting a higher chance of sunshine.
Using this “probability” framework is a convenient B.S. means of saving face if a directional guess is wrong. By continually adjusting probability scenarios with the always transforming economic data, the strategist can persistently waffle with the market sentiment vicissitudes.
What would be very refreshing to see is a strategist on CNBC who declares he was dead wrong on his prediction, but acknowledges the world is inherently uncertain and confesses that nobody can predict the market with certainty. Instead, the rent-o-strategists consistently change their predictions in such a manner that it is difficult to measure their accuracy – especially when there is rarely hard numbers to hold these professional guessers accountable for.
Economists and strategists may be well-intentioned people, just as is the schizophrenic trading advice of Jim Cramer of CNBC’s Mad Money, but the “probability” of them being right over relevant investing time horizons is best left to an experienced long-term investor that understands the pitfalls of professional guessing.
Wade W. Slome, CFA, CFP®
Plan. Invest. Prosper.
*DISCLOSURE: Sidoxia Capital Management (SCM) and some of its clients own certain exchange traded funds, but at the time of publishing SCM had no direct position in GS, NYT or any security referenced in this article. No information accessed through the Investing Caffeine (IC) website constitutes investment, financial, legal, tax or other advice nor is to be relied on in making an investment or other decision. Please read disclosure language on IC “Contact” page.


