Posts tagged ‘recession’
Huh… Stocks Reach a Record High?

This article is an excerpt from a previously released Sidoxia Capital Management complimentary newsletter (September 1, 2016). Subscribe on the right side of the page for the complete text.
The stock market hit all-time record highs again in August, but despite the +6.2% move in 2016 S&P 500 stock prices (and +225% since early 2009), investors continue to scratch their heads in confusion. Individuals continue to ask, “Huh, how can stocks be trading at or near record levels (+6% for the year) when Brexit remains a looming overhang, uncertainty surrounds the U.S. presidential election, global terrorist attacks are on the rise, negative interest rates are ruling the day, and central banks around the globe are artificially propping up financial markets (see also Fed Myths vs. Reality)? Does this laundry list of concerns stress you out? If you said “yes”, you are not alone.
As I’ve pointed out in the past, we live in a different world today. In the olden days, terrorist attacks, natural disasters, currency crises, car chases, bank failures, celebrity DUIs, and wars happened all the time. However, before the internet existed, people either never heard about these worries, or they just didn’t care (or both). Today, we live in a Twitter, Facebook, Instagram, Snapchat, society with 500+ cable channels, and supercomputers in the palm of our hands (i.e., smartphones) with more computing power than existed on the Apollo mission to the moon. In short, doom-and-gloom captures human attention and sells advertising, the status quo does not.
- Record corporate profits are on the rise
- Stabilizing value of the dollar
- Stabilizing energy and commodity prices
- Record low interest rates
- Skeptical investing public
Fortunately, the stock market pays more attention to these important dynamics, rather than the F.U.D. (Fear, Uncertainty, Doubt) peddled by the pundits, bloggers, and TV talking heads. Certainly, any or all of the previously mentioned positive factors could change or deteriorate over time, but for the time being, the bulls are winning.
Let’s take a closer look at the influencing components that are driving stock prices higher:
Record Corporate Profits

Source: Yardeni.com
Profits are the mother’s milk that feeds the stock market. During recessions, profits are starved and stock prices decline. On the flip side, economic expansions feed profits and cause share prices to rise. As you can see from the chart above, there was a meteoric rise in corporate income from 2009 – 2014 before a leveling off occurred from 2015 going into 2016. The major headwinds causing profits to flatten was a spike of 25% in the value of the U.S. dollar relative to the value of other global currencies, all within a relatively short time span of about nine months (see chart below).

Why is this large currency shift important? The answer is that approximately 40% of multinational profits derived by S&P 500 companies come from international markets. Therefore, when the value of the dollar rose 25%, the cost to purchase U.S. products and services by foreign buyers became 25% costlier. Selling dramatically higher cost goods abroad squeezed exports, which in turn led to a flattening of profits. Time will tell, but as I showed in the first chart, the slope of the profit line has resumed its upwards trajectory, which helps explain why stock prices have been advancing in recent months.
Besides a strong dollar, another negative factor that temporarily weakened earnings was the dramatic decline in oil prices (see chart below) Two years ago, WTI oil prices were above $100 per barrel. Today, prices are hovering around $45 per barrel. As you can imagine, this tremendous price decline has had a destructive impact on the profits of the energy sector in general. The good news is that after watching prices plummet below $30 earlier this year, prices have since stabilized at higher levels. In other words, the profits headwind has been neutralized, and if global economic growth recovers further, the energy headwind could turn into an energy tailwind.

Record Low Interest Rates
Stocks were not popular during the early 1980s. In fact, the Dow Jones Industrial Average traded at 2,600 in 1980 vs 18,400 today. The economy was much smaller back then, but another significant overhang to lower stock prices was higher interest rates (and inflation). Back in 1980, the Federal Funds target rate set by the Federal Reserve reached a whopping 20.0% versus today the same rate sits at < 0.5%.
Why is this data important? When you can earn a 16.99% yield in a one-year bank CD (see advertisement below), generally there is a much smaller appetite to invest in riskier, more volatile stocks. Another way to think about rates is to equate interest rates to the cost of owning stocks. When interest rates were high, the relative cost to own stocks was also high, so many investors liquidated stocks. It makes perfect sense that stocks in that high interest rate environment of 1980 would be a lot less attractive compared to a relatively safe CD that paid 17% over a 12-month period.

On the other hand, when interest rates are low, the relative cost of owning stocks is low, so it makes sense that stock prices are rising in this environment. Just like profits, interest rates are not static, and they too can change rapidly. But as long as rates remain near record lows, and profits remain healthy, stocks should remain an appealing asset class, especially given the scarcity of strong alternatives.
Skeptical Investing Public
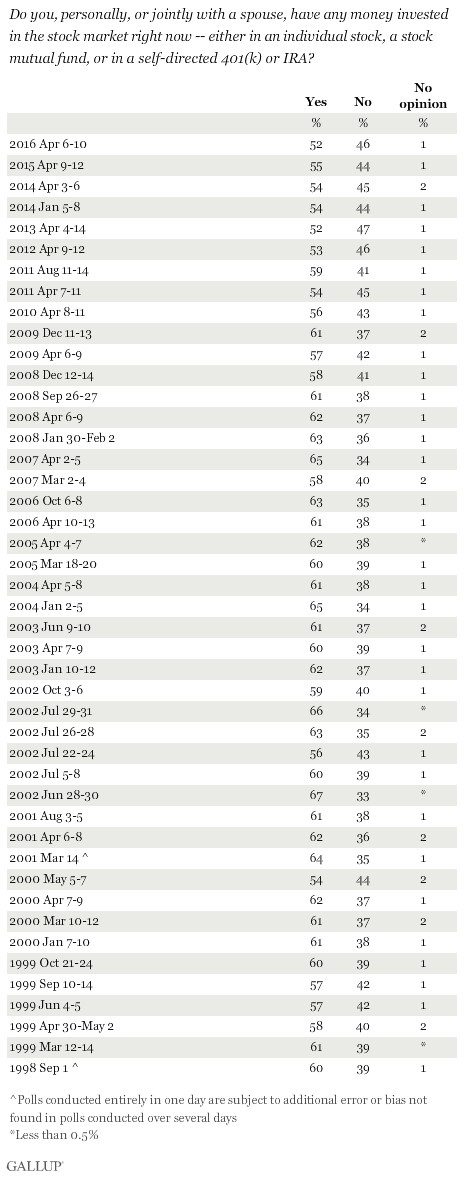
The last piece of the puzzle to examine in order to help explain the head-scratching record stock prices is the pervasive skepticism present in the current stock market. How can Brexit, presidential election, terrorism, negative interest rates, and uncertain Federal Reserve policies be good for stock prices? Investing in many respects can be like navigating through traffic. When everyone wants to drive on the freeway, it becomes congested and a bad option, therefore taking side-streets or detours is a better strategy. The same principle applies to the stock market. When everyone wants to invest in the stock market (like during the late 1990s) or buy housing (mid-2000s), prices are usually too inflated, and shrewd investors decide to choose a different route by selling.
The same holds true in reverse. When nobody is interested in investing (see also, 18-year low in stock ownership and two trillion of stocks sold), then generally that is a strong sign that it is a good time to buy. Currently, skepticism is plentiful, for all the reasons cited above, which is a healthy investment indicator. Many individuals continue reading the ominous headlines and scratching their heads in confusion over today’s record stock prices. In contrast, at Sidoxia, we have opportunistically benefited from investors’ skepticism by discovering plenty of attractive opportunities for our clients. There’s no confusion about that.

Wade W. Slome, CFA, CFP®
Plan. Invest. Prosper.
DISCLOSURE: Sidoxia Capital Management (SCM) and some of its clients hold positions in certain exchange traded funds (ETFs) and FB, but at the time of publishing had no direct position in TWTR or any other security referenced in this article. No information accessed through the Investing Caffeine (IC) website constitutes investment, financial, legal, tax or other advice nor is to be relied on in making an investment or other decision. Please read disclosure language on IC Contact page.
Energizer Market… Keeps Going and Going

This article is an excerpt from a previously released Sidoxia Capital Management complimentary newsletter (May 2, 2016). Subscribe on the right side of the page for the complete text.
Boom, boom, boom…it keeps going…and going…and going…
You’ve seen the commercials: A device operating on inferior batteries dies just as a drum-beating, battery operated Energizer bunny comes speeding and spiraling across the television screen. Onlookers waiting for the battery operated toy to run out of juice, instead gaze in amazement as they watch the energized bunny keep going and going. The same phenomenon is occurring in the stock market, as many observers eagerly await for stock prices to die. The obituary of the stock market has been written many times over the last eight years (see Series of Unfortunate Events). Mark Twain summed up this sentiment well, when after a premature obituary was written about him, he quipped, “The reports of my death are greatly exaggerated.”
With fears abound, stocks added to their annual gains by finishing their third consecutive positive month with the S&P 500 indexes and Dow Jones Industrial Average advancing +0.5% and +0.3%, respectively. Skeptics and worry-warts have been concerned about stocks plummeting ever since the Financial Crisis of 2008-2009. We experienced a 100 year flood then, and as a consequence, scarred investors now expect the 100 year flood to repeat every 100 days (see also 100 Year Flood). Given the damage created in the wake of the “Great Recession,” many individuals have become afraid of their own shadow. The shadows currently scaring investors include the following:
- Negative Interest Rates: The unknown consequences of negative interest rate policies by central banks (see chart below).
- U.S. Monetary Policy: The potential continuation of the Federal Reserve hiking interest rates.
- Sluggish Economic Growth: With a GDP growth figure up only +0.5% during the first quarter many people are worried about the vulnerability of slipping into recession.
- Brexit Fears: Risk of Britain exiting the European Union (a.k.a. “Brexit”) will blanket the airwaves as the referendum approaches next month
For these reasons, and others, the U.S. central bank is likely to remain accommodative in its stance (i.e., Fed Chairwoman Janet Yellen is expected to be slow in hitting the economic brakes via interest rate hikes).
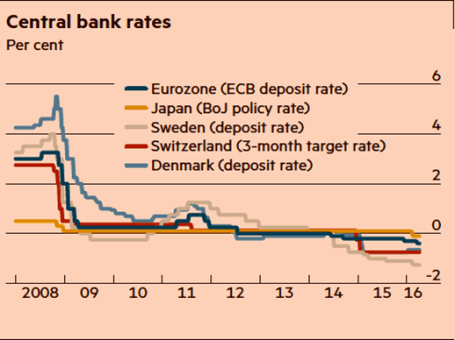
Source: Financial Times. Central banks continue with attempts to stimulate with zero/negative rates.
Climbing the Wall of Worry
Despite all these concerns, stock prices continue climbing the proverbial “wall of worry” while approaching record levels. As famed investor Sir John Templeton stated on multiple occasions, “Bull markets are born on pessimism, and they grow on skepticism, mature on optimism, and die on euphoria.” It’s obvious to me there currently is no euphoria in the overall market, if you consider investors have withdrawn $2 trillion in stock investments since 2007. The phenomenon of stocks moving higher in the face of bad news is nothing new. A recent study conducted by the Financial Times newspaper shows the current buoyant bull market entering the second longest advancing period since World War II (see chart below).
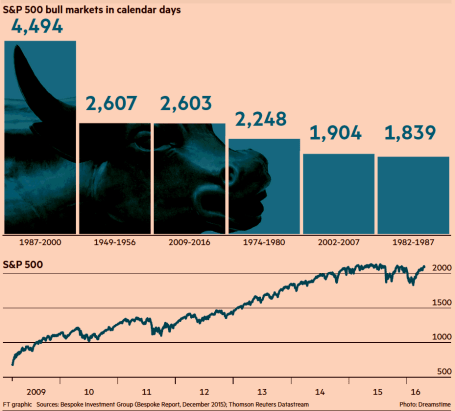
Source: Financial Times
There will never be a shortage of concerns or bad things occurring in a world of 7.4 billion people, but the Energizer bunny U.S. economy has proven resilient. Our economy is entering its seventh consecutive year of expansion, and as I recently pointed out the job market keeps plodding along in the right direction – unemployment claims are at a 43-year low (see Spring Has Sprung). Over the last few years, these job gains have come despite corporate profits being challenged by the headwinds of a stronger U.S. dollar (hurts our country’s exports) and tumbling energy profits. Fortunately, the negative factors of the dollar and oil prices have stabilized lately, and these dynamics are in the process of shifting into tailwinds for company earnings. The -5.7% year-to-date decline in the Dollar Index coupled with the recent rebound in oil prices are proof that the economic laws of supply-demand eventually respond to large currency and commodity swings. With the number of rigs drilling for oil down by approximately -80% over the last two years, it comes as no surprise to me that a drop in oil supply has steadied prices.
The volatility in oil prices has been amazing. Energy companies have been reeling as oil prices dropped -76% from a 2014-high of $108 per barrel to a 2016-low of $26 per barrel. Since then, the picture has improved significantly. Crude oil prices are now hovering around $46 per barrel, up +76%.
Energy Bankruptcy & Recessionary Fears Abate
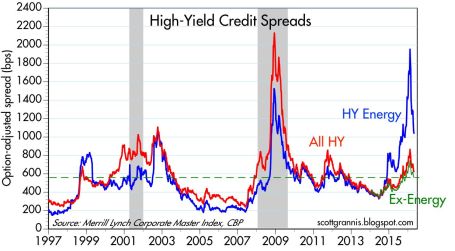
If you take a look at the borrowing costs of high-yield companies in the chart below (Calafia Beach Pundit), you can see that prior spikes in the red line (all high-yield borrowing costs) were correlated with recessions – represented by the gray periods occurring in 2001 and 2008-09. During 2016, you can see from the soaring blue line, investors were factoring in a recession for high-yield energy companies (until the oil price recovery), but the non-energy companies (red-green lines) were not anticipating a recession for the other sectors of the economy. Bottom-line, this chart is telling you the knee-jerk panic of recessionary fears during the January-February period of this year has quickly abated, which helps explain the sharp rebound in stock prices.
After a jittery start to 2016 when economic expectations were for a dying halt, investors have watched stocks recharge their batteries in March and April. There are bound to be more fits and starts in the future, as there always are, but for the time being this Energizer bunny stock market and economy keeps going…and going…and going…
Wade W. Slome, CFA, CFP®
Plan. Invest. Prosper.
DISCLOSURE: Sidoxia Capital Management (SCM) and some of its clients hold positions in certain exchange traded funds (ETFs), but at the time of publishing had no direct position in any other security referenced in this article. No information accessed through the Investing Caffeine (IC) website constitutes investment, financial, legal, tax or other advice nor is to be relied on in making an investment or other decision. Please read disclosure language on IC Contact page.
Dolphin or Shark…Time for Concern?

This article is an excerpt from a previously released Sidoxia Capital Management complimentary newsletter (March 1, 2016). Subscribe on the right side of the page for the complete text.
Through the choppy stock market waters of February, investors nervously tried to stay afloat as they noticed a fin cutting through the water. The only problem is determining whether the fin approaching is coming from a harmless dolphin or a ferocious shark? The volatility in 2016 has been disconcerting for many, but a life preserver was provided during the month with the Dow Jones Industrial Average up a modest 50 points (+0.30%).
Remaining calm can be challenging when facing a countless number of ever-changing concerns. Stock investors have caught lots of fish since early 2009 (prices have about tripled), but here are some of the scary headlines (fins) floating out in the financial markets:
- Recession? Overall corporate profits have slowed in the face of plummeting energy prices and the headwind of a strong dollar. However, corporate profit margins remain near record levels and if you exclude the decline in the troubled oil patch, core profits keep chugging along. If an imminent recession were actually on the horizon, you wouldn’t expect to see a 4.9% unemployment rate (8-year low); record auto sales; an improving housing market; and stimulative national gasoline prices at $1.75/gallon (recent recessions have been caused by high energy prices).
- Negative Interest Rates: Would you like to get paid to borrow money? With $6 trillion dollars of negative interest rate bonds in the market (see chart below), that’s exactly what is happening. Just imagine walking into your local Best Buy, and asking the salesman, “Can I borrow $2,000 to buy that big screen TV there…and oh by the way, can you pay me interest every month after you give me the money?” Scary to think many people are panicked over the stock market when they should be more alarmed over negative interest rates. Would you rather earn 6.4% on the average stock (S&P 500 earnings yield) and a 2.2% dividend yield vs negative interest rate bonds? As I always caution investors, even though interest rates are at/near a generational low, diversified portfolios still need exposure to bonds, even if you’re at/near retirement because of the stability they provide. Bonds act like expensive pillows – they are necessary to sleep at night. Although some observers point to negative rates as a sign of a global collapse, low inflation, aggressive foreign central bank monetary policies, and a lingering risk aversion hangover from the 2008-09 financial crisis probably have more to do with the current strange status of interest rates.

Source: Financial Times
- Political Turbulence: Uncertainty abounds in another election year, just as is the case every other four years. As we head into Super Tuesday, the day in the presidential primary season when the largest number of states hold primary elections, the Republicans are set to battle for approximately half of the delegates necessary to secure the party nomination. The Democrats will be competing for about one-third of the delegates. While many individuals are placing paramount importance on the outcomes of the presidential elections, history teaches us otherwise. The ultimate person elected as president will certainly have a significant impact on the direction of the country, but there are other contributing factors as important (or more important) to economic growth, including the Federal Reserve, and the two houses of Congress. On numerous occasions, I have pointed out the irrelevance of presidential politics (see also Who Said Gridlock is Bad?). As the chart shows below, the past confirms there is no consistency to stock market performance based on political party affiliations. Stocks have performed strongly (and poorly) under both party affiliations.

- Brexit? After lengthy negotiations with EU leaders in Brussels, Britain’s Prime Minister David Cameron set June 23rd as the referendum date for voters to determine whether Britain stays in the European Union. Opinions remain divided (see chart below), but we have seen this movie before with Greece’s threat to leave the EU. As we experienced with the Greece exit (“Grexit”) drama, calmer heads are likely to prevail again. Nevertheless, until the end of June, regrettably we will be forced to listen to continued Brexit fears (see also Brexit article in the Economist for a more thorough review).

- Collapsing Oil Prices: The violent decline in oil prices over the last few years has been swift from about $100/barrel to $34/barrel today. However, the economic slowdown in China, coupled with a stronger U.S. dollar, has led to a broad downfall in commodity prices over the last five years as well. As much as declining demand has hurt commodities and been stimulative for buyers, over-building and excess supply has pressured prices equally. Fortunately, there are signs commodity prices could be in the process of bottoming (see CRB Index).
Financial market volatility in early 2016 has frayed some nerves, and the appearance of swirling fins has many investors wondering whether now’s the time to swim for shore or remain calm and catch the next growth wave. Despite the concerns over a potential recession, negative interest rates, bitter politics, Brexit fears, and depressed oil prices, our economy keeps slowly-but-surely powering forward. While U.S. corporations have been negatively impacted by a strong currency, compressed banking profits (i.e., lower interest rates), and a weak energy sector, S&P 500 companies are rewarding investors by returning a record $1 trillion in dividends and share buybacks (up from $500 million in 2005). When swimming in the current financial markets, you will be better served by swimming with the harmless dolphins rather than panicking over imaginary sharks.
Wade W. Slome, CFA, CFP®
Plan. Invest. Prosper.
DISCLOSURE: Sidoxia Capital Management (SCM) and some of its clients hold positions in certain exchange traded funds (ETFs), but at the time of publishing had no direct position in BBY or any other security referenced in this article. No information accessed through the Investing Caffeine (IC) website constitutes investment, financial, legal, tax or other advice nor is to be relied on in making an investment or other decision. Please read disclosure language on IC Contact page.
Shoot Now, Ask Later
![940614_83408820[1]](https://investingcaffeine.com/wp-content/uploads/2011/08/940614_834088201.jpg?w=311&h=230)
Since the start of 2016, investor sentiment has led to a shoot now, ask questions later mentality. In the court of economic justice, all stocks have been convicted guilty of recession despite the evidence and defense that proves the economy innocent. Even the Federal Reserve Chair Janet Yellen did not prove to be a great public defender of the economy with her comments that negative interest rates are on the table.
With large cap stocks down -13% and small cap stocks losing -25% from 2015, there are a mixture of indicators suggesting a looming recession could be coming. For example, banking stocks, the beating heart of the U.S. economy, saw prices collapse almost -30% from the 2015 highs this week. As CNBC pointed out, “American Airlines (AAL), United Continental (UAL), General Motors (GM) and Ford (F) all sell for five times 2016 earnings” – about a 70% discount to the average S&P 500 stock. As a group, these economically sensitive cyclical stocks grew earnings per share greater than 50%, while their stock prices are down by more than -30% from their 52-week highs. In general, the cyclicals are serving jail time, even though growth has been gangbusters and the current valuations massively discounted.
On the flip side, defensive stocks with little-to-no revenue growth like “Campbell Soup (CPB) trade at 20 times earnings, Kimberly-Clark (KMB) is at 21 times earnings, Procter & Gamble (PG) is at 22 times earnings and Clorox (CLX) is at 25 times earnings. All of these stocks are near 52-week highs.”
Confused? Well, if we are indeed going into recession, than this valuation dichotomy between cyclicals and staples makes sense. Stocks can be a leading indicator (i.e., predictor) of future recessions, but as the famed Nobel Prize winner in economics Paul Samuelson noted, “The stock market has forecast nine of the last five recessions.”
On the other hand, if this current correction is a false recession scare, then now would be a tremendous buying opportunity. In fact, over the last five years, there have been plenty of tremendous buying opportunities for those courageous long-term investors willing to put capital to work during these panic periods (see also Groundhog Day All Over Again):
- 2011: Debt Downgrade/Debt Ceiling Debate/European PIIGS Crisis (-22% correction)
- 2012:Arab Spring/Greek “Gr-Exit” Fears (-11% correction)
- 2013: Fed Taper Tantrum (-8% correction)
- 2014: Ebola Outbreak (-10% correction)
- 2015: China Slowdown Fears (-13% correction in August)
- 2016 (1st Six Weeks): Strong Dollar, Collapsing Oil, interest Rate Hikes/Negative Rates, Weakening China (-15% correction)
- 2016 (Next 46 Weeks): ??????????
Today’s threats rearing their ugly heads have definite recession credibility, but if you think about the strong dollar, collapsing oil prices, Fed monetary policies, weakening Chinese economy, and negative global interest rates, all of these threats existed well before stock prices nose-dived during the last six weeks. If the economic court is judging the current data for potential recession evidence, making a case and proving the economy guilty is challenging. It’s tough to find a recession when we witness a low unemployment rate (4.9%); record corporate profits (ex-energy); record car sales (17.5 million); an improving housing market; a positively sloped yield curve; healthy banking and consumer balance sheets; sub-$2/gallon gasoline; and a flattening U.S. dollar, among other factors.
Could stock prices be clairvoyantly predicting Armageddon? Sure, anything is possible…but this scenario is unlikely now. Even if the U.S. economy is headed towards a recession, the -20% plunge in stock prices is already factoring in most, if not all, of a mild-to-moderate recession. If the economic data does actually get worse, there is still room for stock prices to go down. Under a recession scenario, the tremendous buying opportunities will only get better. While weak hands may be shooting (selling) first and asking questions later, now is the time for you to use patience and discipline. These characteristics will serve as bullet proof vest for your investment portfolio and lead to economic justice over the long-term.
Wade W. Slome, CFA, CFP®
Plan. Invest. Prosper.
DISCLOSURE: Sidoxia Capital Management (SCM) and some of its clients hold positions in certain exchange traded funds (ETFs) and non-discretionary positions in PG, and KMB, but at the time of publishing had no direct position in AAL, CLX, CPB, F, GM, UAL, or any other security referenced in this article. No information accessed through the Investing Caffeine (IC) website constitutes investment, financial, legal, tax or other advice nor is to be relied on in making an investment or other decision. Please read disclosure language on IC Contact page.
Have Peripheral Colds Caused a U.S. Recession Flu?

At the trough of the recent correction, which was underscored by a brief but sharp -1,100 point drop in the Dow Jones Industrial Average, the Dow had temporarily corrected by -16.2% from its peak in May, earlier this year. Whether we retest or break below the 15,370 level again is debatable, but with the Dow almost reaching “bear market” (-20%) territory, it begs the question of whether the U.S. has caught a recessionary flu from the ill international markets’ colds?
Certainly, several factors have investors concerned about a potential recession, including the following: slowing growth and financial market instability in China; contraction of -0.4% in Japan’s Q2 GDP growth; and turmoil in emerging markets like Russia and Brazil. With stock prices down more than double digits, it appears investors factored in a significant chance of a recession occurring. Although the Tech Bubble of 2000 and generational Great Recession of 2008-2009 were no ordinary recessions, your more garden variety recessions like the 1980 and 1990 recessions resulted in peak to trough declines in the Dow Jones Industrial Average of -20.5% and -22.5%, respectively.
In other words, with the Dow recently down -16.2% in three months, investors were awfully close to factoring in a full blown U.S. recession. Should this be the case? In answering this question, one must certainly understand the stock market is a predicting or discounting mechanism. However, if we pull out our economic thermometers, right now there are no definitive indicators sending us to the recessionary doctor’s office. Here are a number of the indicators to review.
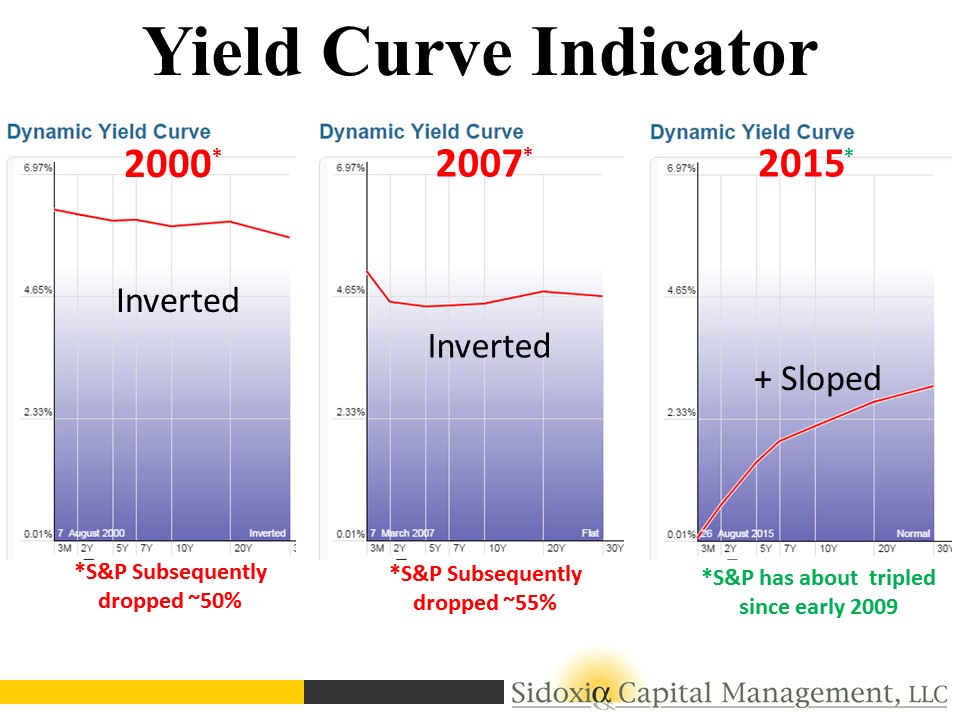
Yield Curve Indicator
For starters, let’s take a look at the yield curve. Traditionally, in a normally expanding economy, we would normally expect inflationary expectations and a term premium for holding longer maturity bonds to equate to a positively shaped yield curve (e.g., shorter term 2-Year Treasuries with interest rates lower than 30-Year Treasuries). Interestingly, historically an inverted yield curve (shorter term interest rates are higher than longer term rates) has been an excellent leading indicator and warning signal for unhealthy stock market conditions forthcoming.
As you can see in the charts below, before the two preceding recessions, in the years 2000 and 2007, we experienced an inverted yield curve that served as a tremendous warning signal in advance of significant downdrafts in stock prices. If you fast forward to today, the slope of the yield curve is fairly steeply sloped – nowhere close to inverted. When the yield curve flattens meaningfully, I will become much more cautious.
The Oil Price Indicator
There is substantial interest and focus on the recessionary conditions in the energy sector, and more specifically the high yield (junk bond) issuers that could suffer. It is true that high yield energy credit spreads have widened, but typically this sector’s pain has been the economy’s gain, and vice versa. The chart below shows that the gray shaded recessionary time periods have classically been preceded by spikes upward in oil prices. As you know, we currently are experiencing the opposite trend. Over the last 12 months, WTI oil prices have been chopped by more than half to $45 per barrel. This is effectively a massive tax for consumers, which should help support the economy.
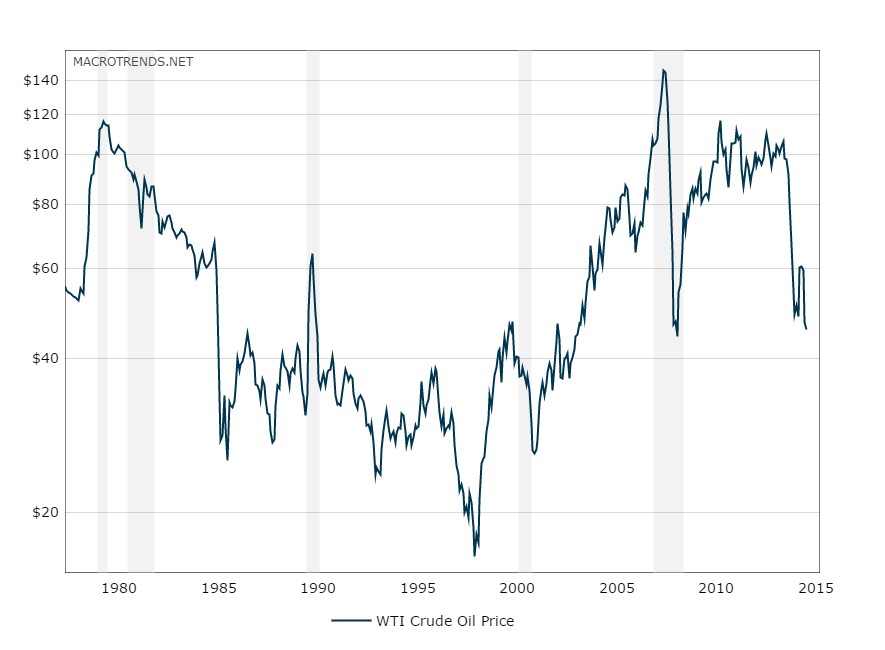
Source: MacroTrends.Net
Other Macro Statistics
Toward the top of any recession-causing, fear factor list right now is China. Slowing economic growth and an unstable Shanghai stock market has investors nervously biting their nails. Although China is the 2nd largest global economy behind the U.S., China still only accounts for about 15% of overall global economic activity, and U.S. exports to the region only account for about 0.7% of our GDP, according to veteran Value investor Bill Nygren. If on top of the China concern you layer a fairly strong U.S. labor market, an improving housing market (albeit slowly), and a recently revised higher GDP statistics, you could probably agree the economic dashboard is not signaling bright red flashing lights.
There is never a shortage of concerns to worry about, including most recently the slowing growth and stock market turbulence in China. While volatility may be implying sickness and international markets may be reaching for the Kleenex box, the yield curve, oil prices, and other macroeconomic indicators are signaling the outlook for U.S. stock remains relatively healthy.

Wade W. Slome, CFA, CFP®
Plan. Invest. Prosper.
DISCLOSURE: Sidoxia Capital Management (SCM) and some of its clients hold positions in certain exchange traded funds (ETFs) , but at the time of publishing, SCM had no direct position in any other security referenced in this article. No information accessed through the Investing Caffeine (IC) website constitutes investment, financial, legal, tax or other advice nor is to be relied on in making an investment or other decision. Please read disclosure language on IC Contact page.
Scrapes on the Sidewalk

Baron Rothschild, an 18th century British nobleman and member of the Rothschild banking family, is credited with the investment advice to “buy when there’s blood in the streets.” Well, with the Russell 2000 correcting about -14% and the S&P 500 -8% from their 2014 highs, you may not be witnessing drenched, bloody streets, but you could say there has been some “scrapes on the sidewalk.”
Although the Volatility Index (VIX – a.k.a., “Fear Gauge”) reached the highest level since 2011 last week (31.06), the S&P 500 index still hasn’t hit the proverbial “correction” level yet. Even with some blood being shed, the clock is still running since the last -10% correction experienced during the summer of 2011 when the Arab Spring sprung and fears of a Greek exit from the EU was blanketing the airwaves. If investors follow the effective 5-year investment playbook, this recent market dip, like previous ones, should be purchased. Following this “buy-the-dip” mentality since the lows experienced in 2011 would have resulted in stock advancing about +75% in three years.
If you have a more pessimistic view of the equity markets and you think Ebola and European economic weakness will lead to a U.S. recession, then history would indicate investors have suffered about 50% of the pain. Your ordinary, garden-variety recession has historically resulted in about a -20% hit to stock prices. However, if you’re in the camp that we’re headed into another debilitating “Great Recession” as we experienced in 2008-2009, then you should brace for more pain and grab some syringes of Novocaine.
If you’re seriously considering some of these downside scenarios, wouldn’t it make sense to analyze objective data to bolster evidence of an impending recession? If the U.S. truly was on the verge of recession, wouldn’t the following dynamics likely be in place?
- Two quarters of consecutive, negative GDP (Gross Domestic Property) data
- Inverted yield curve
- Rising unemployment and mass layoff announcements
- Declining corporate profits
- Hawkish Federal Reserve
The reality of the situation is the U.S. economy continues to expand; the yield curve remains relatively steep and positive; unemployment declined to 5.9% in the most recent month; corporate profits are at record levels and continue to grow; and the Fed has communicated no urgency to raise short-term interest rates in the near future. While the current headlines may not be so rosy, and the Ebola, eurozone, and Chinese markets may be giving you heartburn, nevertheless, the stock market has steadily climbed a wall of market worry over the last five years.
As the great Peter Lynch stated (see also Inside the Brain of an Investing Genius), “Far more money has been lost by investors preparing for corrections, or trying to anticipate corrections, than has been lost in corrections themselves.” Stated differently, Value investor Seth Klarman noted, “We can predict 10 of the next two recessions,” which highlights pundits’ inabilities of accurately predicting the next downturn (see also 100-Year Flood ≠ 100-Day Flood). As Lynch also adds, rather than trying to time the market, it is better to “assume the market is going nowhere and invest accordingly.”
Now may not be the time to dive into stocks headfirst, but many stocks have fallen -10%, -20%, and -30%, so it behooves long-term investors to take advantage of the correction. It’s true that buying when there is “blood in the streets” is an optimal strategy, but facts show this is a difficult strategy to execute. Rather than get greedy, long-term investors may be better served by opportunistically buying when there are “scrapes on the sidewalk.”
Wade W. Slome, CFA, CFP®
Plan. Invest. Prosper.
DISCLOSURE: Sidoxia Capital Management (SCM) and some of its clients hold positions in certain exchange traded funds (ETFs), but at the time of publishing SCM had no direct position in any other security referenced in this article. No information accessed through the Investing Caffeine (IC) website constitutes investment, financial, legal, tax or other advice nor is to be relied on in making an investment or other decision. Please read disclosure language on IC Contact page.
Does Double-Dip Pass Duck Test?

If it looks like a duck, walks like a duck, and quacks like a duck, then chances are it is a duck. Regrettably, not everything passes the common “duck test” when it comes to judging the state of the economy. The prevailing opinion is the economy is on the brink of falling into another double-dip recession. Driving this sentiment has been the relentless focus on the softening short-term data (e.g., weekly jobless claims, monthly retail sales, daily dollar index, etc.). I’m no prophet or Nostradamus when it comes to picking the direction of the market, but if you consider the status of the steep Treasury yield curve, the perceived sitting duck economy may actually just be something completely different – perhaps one of those oily birds recovering from the BP oil spill.
Pictures Worth Thousands of Words
Despite all the talk of “double-dip”, the curve’s extreme slope is still near record levels achieved over the last quarter century. Here’s what the Treasury snapshot looks like now:

Graph source: The Financial Times
Does this look like an inverted yield curve, which ordinarily precedes an economy falling into recession? Quite the opposite – this picture looks more like a ramp from which Evel Knievel is about to jump. Maybe Federal Reserve Chairman Ben Bernanke is actually the daredevil himself by setting artificially low interest rates for extended periods of time? If so, it’s possible the economy will suffer a fate like Mr. Knievel’s at Caesar’s Palace, but my guess is we are closer to the take-off than landing based on the yield curve.
I’ve recently harped on the wide range of “double-dip” guesses made by economists and strategists (see “Probably” Wrong article), but if that was not enough for you, here are a few more cheery views taken from this weekend’s Barron’s magazine and a few other publications of choice:
Kopin Tan (Barron’s): “The Treasuries camp is expecting another recession… In reality, with retailers and customers alike eyeing a second recession this year, it’s a season of anxiety.”
John Crudele (NY Post): “We’ll get a correction that’ll put the words ‘double-dip’ back into the headlines… When the final figures are produced years from now, historians might just decide that this was just one long downturn — not a series of dips.”
Jeremy Cook (Chief Economist-World First): “This will further heighten fears that the US economy is careening into the dreaded double-dip recession.”
How can the double-dippers be wrong? For starters, as I alluded to earlier, we are nowhere near an inverted yield curve. The 10-Year Treasury Note currently yields 2.62% while the T-Bill a measly 0.15%, creating a spread of about +2.47% (a long distance from negative).

As this chart implies, and others confirm, over the last 50 years or so, the yield curve has turned negative (or near 0% in the late 1950s and early 1960s) before every recession. Admittedly, before the soft-patch in economic data-points, the steepness was even greater than now (closer to 3.5%). Maybe the double-dippers are just more prescient than history has been as a guide, but until we start flirting with sub-1% spreads, I’ll hold off on sweating bullets. Less talked about now is the possibility of stagflation (stagnant inflation). I’m not in that camp, but down the road I see this as a larger risk than the imminent double-dip scenario.
I’m not in the business of forecasting the economy, and history books are littered with economists that come and go in glory and humiliation. And although it’s fun guessing on what will or will not happen with the economy, I rather choose to follow the philosophy of the great Peter Lynch (see my profile of Lynch):
“If you spend more than 13 minutes analyzing economic and market forecasts, you’ve wasted 10 minutes.”
Along those same lines, he adds:
“Assume the market [economy] is going nowhere and invest accordingly.”
I choose to spend my time hunting and investing in opportunities all over the map. With fear and anxiety high, fortunately for me and my clients, I am finding more attractive prospects. While some get in the stale debate of stocks versus bonds, there are appealing openings across the whole capital structure, geographies, and the broad spectrum of asset classes. So, as others look to test whether the economic animal is a bear, bull, or duck, I’ll continue sniffing away for opportunities like a bloodhound.
Wade W. Slome, CFA, CFP®
Plan. Invest. Prosper.
*DISCLOSURE: Sidoxia Capital Management (SCM) and some of its clients own certain exchange traded funds, but at the time of publishing SCM had no direct position in BP or any security referenced in this article. No information accessed through the Investing Caffeine (IC) website constitutes investment, financial, legal, tax or other advice nor is to be relied on in making an investment or other decision. Please read disclosure language on IC “Contact” page.
Professional Double-Dip Guesses are “Probably” Wrong

As you may have noticed from previous articles, I take a significant grain (or pound) of salt when listening to economists and strategists like Peter Schiff, Nouriel Roubini, Meredith Whitney, John Mauldin, et.al. Typically, these financial astrologists weave together convincing, elaborate, grand guesses that extrapolate every short-term, fleeting economic data point into an imposing (or magnificent) long-term secular trend.
With all this talk of “double-dip” recession, I cannot help but notice the latest verbal tool implemented by every Tom, Dick, and Harry economist when discussing this topic… the word “probability”. Rather than honestly saying I have no clue on what the economy will do, many strategists place a squishy numerical “probability” around the possibility of a “double-dip” recession consistent with the news du jour. Over recent weeks, unstable U.S. economic data have been coming in softer than expectations. So, guess what? Economists have become more pessimistic about the economy and raised the “probability” of a double dip recession. Thanks Mr. Professor “Obvious!” I’m going to go out on a limb, and say the probability of a double-dip recession will likely go down if economic data improves. Geez…thanks.
Here is a partial list of double-dip “probabilities” spouted out by some well-known and relatively unknown economists:
- Robert Shiller (Professor at Yale University): “The probability of that kind of double-dip is more than 50 percent.”
- Bill Gross (Founder/Managing Director at PIMCO): The New York Times described Gross’s double-dip radar with the following, “He put the probability of a recession — and of an accompanying bout of deflation — at 25 to 35 percent.”
- Mohamed El-Erian (CEO of PIMCO): “If you wonder how meaningful 25 per cent is, ask yourself the following question: if I offered you that I drive you back to work, but there’s a one in four chance that I get into a big accident, would you come with me?”
- David Rosenberg (Chief Economist at Gluskin Chef): In a recent newsletter, Rosenberg has raised the odds of a double-dip recession from 45 per cent a month ago to 67 per cent currently.
- Nouriel Roubini (Professor at New York University): “As early as August 2009 I expressed concern in a Financial Times op-ed about the risk of a double-dip recession, even if my benchmark scenario characterizes the risk of a W as still a low probability event (20% probability) as opposed to a 60% probability for a U-shaped recovery.”
- Robert Reich (Former Secretary of Labor): According to Martin Fridson, Global Credit Strategist at BNP Paribas, Robert Reich has assigned a 50% probability of a double dip, even if Reich believes we are actually in one “Long Dipper.”
- Graeme Leach (Chief Economist at the Institute of Directors): “I would give a 40 per cent probability to what I call ‘one L of a recovery’, in other words a fairly weak flattish cycle over the next 12 months. A double-dip recession would get a 40 per cent probability as well.”
- Ed McKelvey (Sr. U.S. Economist at Goldman Sachs): “We think the probability is unusually high — between 25 percent and 30 percent — but we do not see double dip as the base case.”
- Avery Shenfeld (Chief Economist at CIBC): “The probability estimate is likely more consistent with a slowdown rather than a true double-dip recession but, given the uncertainties, fiscal tightening ahead and the potential for a slow economy to be vulnerable to shocks, we will keep an eye on our new indicator nevertheless.” This guy can’t even be pinned down for a number!
- National Institute for Economic and Social Research (NIESR) : “The probability of seeing a contraction of output in 2011 as compared to 2010 has risen from 14 per cent to 19 per cent.”
- New York Fed Treasury Spread Model (see chart below): Professor Mark J. Perry notes, “For July 2010, the recession probability is only 0.06% and by a year from now in June of next year the recession probability is only slightly higher, at only 0.3137% (less than 1/3 of 1%).”

Listening to these economic armchair quarterbacks predict the direction of the financial markets is as painful as watching Jim Gray’s agonizing hour-long interview of Lebron James’s NBA contract decision (see also Lebron: Buy, Sell, or Hold?). Just what I want to hear – a journalist that probably has never dribbled a ball in his life, inquiring about cutting edge questions like whether Lebron is still biting his nails? Most of these economists are no better than Jim Gray. In many instances these professionals don’t invest in accordance with their recommendations and their probability estimates are about as reliable as an estimate of the volatility index (see chart below) or a prediction about Lindsay Lohan’s legal system status.

I can virtually guarantee you at least one of the previously mentioned economists will be correct on their forecasts. That isn’t much of an achievement, if you consider all the strategists’ guesses effectively cover every and any economic scenario possible. If enough guesses are thrown out there, one is bound to stick. And if they’re wrong, no problem, the economists can simply blame randomness of the lower probability event as the cause of the miscue.
Unlike Wayne Gretzky, who said, “I skate to where the puck is going to be, not where it has been,” economists skate right next to the puck. Because the economic data is constantly changing, this strategy allows every forecaster to constantly change their outlook in lock-step with the current conditions. This phenomenon is like me looking at the dark clouds outside my morning window and predicting a higher probability of rain, or conversely, like me looking at the blue skies outside and predicting a higher chance of sunshine.
Using this “probability” framework is a convenient B.S. means of saving face if a directional guess is wrong. By continually adjusting probability scenarios with the always transforming economic data, the strategist can persistently waffle with the market sentiment vicissitudes.
What would be very refreshing to see is a strategist on CNBC who declares he was dead wrong on his prediction, but acknowledges the world is inherently uncertain and confesses that nobody can predict the market with certainty. Instead, the rent-o-strategists consistently change their predictions in such a manner that it is difficult to measure their accuracy – especially when there is rarely hard numbers to hold these professional guessers accountable for.
Economists and strategists may be well-intentioned people, just as is the schizophrenic trading advice of Jim Cramer of CNBC’s Mad Money, but the “probability” of them being right over relevant investing time horizons is best left to an experienced long-term investor that understands the pitfalls of professional guessing.
Wade W. Slome, CFA, CFP®
Plan. Invest. Prosper.
*DISCLOSURE: Sidoxia Capital Management (SCM) and some of its clients own certain exchange traded funds, but at the time of publishing SCM had no direct position in GS, NYT or any security referenced in this article. No information accessed through the Investing Caffeine (IC) website constitutes investment, financial, legal, tax or other advice nor is to be relied on in making an investment or other decision. Please read disclosure language on IC “Contact” page.
Cockroach Consumer Cannot be Exterminated

We’re told that cockroaches would inherit the earth if a nuclear war were to occur, due to the pests’ impressive resiliency. Like a cockroach, the American consumer has managed to survive its own version of a financial nuclear war, as a result of the global debt binge and bursting of the real estate bubble. Although associating a consumer to a disease-carrying cockroach is not the most flattering comparison, I suppose it is okay since I too am a consumer (cockroach).
Confidence Cuisine
Cockroaches enjoy feasting on food, but they have been known to live close to a month without food, two weeks without water, and a half hour without air while submerged in water. On the other hand, consumers can’t live that long without food, water, and oxygen, but what really feeds buyer purchasing patterns is confidence. The April Consumer Confidence number from the Confidence Board showed the April reading reaching the highest level since September 2008. On a shorter term basis, the April figure measured in at 57.9, up from 52.3 in the previous month.
Where is all this buying appetite coming from? What we’re witnessing is merely a reversal of what we experienced in the previous years. In 2008 and 2009 more than 8 million jobs were shed and the fear-induced spiraling of confidence pushed consumers’ buying habits into a cave. With +290,000 new jobs added in April, the fourth consecutive month of additions, the tide has turned and consumers are coming out to see the sun and smell the roses. Recently the Bureau of Economic Analysis (BEA) revealed real personal consumption expenditures grew +3.6% in the first quarter – the largest quarterly increase in consumer spending since the first quarter of 2007.
Sure, there still are the “double-dippers” predicting an impending recession once the sugar-high stimulus wears off and tax increases kick-in. From my perch, it’s difficult for me to gauge the timing of any future slowing, other than to say I have not been surprised by the timing or magnitude of the rebound (I was writing about the steepening yield curve and the end of the recession last June and July, respectively). Sometimes, the farther you fall, the higher you will bounce. Rather than try to time or predict the direction of the market (see market timing article), I look, rather, to exploit the opportunities that present themselves in volatile times (e.g., your garden variety Dow Jones -1,000 point hourly plunge).
Will the Trend End?
Can this generational rise in consumer spending continue unabated? Probably not. To some extent we are victims of our own success. As about 25% of global GDP and only 5% of the world’s population, changing directions of the U.S.A. supertanker is becoming increasingly more difficult.

Source: The New York Times (Economix)
However, more nimble, resource-rich developing countries have fewer demographic and entitlement-driven debt issues like many developed countries. In order to build on an envious standard of living, our country needs to build on our foundation of entrepreneurial capitalism by driving innovation to create higher paying jobs. With those higher paying jobs will come higher spending. Of course, if uncompetitive industries cannot compete in the global marketplace, and a mirage of spending is re-created through drug-like credit cards and excess leveraged corporate lending, then heaven help us. Even the impressively resilient cockroach will not be able to survive that scenario.
Read full New York Times article here
Wade W. Slome, CFA, CFP®
Plan. Invest. Prosper.
*DISCLOSURE: Sidoxia Capital Management (SCM) and some of its clients own certain exchange traded funds, but at the time of publishing SCM had no direct positions in any security referenced in this article. No information accessed through the Investing Caffeine (IC) website constitutes investment, financial, legal, tax or other advice nor is to be relied on in making an investment or other decision. Please read disclosure language on IC “Contact” page.
Tortuous Path to Productivity

There is a silver lining to the deep, tortuous job cuts in this severe recession and it is called “productivity.” Those fortunate enough to retain their jobs are forced to become more productive. In layman’s terms, productivity simply is output divided by hours worked.
Unemployment dropped to 9.4% in July, thanks in part to a decline in the job losses to -247,000 from a peak in January of -741,000 job losses. During this period of job-loss cratering, we managed to sustain a decline of a mere -1% in Q2 Gross Domestic Product (GDP). How could we lose more than 6 million jobs since the beginning of 2008 and still be on a path to recovery? A large contributor is our friend, productivity, which came in at a whopping +6.4% in Q2 – the highest in six years.
Productivity increased in part because of a slashing of work-hours by employers. Employees that have maintained employment are therefore forced to produce more output (goods and services) per unit hour of employment. In this severe recession that we are pulling out of, the American worker is being stretched like a rubber band. At some point, the “Law of Diminishing Returns” kicks in and employers are forced to hire new employees to meet demand levels, or the rubber band will snap.
The prime ways of increasing productivity are raising the amount of capital per worker (capital intensity) and also elevating the workers’ average level of skill, education, and training (labor quality).
Not only are the surviving U.S. workers toiling harder, they are not getting pay increases large enough to offset inflation. For example, Q2 hourly compensation increased +0.2%, but after accounting for inflation, real hourly compensation was actually down -1.1%.
As the MarketWatch article points out:
The early stages of recovery are typically the best for productivity: Output is rising, but cost-cutting plans are still being implemented… Productivity gains are the key to higher living standards, higher wages, increased profits and low inflation… Productivity averaged about 2.7% annually from 1948 to 1970, then slowed to 1.6% from 1971 to 1995. Since then, productivity has grown about 2.5% annually. In 2008, productivity increased 1.8%.
Productivity allows the U.S. to produce more goods and services with fewer workers. For instance, the MarketWatch article also highlights the U.S. is producing 20% more output relative to a decade ago, yet employment has not changed at all over that time period.
We are certainly not out of the woods when it comes to the recession, and for those lucky enough to maintain employment, they are being asked (forced) to work more for less pay. These productivity improvements feel like torture to the survivors, however this pain will eventually lead to economic gain.
Wade W. Slome, CFA, CFP
Plan. Invest. Prosper.


