Posts tagged ‘price earnings’
The Multi-Trillion AI Tsunami Sweeping the Market

Not only has Artificial Intelligence (AI) dominated headlines, but a multi-trillion-dollar investment tsunami is creating a rising tide that has lifted many AI-related stocks to market leadership. Since the seismic launch of OpenAI’s ChatGPT in November 2022, investors have rushed to participate in what may be one of the largest technology investment cycles in history.
At my firm, Sidoxia Capital Management, we have been positioned in the AI rush for several years—well before ChatGPT became a household name. Close followers of my work know I have been tracking the AI revolution for years (see my previous analysis on my Investing Caffeine blog.
Goldman Sachs recently published an in-depth report highlighting the various AI scenarios and assumptions underlying an estimated $4 trillion to $8 trillion spending boom on compute (AI chips), data center infrastructure, and power investments over the next five years. As shown in the chart below, Goldman’s baseline capital expenditures scenario models a staggering $7.6 trillion in spending from 2026 to 2031. While variables like the lifespan of NVIDIA GPUs can shift annual AI spending estimates by hundreds of billions of dollars, the numbers remain enormous under virtually any scenario.
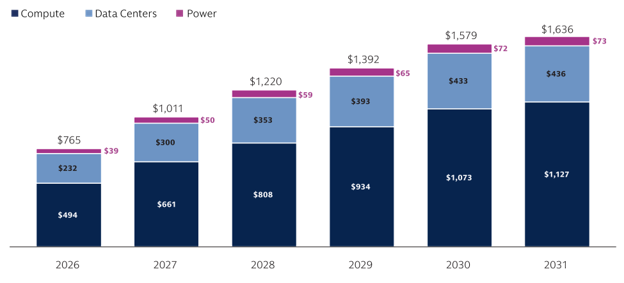
Source: Goldman Sachs
Market Momentum: Another Record-Breaking Month
For the month, the major indexes once-again vaulted to new record highs, driven by the AI capital expenditure cycle and a record level of profits:
· S&P 500: +5.2% (+10.7% year-to-date)
· NASDAQ: +8.4% (+16.1% year-to-date)
· Dow Jones Industrial Average: +2.8% (+6.2% year-to-date)
As I highlighted in last month’s post, it isn’t just speculative spending driving stock prices higher; it is an active AI productivity revolution that is causing corporate earnings to roar. This is especially true within the large-cap technology sector, which serves as the primary engine behind the S&P 500’s record-breaking performance.
It may seem counter-intuitive, but even as stock prices have reached record heights, valuations have actually become cheaper (sitting at a 20.9 forward P/E) compared to the peak price-to-earnings ratios seen in 2025. How is this possible? Quite simply, the denominator of the P/E ratio (earnings) has been growing at a faster clip than the numerator (stock prices), compressing the overall valuation multiple – see chart below.
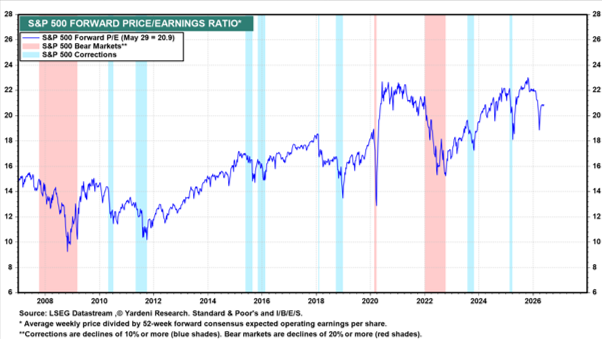
Source: Yardeni.com
The Quest for Efficiency
Ultimately, the objective of every publicly traded company is straightforward: increase profits and cash flow. For most businesses, labor remains the largest operating expense. One of the most effective ways to reduce labor costs and improve efficiency is through technology investment. The chart below highlights the growing role technology plays within the economy as companies increasingly invest in automation, software, cloud computing, and AI. These investments often improve productivity, expand margins, and enhance long-term profitability.
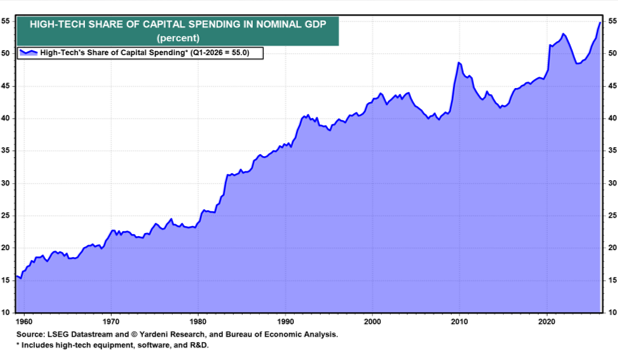
Source: Yardeni.com
As this disruptive AI revolution permeates all sectors of the economy, we are witnessing the early stages of a productivity renaissance. Even as unemployment rates slowly creep higher (reaching 4.3% from a 2023 low of 3.4%), corporate profit growth is accelerating while nominal GDP continues to chug along at a steady rate (see chart below).
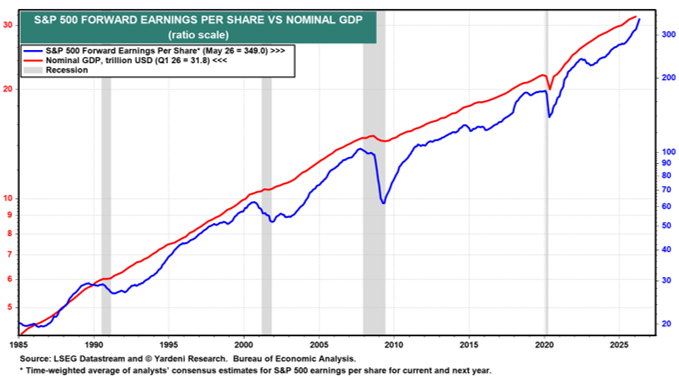
Source: Yardeni.com
The Infrastructure Winners
Underlying this economic growth are the individual companies building the foundation of the AI boom. Just five months into the year, a select group of infrastructure and semiconductor hardware companies have posted astronomical returns in 2026*:
Underlying the growth in profits and the economy are the individual companies driving the AI infrastructure boom. Even though we are only five months through the year, here is a small list of companies benefiting from and contributing to the rocketing growth in 2026 (YTD % Gains)*:
· Sandisk Corp. (SNDK) +604%
· Micron Technology Inc. (MU) +240%
· Dell Technologies Inc. (DELL) +234%
· Intel Corp. (INTC) +211%
· Western Digital Corp. (WDC) +208%
· Sterling Infrastructure Inc. (STRL) +181%
· Powell Industries Inc. (POWL) +168%
· Comfort Systems USA Inc. (FIX) +96%
· Vertiv Holdings Co. (VRT) +95%
*Sidoxia Capital Management and/or its clients hold positions in some of these companies (see Complete Strategy Performance and Disclosure at the bottom of this article or Click Here).
A major tailwind supporting these companies is the roughly $700 billion of capital expenditures expected in 2026 from hyperscale technology leaders such as Alphabet, Microsoft, Meta Platforms, and Amazon. These firms continue to aggressively invest in AI infrastructure to maintain competitive advantages and satisfy surging demand for AI-powered services – see AI Tech Spending article.
The Importance of Diversification (Even in a Hot Market)
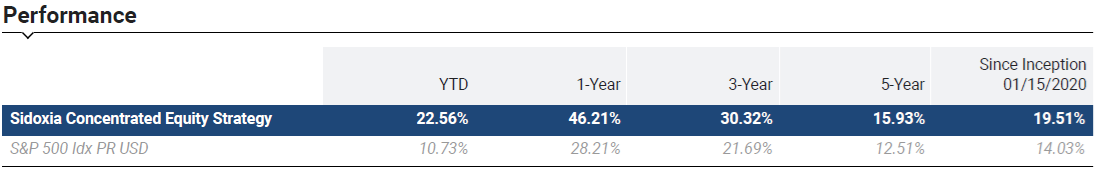
At Sidoxia, our concentrated equity portfolios have significantly outperformed the S&P 500 index in 2026, as well as on a 1-year, 3-year, and 5-year basis. However, our winning exposure in AI infrastructure stocks has been partially offset by underperformance in the cryptocurrency, healthcare, and software/SaaS sectors. This includes drags from holdings like Exzeo Group, Inc. (XZO, -43% YTD), Salesforce Inc. (CRM, -28%), and Roper Technologies Inc. (ROP, -27%).
Ultimately, this underscores the necessity of a balanced portfolio: the positive contributions from our top-performing names heavily outweighed the negative drag from the laggards, allowing our concentrated strategy to come out ahead.
No Signs of Slowing, But Watch the Horizon
Euphoria surrounding the AI spending wave shows no signs of abating in the near term. The highly anticipated upcoming Initial Public Offerings (IPOs) from private giants like SpaceX (SPCX), Anthropic, and OpenAI will likely add fuel to investor excitement. This naturally begs the question: are we inflating another technology bubble?
Trees don’t grow to the sky forever, and the same fundamental law applies to investing—eventually, the parabolic gains will slow or reverse.
The AI tsunami is currently in full force, and while it has created massive wealth today, historical market cycles remind us that unmanaged momentum can eventually cause financial damage to unprepared investors. Right now, there is no shortage of demand for AI services and infrastructure, keeping the market tide exceptionally high. Sidoxia and its clients have benefited tremendously from this secular trend, but we remain highly vigilant and active in managing risk for when the tide inevitably turns.
Stay tuned, and ensure your portfolio is properly structured to navigate the waves ahead.
Wade W. Slome, CFA, CFP®
Plan. Invest. Prosper.
Important Performance Disclosure: The specific positions discussed above were extracted based on the top and bottom performers from our overall Concentrated Equity Strategy portfolios. To see how these selections fit into our broader historical track record, please review our
Full Strategy Performance Sheet & Required Legal Disclosures (PDF)
Sidoxia Capital Management (SCM) and some of its clients hold positions in GS, STRL, POWL, FIX, VRT, XZO, CRM, ROP, and certain exchange traded funds (ETFs), but at the time of publishing had no direct position in any other security referenced in this article. Past performance is no guarantee of future results. Selections referenced in this article represent the top and bottom material contributors and do not reflect all positions bought or sold during this period.
ADDITIONAL DISCLOSURE: No information accessed through the Investing Caffeine (IC) website constitutes investment, financial, legal, tax or other advice nor is to be relied on in making an investment or other decision. Each investor’s situation is unique so please work with a professional financial adviser, tax accountant or legal representative, as applicable, to develop an individualized plan or address any questions you may have. Investing involves risk including the possibility of loss of one’s investment.
Winning the Loser’s Game

During periods of heightened volatility like those recently experienced, it’s easy to get caught up in the emotional heat of the moment. I find time is better spent returning to essential investing fundamentals, like the ones I read in the investment classic by Charles Ellis, Winning the Loser’s Game – “WTLG”. To put my enthusiasm in perspective, WTLG has even achieved the elite and privileged distinction of making the distinguished “Recommended Reading” list of Investing Caffeine (located along the right-side of the page). Wow…now I know you are really impressed.
The Man, The Myth, the Ellis
 For those not familiar with Charley Ellis, he has a long, storied investment career. Not only has he authored 12 books, including compilations on Goldman Sachs (GS) and Capital Group, but his professional career dates back prior to 1972, when he founded institutional consulting firm Greenwich Associates. Besides earning a college degree from Yale University, and an MBA from Harvard Business School, he also garnered a PhD from New York University. Ellis also is a director at the Vanguard Group and served as Investment Committee chair at Yale University along investment great David Swensen (read also Super Swensen) from 1992 – 2008.
With this tremendous investment experience come tremendous insights. The original book, which was published in 1998, is already worth its weight in gold (even at $1,384 per ounce), but the fifth edition of WTLG is even more valuable because it has been updated with Ellis’s perspectives on the 2008-2009 financial crisis.
Because the breadth of topics covered is so vast and indispensable, I will break the WTLG review into a few parts for digestibility. I will start off with the these hand-picked nuggets:
Defining the “Loser’s Game”
Here is how Charles Ellis describes the investment “loser’s game”:
“For professional investors, “the ‘money game’ we call investment management evolved in recent decades from a winner’s game to a loser’s game because a basic change has occurred in the investment environment: The market came to be dominated in the 1970s and 1980s by the very institutions that were striving to win by outperforming the market. No longer is the active investment manager competing with cautious custodians or amateurs who are out of touch with the market. Now he or she competes with other hardworking investment experts in a loser’s game where the secret to winning is to lose less than others lose.”
Underperformance by Active Managers
Readers that have followed Investing Caffeine for a while understand how I feel about passive (low-cost do-nothing strategy) and active management (portfolio managers constantly buying and selling) – read Darts, Monkeys & Pros. Ellis’s views are not a whole lot different than mine – here is what he has to say while not holding back any punches:
“The basic assumption that most institutional investors can outperform the market is false. The institutions are the market. They cannot, as a group, outperform themselves. In fact, given the cost of active management – fees, commissions, market impact of big transactions, and so forth-85 percent of investment managers have and will continue over the long term to underperform the overall market.”
He goes on to say individuals do even worse, especially those that day trade, which he calls a “sucker’s game.”
Exceptions to the Rule
Ellis’s bias towards passive management is clear because “over the long term 85 percent of active managers fall short of the market. And it’s nearly impossible to figure out ahead of time which managers will make it into the top 15 percent.” He does, however, acknowledge there is a minority of professionals that can beat the market by making fewer mistakes or taking advantage of others’ mistakes. Ellis advocates a slow approach to investing, which bases “decisions on research with a long-term focus that will catch other investors obsessing about the short term and cavitating – producing bubbles.” This is the strategy and approach I aim to achieve.
Gaining an Unfair Competitive Advantage
According to Ellis, there are four ways to gain an unfair competitive advantage in the investment world:
1) Physical Approach: Beat others by carrying heavier brief cases and working longer hours.
2) Intellectual Approach: Outperform by thinking more deeply and further out in the future.
3) Calm-Rational Approach: Ellis describes this path to success as “benign neglect” – a method that beats the others by ignoring both favorable and adverse market conditions, which may lead to suboptimal decisions.
4) Join ‘em Approach: The easiest way to beat active managers is to invest through index funds. If you can’t beat index funds, then join ‘em.
The Case for Stocks
Investor time horizon plays a large role on asset allocation, but time is on investors’ side for long-term equity investors:
“That’s why in the long term, the risks are clearly lowest for stocks, but in the short term, the risks are just as clearly highest for stocks.”
Expanding on that point, Ellis points out the following:
“Any funds that will stay invested for 10 years or longer should be in stocks. Any funds that will be invested for less than two to three years should be in “cash” or money market instruments.”
While many people may feel stock investing is dead, but Ellis points out that equities should return more in the long-run:
“There must be a higher rate of return on stocks to persuade investors to accept risks of equity investing.”
The Power of Regression to the Mean
Investors do more damage to performance by chasing winners and punishing losers because they lose the powerful benefits of “regression to the mean.” Ellis describes this tendency for behavior to move toward an average as “a persistently powerful phenomenon in physics and sociology – and in investing.” He goes on to add, good investors know “that the farther current events are away from the mean at the center of the bell curve, the stronger the forces of reversion, or regression, to the mean, are pulling the current data toward the center.”
The Power of Compounding
For a 75 year period (roughly 1925 – 2000) analyzed by Ellis, he determines $1 invested in stocks would have grown to $105.96, if dividends were not reinvested. If, however, dividends are reinvested, the power of compounding kicks in significantly. For the same 75 year period, the equivalent $1 would have grown to $2,591.79 – almost 25x’s more than the other method (see also Penny Saved is Billion Earned).
Ellis throws in another compounding example:
“Remember that if investments increase by 7 percent per annum after income tax, they will double every 10 years, so $1 million can become $1 billion in 100 years (before adjusting for inflation).”
The Lessons of History
As philosopher George Santayana stated – “Those who cannot remember the past are condemned to repeat it.” Details of every market are different, but as Ellis notes, “The major characteristics of markets are remarkably similar over time.”
Ellis appreciates the importance of history plays in analyzing the markets:
“The more you study market history, the better; the more you know about how securities markets have behaved in the past, the more you’ll understand their true nature and how they probably will behave in the future. Such an understanding enables us to live rationally with markets that would otherwise seem wholly irrational.”
Home Sweet International Home
Although Ellis’s recommendation to diversify internationally is not controversial, his allocation recommendation regarding “full diversification” is a bit more provocative:
“For Americans, this would mean about half our portfolios would be invested outside the United States.”
This seems high by traditional standards, but considering our country’s shrinking share of global GDP (Gross Domestic Product), along with our relatively small share of the globe’s population (about 5% of the world’s total), the 50% percentage doesn’t seem as high at first blush.
Beware the Broker
This is not new territory for me (see Financial Sharks, Fees/Exploitation, and Credential Shell Game), and Ellis warns investors on industry sales practices:
“Those oh so caring and helpful salespeople make their money by convincing you to change funds. Friendly as they may be, they may be no friend to your long-term investment success.”
Unlike a lot of other investing books, which cover a few aspects to investing, Winning the Loser’s Game covers a gamut of crucial investment lessons in a straightforward, understandable fashion. A lot of people play the investing game, but as Charles Ellis details, many more investors and speculators lose than win. For any investor, from amateur to professional, reading Ellis’s Winning the Loser’s Game and following his philosophy will not only help increase the odds of your portfolio winning, but will also limit your losses in sleep hours.

Wade W. Slome, CFA, CFP®
Plan. Invest. Prosper.
DISCLOSURE: Sidoxia Capital Management (SCM) and some of its clients own certain exchange traded funds, but at the time of publishing SCM had no direct position in GS, or any other security referenced in this article. No information accessed through the Investing Caffeine (IC) website constitutes investment, financial, legal, tax or other advice nor is to be relied on in making an investment or other decision. Please read disclosure language on IC “Contact” page.
2014: Here Comes the Dumb Money!

Before this year’s gigantic rally, I wrote about the unexpected risk of a Double Rip. At that time, all the talk and concern was over the likelihood of a “Double Dip” recession due to the sequestration, tax increases, Obamacare, and an endless list of other politically charged worries.
Perma-bear Nouriel Roubini has already incorrectly forecasted a double-dip in 2009, 2010, 2011, and 2012, and bond maven Bill Gross at PIMCO has fallen flat on his face with his “2013 Fearless Forecasts”: 1) Stocks & bonds return less than 5%. 2) Unemployment stays at 7.5% or higher 3) Gold goes up.
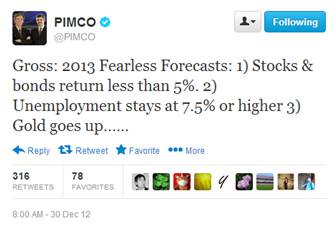
Well at least Bill was correct on 1 of his 4 predictions that bonds would suck wind, although achieving a 25% success rate would have earned him an “F” at Duke. The bears’ worst nightmares have come to reality in 2013 with the S&P up +25% and the NASDAQ climbing +33%, but there still are 11 trading days left in the year and a Hail Mary taper-driven collapse is in bears’ dreams.
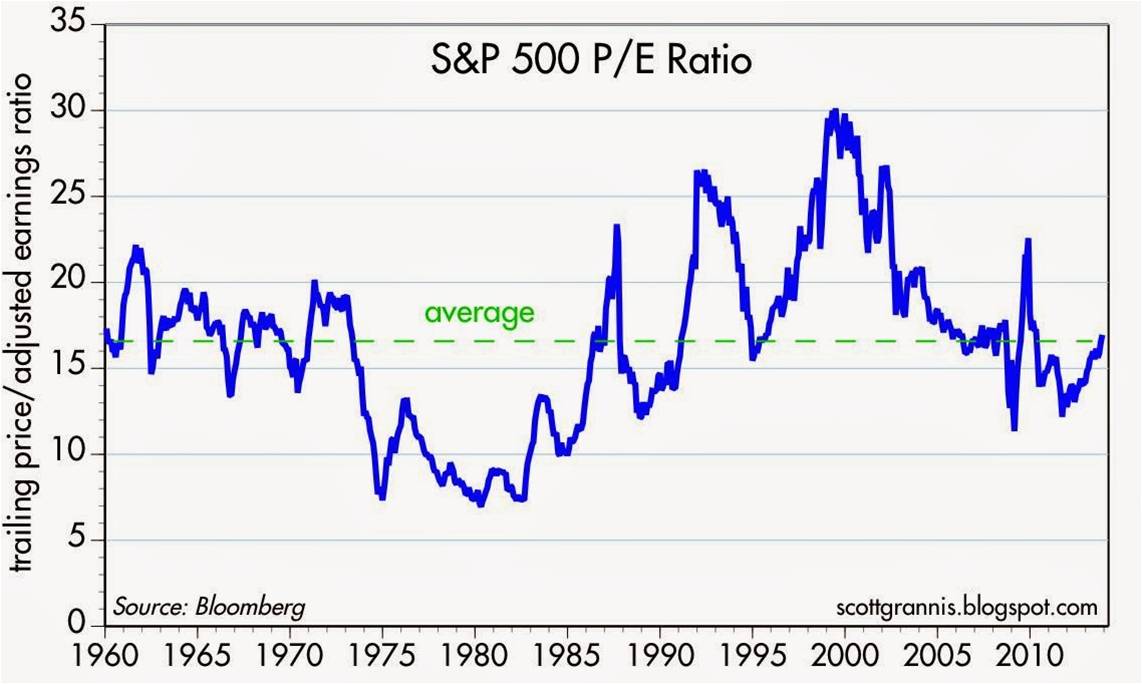
Source: Scott Grannis
For bulls, the year has brought a double dosage of GDP and job expansion, topped with a cherry of multiple expansion on corporate profit growth. As we head into 2014, at historically reasonable price-earnings valuations (P/E of ~16x – see chart above), the new risk is no longer about Double-Dip/Rip, but rather the arrival of the “dumb money.” You know, the trillions of fear capital (see chart below) parked in low-yielding, inflation-losing accounts such as savings accounts, CDs, and Treasuries that has missed out on the more than doubling and tripling of the S&P and NASDAQ, respectively (from the 2009 lows).
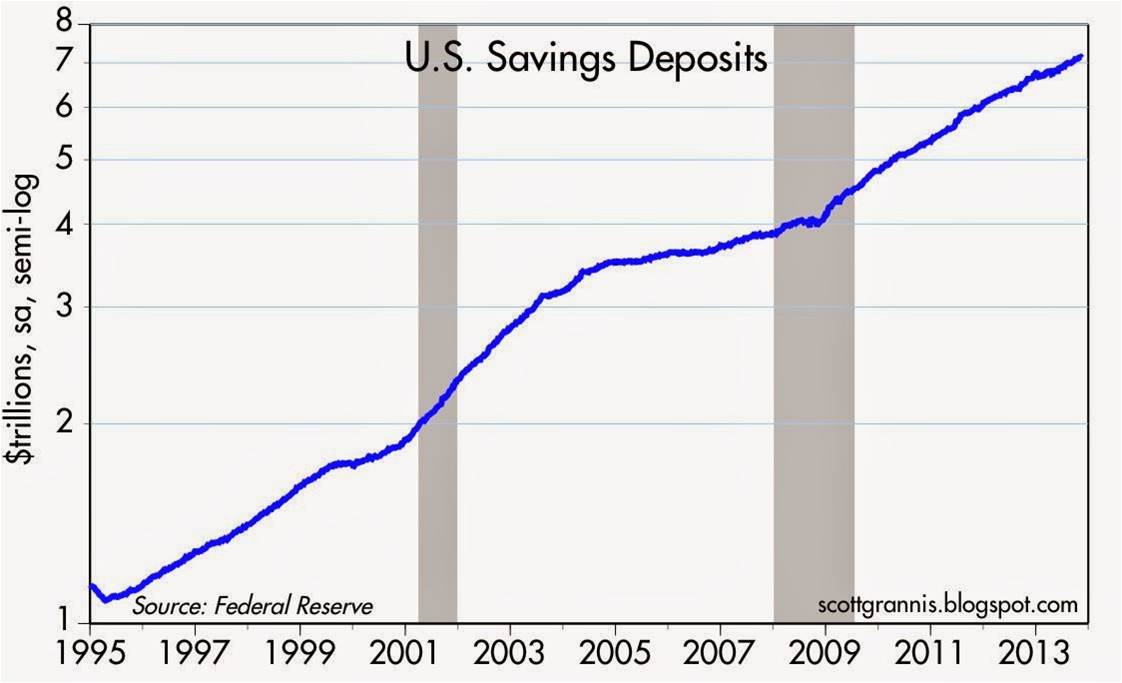
Source: Scott Grannis
The fear money was emboldened in 2009-2012 because fixed income performed admirably under the umbrella of declining interest rates, albeit less robustly than stocks. The panic trade wasn’t rewarded in 2013, and the dumb money trade may prove challenging for the bears in 2014 as well.
Despite the call for the “great rotation” out of bonds into stocks earlier this year, the reality is it never happened. I will however concede, a “great toe-dip” did occur, as investor panic turned to merely investor skepticism. If you consider the domestic fund flows data from ICI (see chart below), the modest +$28 billion inflow this year is a drop in the bucket vis-à-vis the hemorrhaging of -$613 billion out of equities from 2007-2012.

Will I be talking about the multi-year great rotation finally coming to an end in 2018? Perhaps, but despite an impressive stock rally over the previous five years in the face of a wall of worry, I wonder what a half trillion dollar rotation out of bonds into stocks would mean for the major indexes? While a period of multi-year stock buying would likely be good for retirement portfolios, people always find it much easier to imagine potentially scary downside scenarios.
It’s true that once the taper begins, the economy gains more steam, and interest rates begin rising to a more sustainable level, the pace of this stock market recovery is likely to lose steam. The multiple expansion we’ve enjoyed over the last few years will eventually peak, and future market returns will be more reliant on the lifeblood of stock-price appreciation…earnings growth (a metric near and dear to my heart).
The smart money has enjoyed another year of strong returns, but the party may not quite be over in 2014 (see Missing the Pre-Party). Taper is the talk of the day, but investors might pull out the hats and horns this New Year, especially if the dumb money comes to join the fun.
Wade W. Slome, CFA, CFP®
Plan. Invest. Prosper.
DISCLOSURE: Sidoxia Capital Management (SCM) and some of its clients hold positions in certain exchange traded funds (ETFs), but at the time of publishing SCM had no direct position in any other security referenced in this article. No information accessed through the Investing Caffeine (IC) website constitutes investment, financial, legal, tax or other advice nor is to be relied on in making an investment or other decision. Please read disclosure language on IC Contact page.
NASDAQ: The Ugly Stepchild Index

All the recent media focus has been fixated on whether the Dow Jones Industrial Average index (“The Dow”) will close above the 13,000 level. In the whole scheme of things, this specific value doesn’t mean a whole lot, but it does make for a great topic of conversation at a cocktail party. Today, the Dow is trading at 12,983, a level not achieved in more than three and a half years. Not a bad accomplishment, given the historic financial crisis on our shores and the debacle going on overseas, but I’m still not so convinced a miniscule +0.1% move in the Dow means much. While the Dow and the S&P 500 indexes garner the hearts and minds of journalists and TV reporters, the ugly stepchild index, the NASDAQ, gets about as much respect as Rodney Dangerfield (see also No Respect in the Investment World).
While the S&P 500 hundred has NOT even reached the level from one year ago, the technology-heavy NASDAQ index has hit a 11+ year record high. Yes that’s right; the NASDAQ has not reached these levels since December 2000. Sure, the NASDAQ receives a lot of snickers since the technology bubble burst in 2000, when the index peaked at over 5,100 and subsequently plummeted to 1,108 (-78%) over the ensuing 31 months. But now the ugly stepchild index is making an extraordinary comeback into maturity. Since September 2002, near the lows, the NASDAQ has outperformed both the Dow and the S&P 500 indexes by more than a whopping 80%+, excluding dividends.
With the NASDAQ (and NASDAQ 100) hitting a new decade-plus high, are we approaching bubble-esque P/E ratios (price-earnings) of the 2000 era? Not even close. According to Birinyi Associates, the NASDAQ 100 index (QQQ) forward P/E ratio is priced at a reasonable 14x level – much lower than the 100x+ ratios we experienced right before the NASDAQ crash of 2000 and close to the P/E of the S&P 500.
With these NASDAQ indexes hitting new highs, does this tell us they are going to go significantly higher? No, not necessarily…just ask buyers of the NASDAQ in the late 1990s how that strategy worked then. Trying to time the market is a fruitless cause, and will always remain so. A few people will be able to do it occasionally, but doing so on a sustained basis is extremely difficult (if not impossible). If you don’t believe me, just ask Alan Greenspan, former Federal Reserve Chairman, who in 1996 said the tech boom had created “irrational exuberance.” When he made this infamous statement in 1996, the NASDAQ was trading around 1,300 – I guess Greenspan was only off by about another 3,800 points before the exuberance exhausted.
While a significantly outperforming index may not give you information on future prices, leadership indexes and sectors can direct you to fertile areas of research. Trends can be easy to identify, but the heavy lifting and sweat lies in the research of determining whether the trends are sustainable. With the significant outperformance of the NASDAQ index over the last decade it should be no surprise that technology has been leading the index brigade. The NASDAQ composite data is difficult to come by, but with the Technology sector accounting for 65% of the NASDAQ 100 index weighting, it makes sense that this index and sector should not be ignored. Cloud computing, mobility, e-commerce, alternative energy, and nanotechnology are but just a few of the drivers catapulting technology’s prominence in financial markets. Globalization is here to stay and technology is flattening the world so that countries and their populations can participate in the ever-expanding technology revolution.
Investors can continue to myopically focus on the narrow group of 30 Dow stocks and its arbitrary short-term target of 13,000, however those ignoring the leadership of the ugly stepchild index (NASDAQ) should do so at their own peril. Ugliness has a way of turning to beauty when people are not paying attention.
Wade W. Slome, CFA, CFP®
Plan. Invest. Prosper.
DISCLOSURE: Sidoxia Capital Management (SCM) and some of its clients own certain exchange traded funds, including SPY, but at the time of publishing SCM had no direct position in QQQ, or any other security referenced in this article. No information accessed through the Investing Caffeine (IC) website constitutes investment, financial, legal, tax or other advice nor is to be relied on in making an investment or other decision. Please read disclosure language on IC “Contact” page.
The Rule of 20 Can Make You Plenty

There is an endless debate over whether the equity markets are overvalued or undervalued, and at some point the discussion eventually transitions to what the market’s appropriate P/E (Price-Earnings) level should be. There are several standard definitions used for P/Es, but typically a 12-month trailing earnings, 12-month forward earnings (using earnings forecasts), and multi-year average earnings (e.g., Shiller 10-year inflation adjusted P/E – see Foggy P/E Rearview Mirror) are used in the calculations. Don Hays at Hays Advisory (www.haysadvisory.com) provides an excellent 30+ year view of the historical P/E ratio on a forward basis (see chart below).

Blue Line: Forward PE - Red Line: Implied Equilibrium PE (Hays Advisory)
If you listen to Peter Lynch, investor extraordinaire, his “Rule of 20” states a market equilibrium P/E ratio should equal 20 minus the inflation rate. This rule would imply an equilibrium P/E ratio of approximately 18x times earnings when the current 2011 P/E multiple implies a value slightly above 11x times earnings. The bears may claim victory if the earnings denominator collapses, but if earnings, on the contrary, continue coming in better than expected, then the sun might break through the clouds in the form of significant price appreciation.
Just because prices have been chopped in half, doesn’t mean they can’t go lower. From 1966 – 1982 the Dow Jones Industrial index traded at around 800 and P/E multiples contracted to single digits. That rubber band eventually snapped and the index catapulted 17-fold from about 800 to almost 14,000 in 25 years. Even though equities have struggled at the start of this century, a few things have changed from the market lows of 30 years ago. For starters, we have not hit an inflation rate of 13% or a Federal Funds rate of 20% (~3.5% and 0% today, respectively), so we have some headroom before the single digit P/E apocalypse descends upon us.
Fed Model Implies Equity Throttle
Hays Advisory exhibits another key valuation measurement of the equity market (the so-called “Fed Model”), which compares the Treasury yield of the 10-year Note with the earnings yield of stocks (see chart below).

Blue Line: 10-Yr Treasury - Red Line: Forward PE (Hays Advisory)
Regardless of your perspective, the divergence will eventually take care of it in one of three ways:
1.) Bond prices collapse, and Treasury yields spike up to catch up with equity yields.
2.) Forward earnings collapse (e.g., global recession/depression), and equity yields plummet down to the low Treasury yield levels.
AND/OR
3.) Stock prices catapult higher (lower earnings yield) to converge.
At the end of the day, money goes where it is treated best, and at least today, bonds are expected to treat investors substantially worse than the unfaithful treatment of Demi Moore by Ashton Kutcher. The Super Committee may not have its act together, and Europe is a mess, but the significant earnings yield of the equity markets are factoring in a great deal of pessimism.
The holidays are rapidly approaching. If for some reason the auspice of gifts is looking scarce, then review the Fed Model and Rule of 20, these techniques may make you plenty.
Wade W. Slome, CFA, CFP®
Plan. Invest. Prosper.
DISCLOSURE: Sidoxia Capital Management (SCM) and some of its clients own certain exchange traded funds, but at the time of publishing SCM had no direct position in any other security referenced in this article. No information accessed through the Investing Caffeine (IC) website constitutes investment, financial, legal, tax or other advice nor is to be relied on in making an investment or other decision. Please read disclosure language on IC “Contact” page.
Creating Your Investment Dashboard

Navigating the financial markets can be difficult in this volatile environment we’ve experienced over the last few years, which is why it is more important than ever to have a financial dashboard to ensure you do not drive off a cliff. If investors do not have the time or focus to drive their financial future, then perhaps for the safety of themselves and others, they may consider taking the bus or hiring a chauffeur. For those committed to handling their finances on their own, the road may become rocky, so here are some important factors to monitor on your financial dashboard:
1) Fundamental Direction: Before you decide on an investment destination, it is important to know whether trends are accelerating (speeding up) or deteriorating (slowing down) – see also Forecasting – Trend Analysis.
2) Are You Going the Speed limit? Nobody wants to get a costly speeding ticket, therefore assessing valuation metrics on your dashboard is a beneficiary tool. If you are speeding along the highway at a 100 miles per hour in an expensive stock (e.g., trading at a 50x+ Price/Earnings multiple), then there is little room for error. When traveling that fast you can forget about the price of a speeding ticket, because hitting a pothole at those speeds (valuation) can be much more costly to your portfolio, if you are not careful.
3) Temperature Outside: There’s a huge difference between driving in the icy-cold snow and in 100 degree heat. Each environment has its own challenges. The same principle applies to the financial markets. On occasion, sentiment can become red hot, forcing heightened caution, whereas during other periods, chilling fear can scare everyone else off the roads, leaving clear sailing ahead.
4) Optimal Tire Pressure: Low pressure or bald tires can lead to treacherous driving conditions. A company with healthy cash flow generation relative to its market capitalization can make your investment ride a lot more stable (see also Cash Flow Register). Dividends and share buybacks are generated from healthy and stable cash flows…not earnings.
5) Driver Skill Level: People generally believe they are better than average drivers, however statistics tell a different story. By definition, half of all drivers must be below average. If you are going to put your life’s retirement assets into stocks, you might as well select those companies led by seasoned management teams with proven track records.
Many investors drive blindly without relying on a dashboard. In the investment world, visibility is not very clear. Often, weather conditions in the financial markets become rainy, dark, and/or foggy. If you don’t want your portfolio to crash, it makes sense to build a reliable dashboard to navigate through the hazardous investment road conditions.
Wade W. Slome, CFA, CFP®
Plan. Invest. Prosper.
DISCLOSURE: Sidoxia Capital Management (SCM) and some of its clients own certain exchange traded funds, but at the time of publishing SCM had no direct position in any other security referenced in this article. No information accessed through the Investing Caffeine (IC) website constitutes investment, financial, legal, tax or other advice nor is to be relied on in making an investment or other decision. Please read disclosure language on IC “Contact” page.


