Posts tagged ‘PE ratio’
Brain or Machine? Investing Holy Grail

Source: Photobucket
Paul Meehl was a versatile academic who held numerous faculty positions, covering the diverse disciplines of psychology, law, psychiatry, neurology, and yes, even philosophy. The crux of his research was focused on how well clinical analysis fared versus statistical analysis. Or in other words, he looked to answer the controversial question, “What is a better predictor of outcomes, a brain or an equation?” His conclusion was straightforward – mechanical methods using quantitative measures are much more efficient than the professional judgments of humans in coming to more accurate predictions.
Those who have read my book, How I Managed $20,000,000,000.00 by Age 32 know where I stand on this topic – I firmly believe successful investing requires a healthy balance between both art and science (i.e., “brain and equation”). A trader who only relies on intuition and his gut to make all of his/her decisions is likely to fall on their face. On the other hand, a quantitative engineer’s sole dependence on a robotic multi-factor model to make trades is likely to fail too. My skepticism is adequately outlined in my Butter in Bangladesh article, which describes how irrational statistical games can be misleading and overused.
As much as I would like to attribute all of my investment success to my brain, the emotion-controlling power of numbers has played an important role in my investment accomplishments as well. The power of numbers simply cannot be ignored. More than 50 years after Paul Meehl’s seminal research was published, about two hundred studies comparing brain power versus statistical power have shown that machines beat brains in predictive accuracy in the majority of cases. Even when expert judgments have won over formulas, human consistency and reliability have muddied the accuracy of predictions.
Daniel Kahneman, a Nobel Prize winner in Economics, highlights another important decision making researcher, Robyn Dawes. What Dawes discovers in her research is that the fancy and complex multiple regression methods used in conventional software adds little to no value in the predictive decision-making process. Kahneman describes Dawes’s findings more specifically here:
“A formula that combines these predictors with equal weights is likely to be just as accurate in predicting new cases as the multiple-regression formula…Formulas that assign equal weights to all the predictors are often superior, because they are not affected by accidents of sampling…It is possible to develop useful algorithms without any prior statistical research. Simple equally weighted formulas based on existing statistics or on common sense are often very good predictors of significant outcomes.”
The results of Dawes’s classic research have significant application to the field of stock picking. As a matter of fact, this type of research has had a significant impact on Sidoxia’s stock selection process.
How Sweet It Is!

In the emotional roller-coaster equity markets we’ve experienced over the last decade or two, overreliance on gut-driven sentiments in the investment process has left masses of casualties in the wake of losses. If you doubt the destructive after-effects on investors’ psyches, then I urge you to check out my Fund Flow Paradox article that shows the debilitating effects of volatility on investors’ behavior.
In order to more objectively exploit investment opportunities, the Sidoxia Capital Management investment team has successfully formed and utilized our own proprietary quantitative tool. The results were so sweet, we decided to call it SHGR (pronounced “S-U-G-A-R”), or Sidoxia Holy Grail Ranking.
My close to two decades of experience at William O’Neil & Co., Nicholas Applegate, American Century Investments, and now Sidoxia Capital Management has allowed me to build a firm foundation of growth investing competency – however understanding growth alone is not sufficient to succeed. In fact, growth investing can be hazardous to your investment health if not kept properly in check with other key factors.
Here are some of the key factors in our Sidoxia SHGR ranking system:
Valuation:
- Free cash flow yield
- Price/earnings ratio
- PEG ratio
- Dividend yield
Quality:
- Financials: Profit margin trends; balance sheet leverage
- Management Team: Track record; capital stewardship
- Market Share: Industry position; runway for growth
Contrarian Sentiment Indicators:
- Analyst ratings
- Short interest
Growth:
- Earnings growth
- Sales growth
Our proprietary SHGR ranking system not only allows us to prioritize our asset allocation on existing stock holdings, but it also serves as an efficient tool to screen new ideas for client portfolio additions. Most importantly, having a quantitative model like Sidoxia’s Holy Grail Ranking system allows investors to objectively implement a disciplined investment process, whether there is a presidential election, Fiscal Cliff, international fiscal crisis, slowing growth in China, and/or uncertain tax legislation. At Sidoxia we have managed to create a Holy Grail machine, but like other quantitative tools it cannot replace the artistic powers of the brain.

Wade W. Slome, CFA, CFP®
Plan. Invest. Prosper.
DISCLOSURE: Sidoxia Capital Management (SCM) and some of its clients own certain exchange traded funds, but at the time of publishing SCM had no direct position in any other security referenced in this article. No information accessed through the Investing Caffeine (IC) website constitutes investment, financial, legal, tax or other advice nor is to be relied on in making an investment or other decision. Please read disclosure language on IC “Contact” page.
NASDAQ Redux

The NASDAQ Composite index once again crossed the psychologically, all-important 5,000 threshold this week for the first time since the infamous tech-bubble burst in the year 2000. Of course, naturally, the media jumped on a non-stop, multi-day offensive comparing and contrasting today’s NASDAQ vs. the NASDAQ twin of yesteryear. Rather than rehash the discussion once again, I have decided to post three articles I published in recent years on the topic covering the outperformance of the spotlighted, tech-heavy index.
NASDAQ 5,000 Irrational Exuberance Déjà Vu?

Investors love round numbers and with the Dow Jones Industrial index recently piercing 17,000 and the S&P 500 index having broken 2,000 , even novice investors have something to talk about around the office water cooler. While new all-time records are being set for the major indices during September, the unsung, tech-laden NASDAQ index has yet to surpass its all-time high of 5,132 achieved 14 and ½ years ago during March of 2000.
Click Here to Read the Rest of the Article
NASDAQ and the R&D Tech Revolution

It’s been a bumpy start for stocks so far in 2014, but the fact of the matter is the NASDAQ Composite Index is up this year and hit a 14-year high in the latest trading session (highest level since 2000). The same cannot be said for the Dow Jones Industrial and S&P 500 indices, which are both lagging and down for the year. Not only did the NASDAQ outperform the Dow by almost +12% in 2013, but the NASDAQ has also trounced the Dow by over +70% over the last five years.
Click Here to Read the Rest of the Article
NASDAQ: The Ugly Stepchild

All the recent media focus has been fixated on whether the Dow Jones Industrial Average index (“The Dow”) will close above the 13,000 level. In the whole scheme of things, this specific value doesn’t mean a whole lot, but it does make for a great topic of conversation at a cocktail party. Today, the Dow is trading at 12,983, a level not achieved in more than three and a half years. Not a bad accomplishment, given the historic financial crisis on our shores and the debacle going on overseas, but I’m still not so convinced a miniscule +0.1% move in the Dow means much. While the Dow and the S&P 500 indexes garner the hearts and minds of journalists and TV reporters, the ugly stepchild index, the NASDAQ, gets about as much respect as Rodney Dangerfield (see also No Respect in the Investment World).
Click Here to Read the Rest of the Article

Wade W. Slome, CFA, CFP®
Plan. Invest. Prosper.
DISCLOSURE: Sidoxia Capital Management (SCM) and some of its clients hold positions in certain exchange traded funds (ETFs) , but at the time of publishing, SCM had no direct position in any other security referenced in this article. No information accessed through the Investing Caffeine (IC) website constitutes investment, financial, legal, tax or other advice nor is to be relied on in making an investment or other decision. Please read disclosure language on IC Contact page.
Why Buy at Record Highs? Ask the Fat Turkey

This article is an excerpt from a previously released Sidoxia Capital Management complementary newsletter (December 1, 2014). Subscribe on the right side of the page for the complete text.
I’ve fulfilled my American Thanksgiving duty by gorging myself on multiple helpings of turkey, mash potatoes, and pumpkin pie. Now that I have loosened my belt a few notches, I have had time to reflect on the generous servings of stock returns this year (S&P 500 index up +11.9%), on top of the whopping +104.6% gains from previous 5 years (2009-2013).
Conventional wisdom believes the Federal Reserve has artificially inflated the stock market. Given the perceived sky-high record stock prices, many investors are biting their nails in anticipation of an impending crash. The evidence behind the nagging investor skepticism can be found in the near-record low stock ownership statistics; dismal domestic equity fund purchases; and apathetic investor survey data (see Market Champagne Sits on Ice).
Turkey-lovers are in a great position to understand the predicted stock crash expected by many of the naysayers. As you can see from the chart below, the size of turkeys over the last 50+ years has reached a record weight – and therefore record prices per turkey:
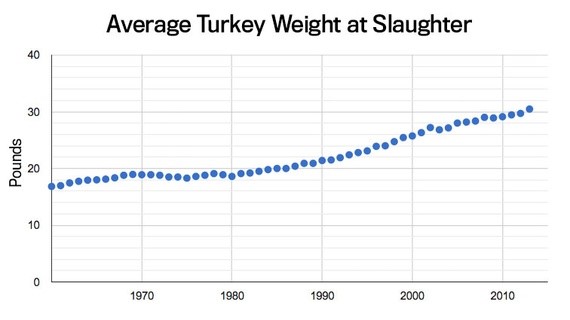
Source: The Atlantic
Does a record size in turkeys mean turkey meat prices are doomed for an imminent price collapse? Absolutely not. A key reason turkey prices have hit record levels is because Thanksgiving stomachs have been buying fatter and fatter turkeys every year. The same phenomenon is happening in the stock market. The reason stock prices have continued to move higher and higher is because profits have grown fatter and fatter every year (see chart below). Profits in corporate America have never been higher. CEOs are sitting on trillions of dollars of cash, and providing stock-investors with growing plump dividends (see also The Gift that Keeps on Giving), $100s of billions in shareholder friendly stock buybacks, while increasingly taking leftover profits to invest in growth initiatives (e.g., technology investments, international expansion, and job hiring).
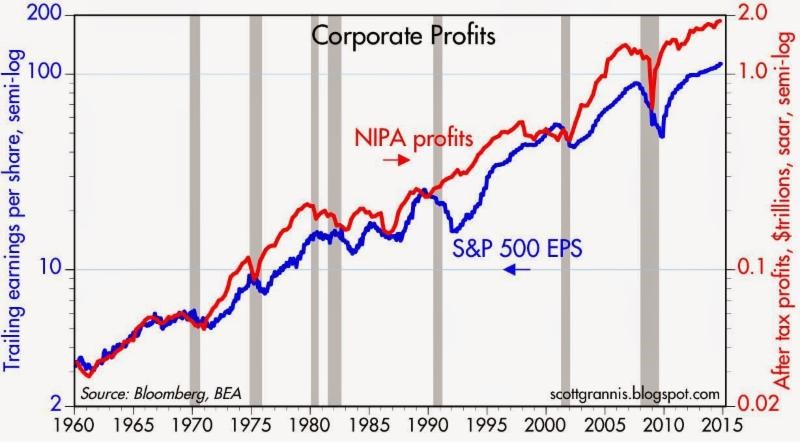
Source: Calafia Beach Pundit
Despite record turkey prices, I will make the bold prediction that hungry Americans will continue to buy turkey. More important than the overall price paid per turkey, the statistic that consumers should be paying more attention to is the turkey price paid per pound. Based on that more relevant metric, the data on turkey prices is less conclusive. In fact, turkey prices are estimated to be -13% cheaper this year on a per pound basis compared to last year ($1.58/lb vs. $1.82/lb).
The equivalent price per pound metric in the stock market is called the Price-Earnings (P/E) ratio, which is the price paid by a stock investor per $1 of profits (or earnings). Today that P/E ratio sits at approximately 17.5x. As you can see from the chart below, the current P/E ratio is reasonably near historical averages experienced over the last 50+ years. While, all else equal, anyone would prefer paying a lower price per pound (or price per $1 in earnings), any objective person looking at the current P/E ratio would have difficulty concluding recent stock prices are in “bubble” territory.
However, investor doubters who have missed the record bull run in stock market prices over the last five years (+210% since early 2009) have clung to a distorted, overpriced measurement called the CAPE or Shiller P/E ratio. Readers of my Investing Caffeine blog or newsletters know why this metric is misleading and inaccurate (see also Shiller CAPE Peaches Smell).
Don’t Be an Ostrich

While prices of stocks arguably remain reasonably priced for many Baby Boomers and retirees, the conclusion should not be to gorge 100% of investment portfolios into stocks. Quite the contrary. Everyone’s situation is unique, and every investor should customize a globally diversified portfolio beyond just stocks, including areas like fixed income, real estate, alternative investments, and commodities. But the exposures don’t stop there, because in order to truly have the diversified shock absorbers in your portfolio necessary for a bumpy long-term ride, investors need exposure to other areas. Such areas should include international and emerging market geographies; a diverse set of styles (e.g., Value, Growth, Blue Chip dividend-payers); and a healthy ownership across small, medium, and large equities. The same principles apply to your bond portfolio. Steps need to be taken to control credit risk and interest rate risk in a globally diversified fashion, while also providing adequate income (yield) in an environment of generationally low interest rates.
While I’ve spent a decent amount of time talking about eating fat turkeys, don’t let your investment portfolio become stuffed. The year-end time period is always a good time, after recovering from a food coma, to proactively review your investments. While most non-vegetarians love eating turkey, don’t be an investment ostrich with your head in the sand – now is the time to take actions into your own hands and make sure your investments are properly allocated.
Wade W. Slome, CFA, CFP®
Plan. Invest. Prosper.
DISCLOSURE: Sidoxia Capital Management (SCM) and some of its clients own a range of positions in certain exchange traded fund positions, but at the time of publishing SCM had no direct position in any other security referenced in this article. No information accessed through the Investing Caffeine (IC) website constitutes investment, financial, legal, tax or other advice nor is to be relied on in making an investment or other decision. Please read disclosure language on IC Contact page.
Mathematics 101: The Cheap Money Printing Machine

Like many other bloggers and pundits, I have amply pontificated on the relative attractiveness of the stock market. For years, cash and gold hoarding bears have clung to the distorted, money-losing Shiller CAPE P/E ratio (see CAPE Smells Like B.S.), which has incorrectly signaled investors to stay out of stocks and miss trillions of dollars in price appreciation. Apparently, the ironclad Shiller CAPE device has been temporarily neutralized by the Federal Reserve’s artificially cheapening money printing press policies, just like Superman’s strength being stripped by the nullifying powers of kryptonite. The money printing logic seems so elegantly sound, I felt compelled to encapsulate this powerful relationship in an equation:
Interests Rate Cuts + Printing Press On = Stocks Go Higher
Wow, amazing…this is arithmetic any investor (or 3rd grader) could appreciate! Fortunately for me, I have a child in elementary school, so I became emboldened to share my new found silver bullet equation. I initially received a few raised eyebrows from my child when I introduced the phrase “Quantitative Easing” but it didn’t take long before she realized Rate Cuts + QE = Fat Piggy Bank.
After the intensive tutorial, I felt so very proud. With a smile on my face, I gave myself a big pat on the back, until I heard my child say, “Daddy, after looking at this squiggly S&P 500 line from 2007-2014, can you help my brain understand because I have some questions.”
Here is the subsequent conversation:
Me: “Sure kiddo, go ahead shoot…what can I answer for you?”
Child: “Daddy, if the Federal Reserve is so powerful and you should “not fight the Fed,” how come stock prices went down by -58% from 2007 – 2009, even though the Fed cut rates from 5.25% to 0%?”
Me: “Uhhhh….”
Child: “Daddy, if stock prices went down so much after massive rate cuts, does that mean stock prices will go up when the Fed increases rates?”
Me: “Uhhhh….”
Child: “Daddy, if Quantitative Easing is good for stock prices, how come after the QE1 announcement in November 2008, stock prices continued to go down -25%?”
Me: “Uhhhh….”
Child: “Daddy, if QE makes stocks go up, how come stock prices are at all-time record highs after the Fed has cut QE by -$70 billion per month and is completely stopping QE by 100% next month?”
Me: “Uhhhh….”
Child: “Daddy, everyone is scared of rate increases but when the Fed increased interest rates by 250 basis points in 1994, didn’t stock prices stay flat for the year?”
Me: “Uhhhh….” (See also 1994 Bond Repeat)
What started as a confident conversation about my bullet-proof mathematical equation ended up with me sweating bullets.
Math 101A: Low Interest Rates = Higher Asset Prices
As my previous conversation highlights, the relationship between rate cuts and monetary policy may not be as clear cut as skeptics would like you to believe. Although I enjoy the widely covered Shiller CAPE discussions on market valuations, somehow the media outlets fail to make the all-important connection between interest rates and P/E ratios.
One way of framing the situation is by asking a simple question:
Would you rather have $100 today or $110 a year from now?
The short answer is…”it depends.” All else equal, the level of interest rates will ultimately determine your decision. If interest rates are offering 20%, a rational person would select the $100 today, invest the money at 20%, and then have $120 a year from now. On the other hand, if interest rates were 0.5%, a rational person would instead select the option of receiving $110 a year from now because collecting a $100 today and investing at 0.5% would only produce $100.50 a year from now.
The same time-value-of-money principle applies to any asset, whether you are referring to gold, cars, houses, private businesses, stocks, or other assets. The mathematical fact is, all else equal, a rational person will always pay more for an asset when interest rates are low, and pay less when interest rates are high. As the 200-year interest chart below shows, current long-term interest rates are near all-time lows.
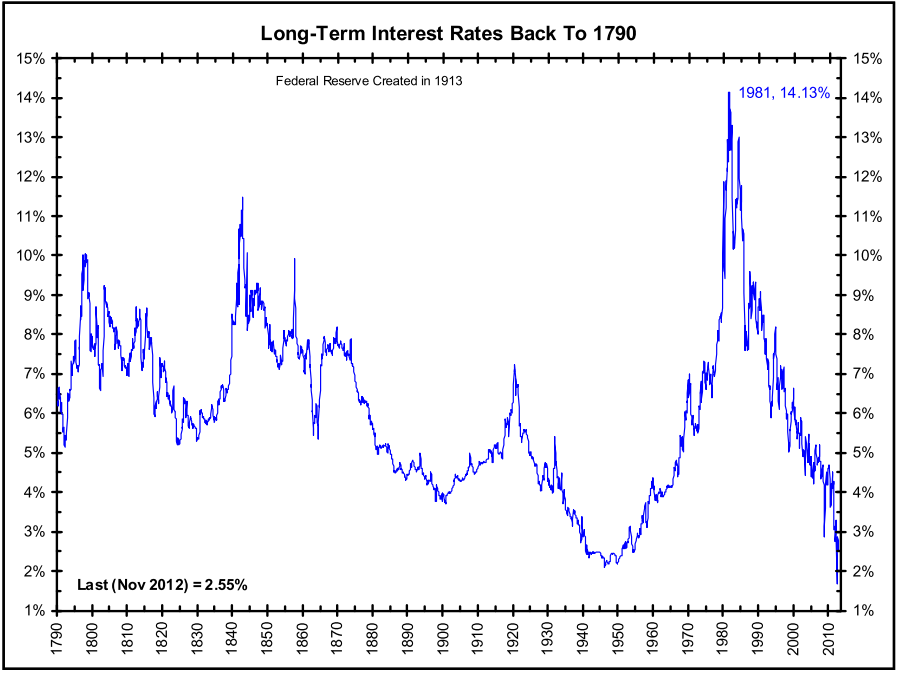
Source: The Big Picture
The peak in interest rates during the early 1980s correlated with a single digit P/E ratio (~8x). The current P/E ratio is deservedly higher (~16x), but it is dramatically lower than the 30x+ P/E ratio realized in the 2000 year timeframe. If none of this discussion makes sense, consider the simple Rule of 20 (see also The Rule of 20 Can Make You Plenty), which states as a simple rule-of-thumb, the average market P/E ratio should be equal to 20 minus the level inflation. With inflation currently averaging about 2%, the Rule of 20 implies an equilibrium of ~18x. If you assume this P/E multiple and factor in a 7-8% earnings growth rate, you could legitimately argue for 20% appreciation in the market to S&P 2,400 over a 12-month period. It’s true, a spike in interest rates, combined with a deceleration in earnings would justify a contraction in stock prices, but even under this scenario, current index values are nowhere near the bubble levels of 2000.
After six long years, the QE train is finally grinding to a halt, and a return towards Fed policy normalcy could be rapidly approaching. Many investors and skeptical bears have tried to rationalize the tripling in the market from early 2009 as solely due to the cheap Fed money printing machine. Unfortunately, history and mathematics don’t support that assertion. If you don’t believe me, perhaps a child may be able to explain it to you better.
Wade W. Slome, CFA, CFP®
Plan. Invest. Prosper.
DISCLOSURE: Sidoxia Capital Management (SCM) and some of its clients own a range of positions in certain exchange traded fund positions, but at the time of publishing SCM had no direct position in any other security referenced in this article. No information accessed through the Investing Caffeine (IC) website constitutes investment, financial, legal, tax or other advice nor is to be relied on in making an investment or other decision. Please read disclosure language on IC Contact page.
Stocks Take a Breather after Long Sprint

Like a sprinter running a long sprint, the stock market eventually needs to take a breather too, and that’s exactly what investors experienced this week as they witnessed the Dow Jones Industrial Average face its largest drop of 2013 (down -2.2%) – and also the largest weekly slump since 2012. Runners, like financial markets, sooner or later suffer fatigue, and that’s exactly what we’re seeing after a relatively unabated +27% upsurge over the last nine months. Does a -2% hit in one week feel pleasant? Certainly not, but before the next race, the markets need to catch their breath.
By now, investors should not be surprised that pitfalls and injuries are part of the investment racing game – something Olympian Mary Decker Slaney can attest to as a runner (see 1984 Olympic 3000m final against Zola Budd). As I have pointed out in previous articles (Most Hated Bull Market), the almost tripling in stock prices from the 2009 lows has not been a smooth, uninterrupted path-line, but rather investors have endured two corrections averaging -20% and two other drops approximating -10%. Instead of panicking by locking in damaging transaction costs, taxes, and losses, it is better to focus on earnings, cash flows, valuations, and the relative return available in alternative asset classes. With generationally low interest rates occurring over recent periods, the available subset of attractive investment opportunities has narrowed (see Confessions of a Bond Hater), leaving many investing racers to default to stocks.
Recent talk of potential Federal Reserve bond purchase “tapering” has led to a two-year low in bond prices and caused a mini spike in interest rates (10-year Treasury note currently yielding +2.83%). At the margin, this trend makes bonds more attractive (lower prices), but as you can see from the chart below, interest rates are still relatively close to historically low yields. For the time being, this still makes domestic equities an attractive asset class.
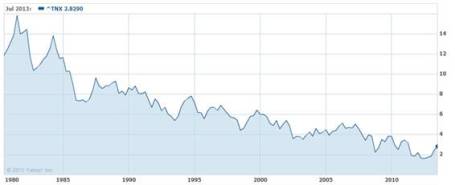
Source: Yahoo! Finance
Price Follows Earnings
The simple but true axiom that stock prices follow earnings over the long-run is just as true today as it was a century ago. Interest rates and price-earnings ratios can also impact stock prices. To illustrate my argument, let’s talk baseball. Wind, rain, and muscle (interest rates, PE ratios, political risk, etc.) are factors impacting the direction of a thrown baseball (stock prices), but gravity is the key factor influencing the ultimate destination of the baseball. Long-term earnings growth is the equivalent factor to gravity when talking about stock prices.
To buttress my point that stock prices following long-term earnings, consider the fact that S&P 500 annualized operating earnings bottomed in 2009 at $39.61. Since that point, annualized earnings through the second quarter of 2013 (~94% of companies reported results) have reached $99.30, up +151%. S&P 500 stock prices bottomed at 666 in 2009, and today the index sits at 1655, +148%. OK, so earnings are up +151% and stock prices are up +148%. Coincidence? Perhaps not.
If we take a closer look at earnings, the deceleration of earnings growth is unmistakable (see Financial Times chart below), yet the S&P 500 index is still up +16% this year, excluding dividends. In reality, predicting multiple expansion or contraction is nearly impossible. For example, earnings in the S&P 500 grew an incredible +15% in 2011, yet stock prices were anemically flat for that year, showing no price appreciation (+0.0%). Since the end of 2011, earnings have risen a meager +3%, however stock prices have catapulted +32%. Is this multiple expansion sustainable? Given stock P/E ratios remain in a reasonable 15-16x range, according to forward and trailing earnings, there is some room for expansion, but the low hanging fruit has been picked and further double-digit price appreciation will require additional earnings growth.
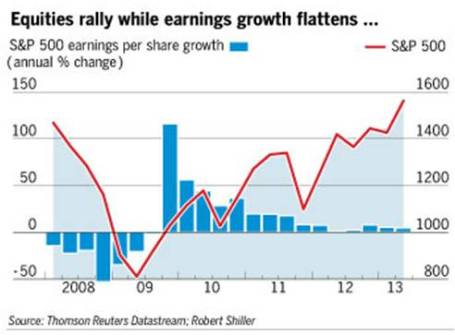
Source: Financial Times
But stocks should not be solely looked through a domestic lens…there is another 95% of the world’s population slowly embracing capitalism and democracy to fuel future dynamic earnings growth. At Sidoxia (www.Sidoxia.com), we are finding plenty of opportunities outside our U.S. borders, including alternative asset classes.
The investment race continues, and taking breathers is part of the competition, especially after long sprints. Rather than panic, enjoy the respite.
Wade W. Slome, CFA, CFP®
Plan. Invest. Prosper.
DISCLOSURE: Sidoxia Capital Management (SCM) and some of its clients hold positions in certain exchange traded funds (ETFs), but at the time of publishing, SCM had no direct position in any other security referenced in this article. No information accessed through the Investing Caffeine (IC) website constitutes investment, financial, legal, tax or other advice nor is to be relied on in making an investment or other decision. Please read disclosure language on IC Contact page.
The Central Bank Dog Ate My Homework

It’s been a painful four years for the bears, including Peter Schiff, Nouriel Roubini, John Mauldin, Jimmy Rogers, and let’s not forget David Rosenberg, among others. Rosenberg was recently on CNBC attempting to clarify his evolving bearish view by explaining how central banks around the globe have eaten his forecasting homework. In other words, Ben Bernanke is getting blamed for launching the stock market into the stratosphere thanks to his quantitative easing magic. According to Rosenberg, and the other world-enders, death and destruction would have prevailed without all the money printing.
In reality, the S&P 500 has climbed over +140% and is setting all-time record highs since the market bottomed in early 2009. Despite the large volume of erroneous predictions by Rosenberg and his bear buddies, that development has not slowed the pace of false forecasts. When you’re wrong, one could simply admit defeat, or one could get creative like Rosenberg and bend the truth. As you can tell from my David Rosenberg article from 2010 (Rams Butting Heads), he has been bearish for years calling for outcomes like a double-dip recession; a return to 11% unemployment; and a collapse in the market. So far, none of those predictions have come to fruition (in fact the S&P is up about +40% from that period, if you include dividends). After being incorrect for so long, Rosenberg has switched his mantra to be bullish on pullbacks on selective dividend-paying stocks. When pushed whether he has turned bullish, here’s what Rosenberg had to say,
“So it’s not about is somebody bearish or is somebody bullish or whether you’re agnostic, it’s really about understanding what the principle driver of this market is…it’s the mother of all liquidity-driven rallies that I’ve seen in my lifetime, and it’s continuing.”
Rosenberg isn’t the only bear blaming central banks for the unexpected rise in equity markets. As mentioned previously, fear and panic have virtually disappeared, but these emotions have matured into skepticism. Record profits, cash balances, and attractive valuations are dismissed as artificial byproducts of a Fed’s monetary Ponzi Scheme. The fact that Japan and other central banks are following Ben Bernanke’s money printing lead only serves to add more fuel to the bears’ proverbial fire.
Speculative bubbles are not easy to identify before-the-fact, however they typically involve a combination of excessive valuations and/or massive amounts of leverage. In hindsight we experienced these dynamics in the technology collapse of the late-1990s (tech companies traded at over 100x’s earnings) and the leverage-induced housing crisis of the mid-2000s ($100s of billions used to speculate on subprime mortgages and real estate).
I’m OK with the argument that there are trillions of dollars being used for speculative buying, but if I understand correctly, the trillions of dollars in global liquidity being injected by central banks across the world is not being used to buy securities in the stock market? Rather, all the artificial, pending-bubble discussions should migrate to the bond market…not the stock market. All credit markets, to some degree, are tied to the trillions of Treasuries and mortgage-backed securities purchased by central banks, yet many pundits (i.e., see El-Erian & Bill Gross) choose to focus on claims of speculative buying in stocks, and not bonds.
While bears point to the Shiller 10 Price-Earnings ratio as evidence of a richly priced stock market, more objective measurements through FactSet (below 10-year average) and Wall Street Journal indicate a forward P/E of around 14. A reasonable figure if you consider the multiples were twice as high in 2000, and interest rates are at a generational low (see also Shiller P/E critique).
The news hasn’t been great, volatility measurements (i.e., VIX) have been signaling complacency, and every man, woman, and child has been waiting for a “pullback” – myself included. The pace of the upward advance we have experienced over the last six months is not sustainable, but when we finally get a price retreat, do not listen to the bears like Rosenberg. Their credibility has been shot, ever since the central bank dog ate their homework.
Wade W. Slome, CFA, CFP®
Plan. Invest. Prosper.
DISCLOSURE: Sidoxia Capital Management (SCM) and some of its clients hold positions in certain exchange traded funds (ETFs) , but at the time of publishing SCM had no direct position in any other security referenced in this article. No information accessed through the Investing Caffeine (IC) website constitutes investment, financial, legal, tax or other advice nor is to be relied on in making an investment or other decision. Please read disclosure language on IC Contact page.
Sifting Through the Earnings Rubble

An earthquake of second quarter earnings results have rocked the markets (better than expected earnings but sluggish revenues), and now investors are left to sift through the rubble. With thousands of these earnings reports rolling in (and many more in the coming weeks), identifying the key investment trends across sectors, industries, and geographies can be a challenging responsibility. If this was an easy duty, I wouldn’t have a job! Fortunately, having a disciplined process to sort through the avalanche of quarterly results can assist you in discovering both potential threats and opportunities.
But first things first: You will need some type of reliable screening tool in order to filter find exceptional stocks. According to Reuters, there are currently more than 46,000 stocks in existence globally. Manually going through this universe one stock at a time is not physically or mentally feasible for any human to accomplish, over any reasonable amount of time. I use several paid-service screening tools, but there are plenty of adequate free services available online as well.
Investing with the 2-Sided Coin

As Warren Buffett says, “Value and growth are two sides of the same coin.” Having a disciplined screening process in place is the first step in finding those companies that reflect the optimal mix between growth and value. I am willing to pay an elevated price (i.e., higher P/E ratio) for a company with a superior growth profile, but I want a more attractive value (i.e., cheaper price) for slower growth companies. I am fairly agnostic between the mix of the growth/value weighting dynamics, as long as the risk-reward ratio is in my favor.
Since I firmly believe that stock prices follow the long-term trajectory of earnings and cash flows, I fully understand the outsized appreciation opportunities that can arise from the “earnings elite” – the cream of the crop companies that are able to sustain abnormally high earnings growth. Or put in baseball terms, you can realize plenty of singles and doubles by finding attractively priced growth companies, but as Hall of Fame manager Earl Weaver says, “You win many more games by hitting a three-run homer than you do with sacrifice bunts.” The same principles apply in stock picking. Legendary growth investor Peter Lynch (see also Inside the Brain of an Investing Genius) is famous for saying, “You don’t need a lot of good hits every day. All you need is two to three goods stocks a decade.”
Some past successful Sidoxia Capital Management examples that highlight the tradeoff between growth and value include Wal-Mart stores (WMT) and Amazon.com (AMZN). Significant returns can be achieved from slower, mature growth companies like Wal-Mart if purchased at the right prices, but multi-bagger home-run returns (i.e., more than doubling) require high octane growth from the likes of global internet platform companies. Multi-bagger returns from companies like Amazon, Apple Inc. (AAPL), and others are difficult to find and hold in a portfolio for years, but if you can find a few, these winners can cure a lot of your underperforming sins.
Defining Growth
Fancy software may allow you to isolate those companies registering superior growth in sales, earnings, and cash flows, but finding the fastest growing companies can be the most straightforward part. The analytical heavy-lifting goes into effect once an investor is forced to determine how sustainable that growth actually is, while simultaneously determining which valuation metrics are most appropriate in determining fair value. Some companies will experience short-term bursts of growth from a single large contract; from acquisitions; and/or from one-time asset sale gains. Generally speaking, this type of growth is less valuable than growth achieved by innovative products, service, and marketing.
The sustainability of growth will also be shaped by the type of industry a company operates in along with the level of financial leverage carried. For instance, in certain volatile, cyclical industries, sequential growth (e.g. the change in results over the last three months) is the more relevant metric. However for most companies that I screen, I am looking to spot the unique companies that are growing at the healthiest clip on a year-over-year basis. These recent three month results are weighed against the comparable numbers a year ago. This approach to analyzing growth removes seasonality from the equation and helps identify those unique companies capable of growing irrespective of economic cycles.
Given that we are a little more than half way through Q2 earnings results, there is still plenty of time to find those companies reporting upside fundamental earnings surprises, while also locating those quality companies unfairly punished for transitory events. Now’s the time to sift through the earnings rubble to find the remaining buried stock gems.
Wade W. Slome, CFA, CFP®
Plan. Invest. Prosper.
DISCLOSURE: Sidoxia Capital Management (SCM) and some of its clients own certain exchange traded funds and WMT, AMZN, AAPL, but at the time of publishing SCM had no direct position in any other security referenced in this article. No information accessed through the Investing Caffeine (IC) website constitutes investment, financial, legal, tax or other advice nor is to be relied on in making an investment or other decision. Please read disclosure language on IC “Contact” page.
Investing Holy Grail: Brain or Machine?
Source: Photobucket
Paul Meehl was a versatile academic who held numerous faculty positions, covering the diverse disciplines of psychology, law, psychiatry, neurology, and yes, even philosophy. The crux of his research was focused on how well clinical analysis fared versus statistical analysis. Or in other words, he looked to answer the controversial question, “What is a better predictor of outcomes, a brain or an equation?” His conclusion was straightforward – mechanical methods using quantitative measures are much more efficient than the professional judgments of humans in coming to more accurate predictions.
Those who have read my book, How I Managed $20,000,000,000.00 by Age 32 know where I stand on this topic – I firmly believe successful investing requires a healthy balance between both art and science (i.e., “brain and equation”). A trader who only relies on intuition and his gut to make all of his/her decisions is likely to fall on their face. On the other hand, a quantitative engineer’s sole dependence on a robotic multi-factor model to make trades is likely to fail too. My skepticism is adequately outlined in my Butter in Bangladesh article, which describes how irrational statistical games can be misleading and overused.
As much as I would like to attribute all of my investment success to my brain, the emotion-controlling power of numbers has played an important role in my investment accomplishments as well. The power of numbers simply cannot be ignored. More than 50 years after Paul Meehl’s seminal research was published, about two hundred studies comparing brain power versus statistical power have shown that machines beat brains in predictive accuracy in the majority of cases. Even when expert judgments have won over formulas, human consistency and reliability have muddied the accuracy of predictions.
Daniel Kahneman, a Nobel Prize winner in Economics, highlights another important decision making researcher, Robyn Dawes. What Dawes discovers in her research is that the fancy and complex multiple regression methods used in conventional software adds little to no value in the predictive decision-making process. Kahneman describes Dawes’s findings more specifically here:
“A formula that combines these predictors with equal weights is likely to be just as accurate in predicting new cases as the multiple-regression formula…Formulas that assign equal weights to all the predictors are often superior, because they are not affected by accidents of sampling…It is possible to develop useful algorithms without any prior statistical research. Simple equally weighted formulas based on existing statistics or on common sense are often very good predictors of significant outcomes.”
The results of Dawes’s classic research have significant application to the field of stock picking. As a matter of fact, this type of research has had a significant impact on Sidoxia’s stock selection process.
How Sweet It Is!
In the emotional roller-coaster equity markets we’ve experienced over the last decade or two, overreliance on gut-driven sentiments in the investment process has left masses of casualties in the wake of losses. If you doubt the destructive after-effects on investors’ psyches, then I urge you to check out my Fund Flow Paradox article that shows the debilitating effects of volatility on investors’ behavior.
In order to more objectively exploit investment opportunities, the Sidoxia Capital Management investment team has successfully formed and utilized our own proprietary quantitative tool. The results were so sweet, we decided to call it SHGR (pronounced “S-U-G-A-R”), or Sidoxia Holy Grail Ranking.
My close to two decades of experience at William O’Neil & Co., Nicholas Applegate, American Century Investments, and now Sidoxia Capital Management has allowed me to build a firm foundation of growth investing competency – however understanding growth alone is not sufficient to succeed. In fact, growth investing can be hazardous to your investment health if not kept properly in check with other key factors.
Here are some of the key factors in our Sidoxia SHGR ranking system:
Valuation:
- Free cash flow yield
- Price/earnings ratio
- PEG ratio
- Dividend yield
Quality:
- Financials: Profit margin trends; balance sheet leverage
- Management Team: Track record; capital stewardship
- Market Share: Industry position; runway for growth
Contrarian Sentiment Indicators:
- Analyst ratings
- Short interest
Growth:
- Earnings growth
- Sales growth
Our proprietary SHGR ranking system not only allows us to prioritize our asset allocation on existing stock holdings, but it also serves as an efficient tool to screen new ideas for client portfolio additions. Most importantly, having a quantitative model like Sidoxia’s Holy Grail Ranking system allows investors to objectively implement a disciplined investment process, whether there is a presidential election, Fiscal Cliff, international fiscal crisis, slowing growth in China, and/or uncertain tax legislation. At Sidoxia we have managed to create a Holy Grail machine, but like other quantitative tools it cannot replace the artistic powers of the brain.
Wade W. Slome, CFA, CFP®
Plan. Invest. Prosper.
DISCLOSURE: Sidoxia Capital Management (SCM) and some of its clients own certain exchange traded funds, but at the time of publishing SCM had no direct position in any other security referenced in this article. No information accessed through the Investing Caffeine (IC) website constitutes investment, financial, legal, tax or other advice nor is to be relied on in making an investment or other decision. Please read disclosure language on IC “Contact” page.
NASDAQ: The Ugly Stepchild Index
All the recent media focus has been fixated on whether the Dow Jones Industrial Average index (“The Dow”) will close above the 13,000 level. In the whole scheme of things, this specific value doesn’t mean a whole lot, but it does make for a great topic of conversation at a cocktail party. Today, the Dow is trading at 12,983, a level not achieved in more than three and a half years. Not a bad accomplishment, given the historic financial crisis on our shores and the debacle going on overseas, but I’m still not so convinced a miniscule +0.1% move in the Dow means much. While the Dow and the S&P 500 indexes garner the hearts and minds of journalists and TV reporters, the ugly stepchild index, the NASDAQ, gets about as much respect as Rodney Dangerfield (see also No Respect in the Investment World).
While the S&P 500 hundred has NOT even reached the level from one year ago, the technology-heavy NASDAQ index has hit a 11+ year record high. Yes that’s right; the NASDAQ has not reached these levels since December 2000. Sure, the NASDAQ receives a lot of snickers since the technology bubble burst in 2000, when the index peaked at over 5,100 and subsequently plummeted to 1,108 (-78%) over the ensuing 31 months. But now the ugly stepchild index is making an extraordinary comeback into maturity. Since September 2002, near the lows, the NASDAQ has outperformed both the Dow and the S&P 500 indexes by more than a whopping 80%+, excluding dividends.
With the NASDAQ (and NASDAQ 100) hitting a new decade-plus high, are we approaching bubble-esque P/E ratios (price-earnings) of the 2000 era? Not even close. According to Birinyi Associates, the NASDAQ 100 index (QQQ) forward P/E ratio is priced at a reasonable 14x level – much lower than the 100x+ ratios we experienced right before the NASDAQ crash of 2000 and close to the P/E of the S&P 500.
With these NASDAQ indexes hitting new highs, does this tell us they are going to go significantly higher? No, not necessarily…just ask buyers of the NASDAQ in the late 1990s how that strategy worked then. Trying to time the market is a fruitless cause, and will always remain so. A few people will be able to do it occasionally, but doing so on a sustained basis is extremely difficult (if not impossible). If you don’t believe me, just ask Alan Greenspan, former Federal Reserve Chairman, who in 1996 said the tech boom had created “irrational exuberance.” When he made this infamous statement in 1996, the NASDAQ was trading around 1,300 – I guess Greenspan was only off by about another 3,800 points before the exuberance exhausted.
While a significantly outperforming index may not give you information on future prices, leadership indexes and sectors can direct you to fertile areas of research. Trends can be easy to identify, but the heavy lifting and sweat lies in the research of determining whether the trends are sustainable. With the significant outperformance of the NASDAQ index over the last decade it should be no surprise that technology has been leading the index brigade. The NASDAQ composite data is difficult to come by, but with the Technology sector accounting for 65% of the NASDAQ 100 index weighting, it makes sense that this index and sector should not be ignored. Cloud computing, mobility, e-commerce, alternative energy, and nanotechnology are but just a few of the drivers catapulting technology’s prominence in financial markets. Globalization is here to stay and technology is flattening the world so that countries and their populations can participate in the ever-expanding technology revolution.
Investors can continue to myopically focus on the narrow group of 30 Dow stocks and its arbitrary short-term target of 13,000, however those ignoring the leadership of the ugly stepchild index (NASDAQ) should do so at their own peril. Ugliness has a way of turning to beauty when people are not paying attention.
Wade W. Slome, CFA, CFP®
Plan. Invest. Prosper.
DISCLOSURE: Sidoxia Capital Management (SCM) and some of its clients own certain exchange traded funds, including SPY, but at the time of publishing SCM had no direct position in QQQ, or any other security referenced in this article. No information accessed through the Investing Caffeine (IC) website constitutes investment, financial, legal, tax or other advice nor is to be relied on in making an investment or other decision. Please read disclosure language on IC “Contact” page.
Markets Race Out of 2012 Gate

Article includes excerpts from Sidoxia Capital Management’s 2/1/2012 newsletter. Subscribe on right side of page.
Equity markets largely remained caged in during 2011, but U.S. stocks came racing out of the gate at the beginning of 2012. The S&P 500 index rose +4.4% in January; the Dow Jones Industrials climbed +3.4%; and the NASDAQ index sprinted out to a +8.0% return. Broader concerns have not disappeared over a European financial meltdown, high U.S. unemployment, and large unsustainable debts and deficits, but several key factors are providing firmer footing for financial race horses in 2012:
• Record Corporate Profits: 2012 S&P operating profits were recently forecasted to reach a record level of $106, or +9% versus a year ago. Accelerating GDP (Gross Domestic Product Growth) to +2.8% in the fourth quarter also provided a tailwind to corporations.
• Mountains of Cash: Companies are sitting on record levels of cash. In late 2011, U.S. non-financial corporations were sitting on $1.73 trillion in cash, which was +50% higher as a percentage of assets relative to 2007 when the credit crunch began in earnest.
• Employment Trends Improving: It’s difficult to fall off the floor, but since the unemployment rate peaked at 10.2% in October 2009, the rate has slowly improved to 8.5% today. Data junkies need not fret – we have fresh new employment numbers to look at this Friday.
• Consumer Optimism on Rise: The University of Michigan’s consumer sentiment index showed optimism improved in January to the highest level in almost a year, increasing to 75.0 from 69.9 in December.
• Federal Reserve to the Rescue: Federal Reserve Chairman, Ben Bernanke, and the Fed recently announced the extension of their 0% interest rate policy, designed to assist economic expansion, through the end of 2014. In addition, Bernanke did not rule out further stimulative asset purchases (a.k.a., QE3 or quantitative easing) if necessary. If executed as planned, this dovish stance will extend for an unprecedented six year period (2008 -2014).
Europe on the Comeback Trail?

Source: Calafia Beach Pundit
Europe is by no means out of the woods and tracking the day to day volatility of the happenings overseas can be a difficult chore. One fairly easy way to track the European progress (or lack thereof) is by following the interest rate trends in the PIIGS countries (Portugal, Ireland, Italy, Greece, and Spain). Quite simply, higher interest rates generally mean more uncertainty and risk, while lower interest rates mean more confidence and certainty. The bad news is that Greece is still in the midst of a very complex restructuring of its debt, which means Greek interest rates have been exploding upwards and investors are bracing for significant losses on their sovereign debt investments. Portugal is not in as bad shape as Greece, but the trends have been moving in a negative direction. The good news, as you can see from the chart above (Calafia Beach Pundit), is that interest rates in Ireland, Italy and Spain have been constructively moving lower thanks to austerity measures, European Central Bank (ECB) actions, and coordination of eurozone policies to create more unity and fiscal accountability.
Political Horse Race

Source: Real Clear Politics via The Financial Times
The other horse race going on now is the battle for the Republican presidential nomination between former Massachusetts governor Mitt Romney and former House of Representatives Speaker Newt Gingrich. Some increased feistiness mixed with a little Super-Pac TV smear campaigns helped whip Romney’s horse to a decisive victory in Florida – Gingrich ended up losing by a whopping 14%. Unlike traditional horse races, we don’t know how long this Republican primary race will last, but chances are this thing should be wrapped up by “Super Tuesday” on March 6th when there will be 10 simultaneous primaries and caucuses. Romney may be the lead horse now, but we are likely to see a few more horses drop out before all is said and done.
Flies in the Ointment

As indicated previously, although 2012 has gotten off to a strong start, there are still some flies in the ointment:
• European Crisis Not Over: Many European countries are at or near recessionary levels. The U.S. may be insulated from some of the weakness, but is not completely immune from the European financial crisis. Weaker fourth quarter revenue growth was suffered by companies like Exxon Mobil Corp (XOM), Citigroup Inc. (C), JP Morgan Chase & Co (JPM), Microsoft Corp (MSFT), and IBM, in part because of European exposure.
• Slowing Profit Growth: Although at record levels, profit growth is slowing and peak profit margins are starting to feel the pressure. Only so much cost-cutting can be done before growth initiatives, such as hiring, must be implemented to boost profits.
• Election Uncertainty: As mentioned earlier, 2012 is a presidential election year, and policy uncertainty and political gridlock have the potential of further spooking investors. Much of these issues is not new news to the financial markets. Rather than reading stale, old headlines of the multi-year financial crisis, determining what happens next and ascertaining how much uncertainty is already factored into current asset prices is a much more constructive exercise.
Stocks on Sale for a Discount

Source: Calafia Beach Pundit
A lot of the previous concerns (flies) mentioned is not new news to investors and many of these worries are already factored into the cheap equity prices we are witnessing. If everything was all roses, stocks would not be selling for a significant discount to the long-term averages.
A key ratio measuring the priceyness of the stock market is the Price/Earnings (P/E) ratio. History has taught us the best long-term returns have been earned when purchases were made at lower P/E ratio levels. As you can see from the 60-year chart above (Calafia Beach Pundit), stocks can become cheaper (resulting in lower P/Es) for many years, similar to the challenging period experienced through the early 1980s and somewhat analogous to the lower P/E ratios we are presently witnessing (estimated 2012 P/E of approximately 12.4). However, the major difference between then and now is that the Federal Funds interest rate was about 20% back in the early-’80s, while the same rate is closer to 0% currently. Simple math and logic tell us that stocks and other asset-based earnings streams deserve higher prices in periods of low interest rates like today.
We are only one month through the 2012 financial market race, so it much too early to declare a Triple Crown victory, but we are off to a nice start. As I’ve said before, investing has arguably never been as difficult as it is today, but investing has also never been as important. Inflation, whether you are talking about food, energy, healthcare, leisure, or educational costs continue to grind higher. Burying your head in the sand or stuffing your money in low yielding assets may work for a wealthy few and feel good in the short-run, but for much of the masses the destructive inflation-eroding characteristics of purported “safe investments” will likely do more damage than good in the long-run. A low-cost diversified global portfolio of thoroughbred investments that balances income and growth with your risk tolerance and time horizon is a better way to maneuver yourself to the investment winner’s circle.
Wade W. Slome, CFA, CFP®
Plan. Invest. Prosper.
DISCLOSURE: Sidoxia Capital Management (SCM) and some of its clients own certain exchange traded funds, but at the time of publishing SCM had no direct position in XOM, MSFT, JPM, IBM, or any other security referenced in this article. No information accessed through the Investing Caffeine (IC) website constitutes investment, financial, legal, tax or other advice nor is to be relied on in making an investment or other decision. Please read disclosure language on IC “Contact” page.


