Posts tagged ‘NASDAQ’
Scary Headlines Abound as Dow Knocks on 50-Thou…What Now?

The Dow Jones Industrial Average first crossed the 40,000 milestone in mid-2024 (see Investing Caffeine – Dow 40,000), yet barely 18 months later, the index has notched another record closing high and is now knocking on the door of 50,000.
For the most recent month:
Dow Jones: +1.7%
S&P 500: +1.4%
NASDAQ: +1.0%
Remarkably, as we enter 2026 flirting with these major milestones, this marks the third consecutive year of double-digit gains across the major stock indices—despite what feels like a nonstop barrage of alarming and often unimaginable headlines.
And that’s the key point.
A World on Fire… According to the Headlines
• Greenland Takeover Threat: Over a year ago, President Trump declared U.S. control of Greenland an “absolute necessity” for national security amid rising Russian and Chinese Arctic influence. Last month, tensions escalated when a proposed tariff regime—starting at 10% and rising to 25%—was announced against Denmark and several European allies. Markets ultimately breathed a sigh of relief after tariffs and military threats were reversed following the announcement of a negotiated framework.
• Venezuelan Invasion: In early January, U.S. forces executed a high-precision raid of the Venezuelan capital of Caracas in the middle of the night, when President Nicolas Maduro was successfully extracted without any Americans killed. Maduro now faces narcoterrorism and corruption charges in federal court in Brooklyn. Meanwhile, Secretary of State Marco Rubio has spearheaded a plan that prioritizes the rebuilding of Venezuela’s oil infrastructure by seizing tankers and millions of barrels of sanctioned crude oil to finance the reconstruction.
• ICE Protests in Minnesota Turn Deadly: Immigration protests in Minnesota escalated last month, resulting in two high-profile fatalities as demonstrators clashed with federal ICE authorities (Immigration and Customs Enforcement).
• Government Shutdown (Again): A partial government shutdown began January 31, 2026, after six of twelve appropriations bills expired. Political gridlock—particularly surrounding DHS (Department of Homeland Security) and ICE funding—has once again sidelined Washington as lawmakers attempt to negotiate a resolution. House members gather back from recess on February 2nd in an attempt to end the budget standoff.
• Federal Reserve Leadership Uncertainty: Fed Chair Jerome Powell’s term expires in May. President Trump has nominated Kevin Warsh as his successor, criticizing “Too Late” Powell’s pace of rate cuts for years. Warsh, a former Fed Governor during the 2008 Financial Crisis, is widely respected but faces scrutiny regarding Fed independence, in part because he shares the President’s view that interest rates should be lower in the current environment. His Senate confirmation remains pending.
• Middle East Tensions in Iran: Following last year’s U.S. strikes on Iranian nuclear facilities, tensions have reignited amid reports of mass protester killings by Iran’s IRGC (Islamic Revolutionary Guard Corps). The U.S. has since mobilized substantial regional military assets, signaling possible intervention in support of regime change.
• Supreme Court Tariff Ruling Looms: The Supreme Court has yet to rule on the administration’s use of the International Emergency Economic Powers Act (IEEPA) of 1977 to impose sweeping global tariffs. A ruling against the government could trigger over $100 billion in retroactive refunds. The next decision window is February 20, 2026.
• U.S. Dollar Weakness: After declining roughly 10% in 2025, the dollar continued to weaken in January 2026 (-1%) – see chart below. Precious metals surged alongside the move—gold up +12% and silver +17% for the month—despite sharp end-of-month pullbacks.
• Cryptocurrency Collapse: Bitcoin has fallen roughly -38% from its October 2025 peak near $126,000 to about $78,000, once again challenging its “digital gold” and “store-of-value” narrative.
• Ongoing Ukraine War and Gaza Conflict: The Russia-Ukraine conflict drags into its fifth year, while violence persists in Gaza despite a loosely agreed ceasefire, with casualties continuing to rise.
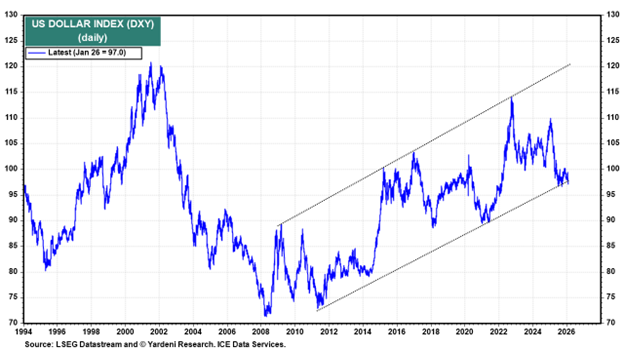
Source: Yardeni Research
Don’t Believe the Hype
That’s a staggering amount of uncertainty. So how has the stock market responded?
By soaring.
S&P 500 Returns:
2023: +24.2%
2024: +23.3%
2025: +16.4%
The verdict on 2026 remains unwritten—but so far, the trend remains intact.
For most of my professional career, I’ve urged investors to tune out fear-driven media narratives (see Turn Off the TV). History repeatedly shows there is little correlation between scary headlines and long-term stock prices.
In fact, I’ve argued before that bad news can often be good news for markets (see Bad News is Good News). Conversely, in 2022 we witnessed strong employment and solid economic growth—yet both stocks and bonds suffered significant losses.
What Actually Moves Markets (“The Stool”)

Rather than reacting to noise, investors should focus on what truly drives long-term returns. At Sidoxia Capital Management, we emphasize four foundational forces (see Don’t Be a Fool, Follow the Stool):
1. Profits
2. Interest Rates
3. Sentiment
4. Valuations
These four legs of the “Sidoxia Stool” exert far more influence over market direction than daily headlines ever will.
While the current environment presents a mixed picture across these factors, monitoring them—rather than reacting emotionally to media narratives—offers investors far greater clarity on where markets may head next. And whether the Dow reaches 50,000… or 100,000 likely won’t be decided by headlines. It will be decided by fundamentals.
Wade W. Slome, CFA, CFP®
Plan. Invest. Prosper.
This article is an excerpt from a previously released Sidoxia Capital Management complimentary newsletter (Feb. 2, 2026). Subscribe Here to view all monthly articles.
DISCLOSURE: Sidoxia Capital Management (SCM) and some of its clients hold positions in certain exchange traded funds (ETFs), but at the time of publishing had no direct position in any other security referenced in this article. No information accessed through the Investing Caffeine (IC) website constitutes investment, financial, legal, tax or other advice nor is to be relied on in making an investment or other decision. Please read disclosure language on IC Contact page.
Rational or Irrational Exuberance?

The government may be shut down, but the stock market hasn’t noticed. In fact, stocks just capped another record-breaking month. The S&P 500 gained +2.3%, the NASDAQ climbed +4.7%, and the Dow rose +2.5%.
Millions of Americans are feeling the downside of the shutdown—from disrupted travel to stalled services and furloughed workers. Historically, such uncertainty rattles Wall Street. This time? Investors seem more captivated by the transformative promise of artificial intelligence (AI).
So, the key question today: Is this AI-driven exuberance rational—or irrational?
Exuberance Then vs. Exuberance Now
Having invested for more than 35 years, I’ve seen periods of euphoria and fear. I vividly remember December 1996 when Fed Chair Alan Greenspan famously questioned whether markets were becoming “irrationally exuberant.” Back then, the NASDAQ sat near 1,300. Over the next three years it soared past 5,100 (almost quadrupling), only to crash nearly 80% by 2002.
But here’s the twist: it’s true, we did experience a “tech bubble burst”, but where is the NASDAQ index value today? Amazingly, the index stands at 23,000 (see chart below) – an 18x increase above the 1996 level when Greenspan gave his irrational exuberance speech! So, in hindsight, the sound we heard during 2000 was not the tech bubble bursting but rather an internet Big Bang! The internet wasn’t a speculative fad—it was the foundation of a global transformation.
So, what about AI?

Source: Macrotrends LLC
Internet Cycle vs. AI Supercycle
The internet era lifted the number of online users from zero to five billion—over 60% of the planet (see chart below). The AI wave kicked off publicly in November 2022 with ChatGPT’s release. In under three years, the NASDAQ has more than doubled. That pace isn’t sustainable forever, of course. Bubbles form, emotions swing, and markets correct. But dismissing AI as a fad ignores its unmistakable—and accelerating—impact.

Source: BOND – Mary Meeker
With the rapid appreciation in the stock market, it’s important for investors to identify and understand the warning signs of potential bubble bursting or market crash. In fact, I continue to do my part by studying past crashes. My shipment of Andrew Ross Sorkin’s book, 1929: Inside the Greatest Crash in Wall Street History just arrived and all these lessons remind us that not all booms are bubbles, and not all crashes end innovation.
Not All Bubbles are Created Equal
Major market drawdowns are part of a long-term investor’s journey:
- 1929: Great Crash
- 1973-74: Nifty-Fifty
- 1987: Black Monday
- 2000: Dot-com bust
- 2008: Financial crisis
- 2020: COVID crash
Many pundits today are now asking is this AI surge the next bubble? Valuations, as measured by P/E ratios (Price/Earnings), suggest a very different setup than in 2000.
Back then, many tech leaders traded at 100x+ earnings. Today’s Magnificent Seven tech leaders are elevated, but nowhere near dot-com extremes:
- NVIDIA Corporation (NVDA): 57x
- Apple Inc. (AAPL): 36x
- Microsoft Corp. (MSFT): 36x
- Alphabet Inc. (GOOG): 32x
- Amazon.com, Inc. (AMZN): 31x
- Meta Platforms, Inc. (META): 23x
*Source: MarketSurge – only Tesla, Inc. (TSLA) has a P/E higher than 100x.
For the S&P 500 overall, the index has a forward P/E of 22.8x (Yardeni Research), significantly lower than 2000 levels and nowhere near bubble territory.
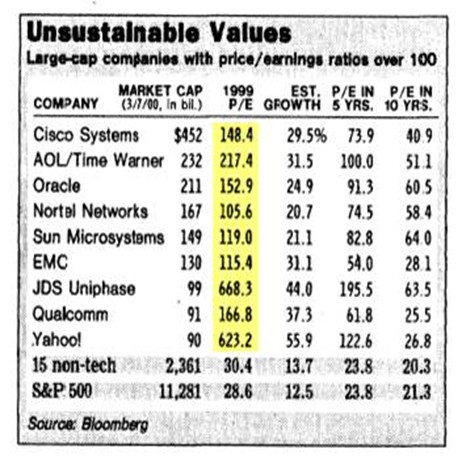
Source: Wall Street Journal – March 14, 2000
Life After the Internet and Life After AI Introduction
Think back 25 years:
- Renting movies at Blockbuster before Netflix went digital
- Driving to the bank for deposits
- Buying stamps to mail checks before Venmo or Zelle
Today, those activities feel prehistoric. AI is set to reshape daily life on an even faster timeline — from medicine and logistics to entertainment and marketing.
I’m discovering “AI epiphanies” weekly.
- With a few prompts, I created a beautiful Mother’s Day poem and became a poet hero despite never writing poetry before.
- When I recently needed to write an obituary for my mother, AI helped structure and refine it in minutes instead of taking me hours.
- Just last month I needed to hunt down lobster bisque for a shrimp pasta recipe I wanted to make. It turned into a time-wasting scavenger hunt. Thankfully, AI found it in stock, even when multiple apps insisted it wasn’t available. Needless to say, the recipe was incredibly delicious, and my stomach thanked ChatGPT.
And when it comes to investing? Evaluating biotech companies used to take weeks. Now, detailed research can be synthesized in days without sacrificing rigor. AI isn’t replacing insight — it’s amplifying output.
Not All AI Stories Are “Unicorns and Rainbows”
AI boosts productivity. Higher productivity means some companies need fewer people. Amazon recently announced 14,000 layoffs despite reporting amazing financial results. Microsoft and Meta have also announced thousands of employee layoffs even as profits rise.
This isn’t doom and gloom — it’s innovation cycles in action. Technology displaces tasks before ultimately creating new industries and roles.
So… Rational or Irrational?
Although there has been much debate regarding whether we are in an AI bubble, from my perspective, we are in the very early innings of a long AI revolutionary game. There are definitely pockets of frothiness that expose investors to undue risk, but if you can follow a disciplined, diversified, valuation-sensitive investment strategy, like we implement at Sidoxia Capital Management, I feel that the current exuberance is more rational than irrational.
Wade W. Slome, CFA, CFP®
Plan. Invest. Prosper.
This article is an excerpt from a previously released Sidoxia Capital Management complimentary newsletter (Nov. 3, 2025). Subscribe Here to view all monthly articles.
DISCLOSURE: Sidoxia Capital Management (SCM) and some of its clients hold positions in NVDA, AAPL, MSFT, GOOGL, AMZN, META, TSLA, and certain exchange traded funds (ETFs), but at the time of publishing had no direct position in any other security referenced in this article. No information accessed through the Investing Caffeine (IC) website constitutes investment, financial, legal, tax or other advice nor is to be relied on in making an investment or other decision. Please read disclosure language on IC Contact page.
Dow Knocking on the Door of 40,000

The stock market rang the doorbell of the New Year with a bang during the 1st quarter. The S&P 500 index built on last year’s +24% gain with another +10% advance during the first three months of the year. And as a result of these increases, the Dow Jones Industrial Average index is knocking on the door of the 40,000 milestone – more specifically, the Dow closed the month at 39,807 (see chart below). To put his into context, when I was born more than 50 years ago, the Dow was valued at less than 1,000 – not a bad run. This is proof positive of what Einstein called the 8th Wonder of the World, “compounding”. At Sidoxia Capital Management, we view investing as a marathon, not a sprint. You cannot realize the benefits of compounding without having a long-term time horizon. The sooner you start saving and the more you save, the faster and larger your retirement nest egg will grow.

If you are one of the people who thinks the stock market is too high, then you should definitely ignore Warren Buffett, arguably the greatest investor of all-time. Buffett predicted the Dow will reach an astronomical level of one million (1,000,000) within the next 100 years. I’m not sure I will still be around to witness this momentous achievement, however, if history repeats itself, this targeted timeframe could prove conservative.
Despite the magnitude and duration of this bull market, there is still a lot of angst and anxiety over the upcoming election. Nevertheless, investors are choosing instead to focus on the strong fundamentals of the economy. Just this last week, we saw the broadest measurement of economic activity, GDP (Gross Domestic Product), get revised higher to +3.4% growth during the 4th quarter of 2023 (see chart below). On the jobs front, the unemployment picture remains healthy (3.9%), near a generational low.
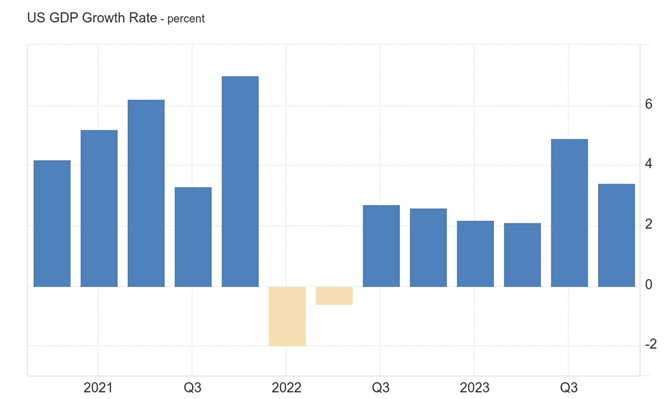
Source: Trading Economics and Bureau of Economic Analysis
And when it comes to the all-important inflation data, the Federal Reserve’s preferred inflation measure, Core PCE index (Core Personal Consumption Expenditures), was also just released in-line with economists’ projections at 2.5% (see chart below), very near the Fed’s long-term 2.0% inflation target and well below the Core PCE’s recent peak near 6%.

Source: The Wall Street Journal and Commerce Department
This resilient economic data, when combined with the declining inflation figures, has resulted in the Federal Reserve sticking with its plan of cutting its Federal Funds interest rate target three times this year. If inflation reverses course or remains stubbornly high, then there is a higher likelihood that interest rate cuts will be delayed. On the flip side, if economic data slows significantly or the country goes into a recession, then the probability of sooner and/or more Fed interest-rate cuts will increase.
In other news, here are some of the other major financial headlines this month:
- Francis Scott Key Baltimore Bridge Collapse: Six people died when a large container ship crashed into the Francis Scott Key bridge in the Port of Baltimore. An estimated 50 million tons of goods valued at $80 billion flows through this port, making this one of the top 10 ports in the country. The auto and coal industry supply chains will be disproportionately affected, but the good news is much of these goods will be diverted to other larger ports (e.g., Port of New York and Port of New Jersey).
- DJT Debut: A lot of hype surrounded the trading debut of Trump Media & Technology Group, which began trading last week under the initials of our country’s former president, Donald J. Trump (Ticker: DJT). Despite only posting a few million in revenue and -$50 million in losses during the first nine months of 2023, the stock skyrocketed +65% in its first week of trading and attained a $9 billion valuation. Time will tell if Trump’s Truth Social media platform will gain traction and justify the stock’s price, or rather suffer the declining fate of other meme stocks like GameStop Corp. (GME) or AMC Entertainment Holdings (AMC).
- SBF Sentenced to 25 Years: The former CEO of cryptocurrency exchange company FTX, Sam Bankman-Fried (SBF), was sentenced to 25 years in prison due to his conviction on seven counts of fraud and what is believed to be $8 billion in stolen client funds. SBF didn’t help his own cause by perjuring himself, tampering with witnesses, and showing a lack of remorse, according to the judge.
We are only 25% of the way through the year, but the Dow is knocking on the 40,000-milestone door. The way things look now, investors are wiping their feet on the welcome doormat and ready to walk right in.
Wade W. Slome, CFA, CFP®
Plan. Invest. Prosper.
This article is an excerpt from a previously released Sidoxia Capital Management complimentary newsletter (April 1, 2024). Subscribe Here to view all monthly articles.
DISCLOSURE: Sidoxia Capital Management (SCM) and some of its clients hold positions in individual stocks , certain exchange traded funds (ETFs), and notes including AMC 2026, but at the time of publishing had no direct position in DJT, GME, AMC or any other security referenced in this article. No information accessed through the Investing Caffeine (IC) website constitutes investment, financial, legal, tax or other advice nor is to be relied on in making an investment or other decision. Please read disclosure language on IC Contact page.
Return to Rationality?

As the worst pandemic in more than a generation is winding down in the U.S., people are readjusting their personal lives and investing worlds as they transition from ridiculousness to rationality. After many months of non-stop lockdowns, social distancing, hand-sanitizers, mask-wearing, and vaccines, Americans feel like caged tigers ready to roam back into the wild. An incredible amount of pent-up demand is just now being unleashed not only by consumers, but also by businesses and the economy overall. This reality was also felt in the stock market as the Dow Jones Industrial Average powered ahead another 654 points last month (+1.9%) to a new record level (34,529) and the S&P 500 also closed at a new monthly high (+0.6% to 4,204). For the year, the bull market remains intact with the Dow gaining almost 4,000 points (+12.8%), while the S&P 500 has also registered a respectable +11.9% return.

The story was different last year. The economy and stock market temporarily fell off a cliff and came to a grinding halt in the first quarter of 2020. However, with broad distribution of the vaccines and antibodies gained by the previously infected, herd immunity has effectively been reached. As a result, the U.S. COVID-19 pandemic has essentially come to an end for now and stock prices have continued their upward surge since last March.
Insanity to Sanity?
With the help of the Federal Reserve keeping interest rates at near-0% levels, coupled with trillions of dollars in stimulus and proposed infrastructure spending, corporate profits have been racing ahead. All this free money has pushed speculation into areas such as cryptocurrencies (i.e., Bitcoin, Dogecoin, Ethereum), SPACs (Special Purpose Acquisition Companies), Reddit meme stocks (GameStop Corp, AMC Entertainment), and highly valued, money-losing companies (e.g., Spotify, Uber, Snowflake, Palantir Technologies, Lyft, Peloton, and others). The good news, at least in the short-term, is that some of these areas of insanity have gone from stratospheric levels to just nosebleed heights. Take for example, Cathie Wood’s ARK Innovation Fund (ARKK) that invests in pricey stocks averaging a 91x price-earnings ratio, which exceeds 4x’s the valuation of the average S&P 500 stock. The ARK exchange traded fund that touts investments in buzzword technologies like artificial intelligence, machine learning, and cryptocurrencies rocketed +149% last year in the middle of a pandemic, but is down -10.0% this year. The Grayscale Bitcoin Trust fund (GBTC) that skyrocketed +291% in 2020 has fallen -5.6% in 2021 and -48.1% from its peak. What’s more, after climbing by more than +50% in less than four months, the Defiance NextGen SPAC fund (SPAK) has declined by -28.9% from its apex just a few months ago in February. You can see the dramatic 2021 underperformance in these areas in the chart below.

Inflation Rearing its Ugly Head?
The economic resurgence, weaker value of the U.S. dollar, and rising stock prices have pushed up inflation in commodities such as corn, gasoline, lumber, automobiles, housing, and a whole host of other goods (see chart below). Whether this phenomenon is “transitory” in nature, as Federal Reserve Chairman Jerome Powell likes to describe this trend, or if this is the beginning of a longer phase of continued rising prices, the answer will be determined in the coming months. It’s clear the Federal Reserve has its hands full as it attempts to keep a lid on inflation and interest rates. The Fed’s success, or lack thereof, will have significant ramifications for all financial markets, and also have meaningful consequences for retirees looking to survive on fixed income budgets.

As we have worked our way through this pandemic, all Americans and investors look to change their routines from an environment of irrationality to rationality, and insanity to sanity. Although the bull market remains alive and well in the stock market, inflation, interest rates, and speculative areas like cryptocurrencies, SPACs, meme-stocks, and nosebleed-priced stocks remain areas of caution. Stick to a disciplined and diversified investment approach that incorporates valuation into the process or contact an experienced advisor like Sidoxia Capital Management to assist you through these volatile times.

Wade W. Slome, CFA, CFP®
Plan. Invest. Prosper.
This article is an excerpt from a previously released Sidoxia Capital Management complimentary newsletter (June 1, 2021). Subscribe on the right side of the page for the complete text.
DISCLOSURE: Sidoxia Capital Management (SCM) and some of its clients hold positions in certain exchange traded funds (ETFs), but at the time of publishing had no direct position in GME, AMC, SPOT, UBER, SNOW, PLTR, LYFT, PTON, GBTC, SPAK, ARKK or any other security referenced in this article. No information accessed through the Investing Caffeine (IC) website constitutes investment, financial, legal, tax or other advice nor is to be relied on in making an investment or other decision. Please read disclosure language on IC Contact page.
Investors Slowly Waking to Technology Tailwinds

In recent years, investors have been overwhelmingly been distracted by geopolitical headlines and risk aversion caused by the worst financial crisis in a generation. In the background, the tailwinds of technological innovation have been silently gaining momentum. Although this topic is nothing new for Investing Caffeine followers, the outperformance of technology stocks has been pretty stunning in 2017 (see chart below), with the S&P 500 Technology sector rising almost +20% versus the Non-Tech sector eking out a little more than +1% return. Peered through the style lenses of Growth versus Value, technology’s contribution is also evident by the Russell 1000 Growth index’s 2017 outperformance over the Russell 1000 Value index by +11% (approximately +14% vs +3%, respectively).
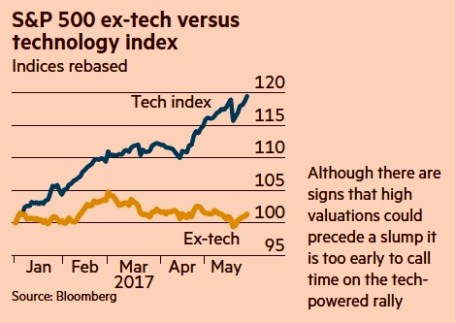
Source: Bloomberg via The Financial Times
More specifically, what’s driving a significant portion of this outperformance? Robin Wigglesworth from The Financial Times highlighted a key contributing trend here:
“Facebook, Apple, Amazon and Netflix have all gained over 30 per cent this year, and Google is up 24 per cent. Their total market capitalisation now stands at $2.4 trillion. That makes them bigger than the French CAC 40 or Germany’s Dax, and nearly as large as the FTSE 100.”
Technology’s domination has been even more impressive since the cycle bottom of stock prices in 2009, if one contrasts the stark difference in the performance of the tech-heavy NASDAQ versus the more sector-balanced S&P 500. Over this timeframe, the NASDAQ has more than quadrupled in value and beaten the S&P 500 by more than +120%.
While the mass media likes to talk about technology bubbles, artificial money printing by global central banks, and imminent recessions, for years I have been highlighting the importance of the technology revolution and its beneficial impact on stock prices. Here are a few examples:
Technology Does Not Sleep in a Recession (2009)
Technology Revolution Raises Tide (2010)
NASDAQ and the R&D Tech Revolution (2014)
NASDAQ 5,000…Irrational Exuberance Déjà Vu? (2014)
The Traitorous 8 and Birth of Silicon Valley (2016)
As I have explained in many of my previous writings, the important factors of technology, globalization, and demographics have been the key driving forces behind the stock bull market and multi-decade decline in interest rates – not Quantitative Easing (QE) and/or rising debt levels.
Eventually, undoubtedly, euphoria and over-investment will lead to a cyclically-driven recession caused by excess capacity (supply exceeding demand). Regardless of the timing of future economic cycles, the continued multi-generational advance in new technological innovations will continue to drive economic growth, disinflation, improved standards of living, and higher stock prices. Until the animal spirits of the masses fully embrace this technological trend, Sidoxia and its clients will enjoy the tailwind of innovation as I continue to discover attractive investment opportunities.

Wade W. Slome, CFA, CFP®
Plan. Invest. Prosper.
DISCLOSURE: Sidoxia Capital Management (SCM) and some of its clients own FB, AAPL, AMZN, GOOG/L, certain exchange traded funds, and short position in NFLX, but at the time of publishing SCM had no direct position in any other security referenced in this article. No information accessed through the Investing Caffeine (IC) website constitutes investment, financial, legal, tax or other advice nor is to be relied on in making an investment or other decision. Please read disclosure language on IC “Contact” page.
NASDAQ Redux

The NASDAQ Composite index once again crossed the psychologically, all-important 5,000 threshold this week for the first time since the infamous tech-bubble burst in the year 2000. Of course, naturally, the media jumped on a non-stop, multi-day offensive comparing and contrasting today’s NASDAQ vs. the NASDAQ twin of yesteryear. Rather than rehash the discussion once again, I have decided to post three articles I published in recent years on the topic covering the outperformance of the spotlighted, tech-heavy index.
NASDAQ 5,000 Irrational Exuberance Déjà Vu?

Investors love round numbers and with the Dow Jones Industrial index recently piercing 17,000 and the S&P 500 index having broken 2,000 , even novice investors have something to talk about around the office water cooler. While new all-time records are being set for the major indices during September, the unsung, tech-laden NASDAQ index has yet to surpass its all-time high of 5,132 achieved 14 and ½ years ago during March of 2000.
Click Here to Read the Rest of the Article
NASDAQ and the R&D Tech Revolution

It’s been a bumpy start for stocks so far in 2014, but the fact of the matter is the NASDAQ Composite Index is up this year and hit a 14-year high in the latest trading session (highest level since 2000). The same cannot be said for the Dow Jones Industrial and S&P 500 indices, which are both lagging and down for the year. Not only did the NASDAQ outperform the Dow by almost +12% in 2013, but the NASDAQ has also trounced the Dow by over +70% over the last five years.
Click Here to Read the Rest of the Article
NASDAQ: The Ugly Stepchild

All the recent media focus has been fixated on whether the Dow Jones Industrial Average index (“The Dow”) will close above the 13,000 level. In the whole scheme of things, this specific value doesn’t mean a whole lot, but it does make for a great topic of conversation at a cocktail party. Today, the Dow is trading at 12,983, a level not achieved in more than three and a half years. Not a bad accomplishment, given the historic financial crisis on our shores and the debacle going on overseas, but I’m still not so convinced a miniscule +0.1% move in the Dow means much. While the Dow and the S&P 500 indexes garner the hearts and minds of journalists and TV reporters, the ugly stepchild index, the NASDAQ, gets about as much respect as Rodney Dangerfield (see also No Respect in the Investment World).
Click Here to Read the Rest of the Article

Wade W. Slome, CFA, CFP®
Plan. Invest. Prosper.
DISCLOSURE: Sidoxia Capital Management (SCM) and some of its clients hold positions in certain exchange traded funds (ETFs) , but at the time of publishing, SCM had no direct position in any other security referenced in this article. No information accessed through the Investing Caffeine (IC) website constitutes investment, financial, legal, tax or other advice nor is to be relied on in making an investment or other decision. Please read disclosure language on IC Contact page.
NASDAQ 5,000…Irrational Exuberance Déjà Vu?
Investors love round numbers and with the Dow Jones Industrial index recently piercing 17,000 and the S&P 500 index having broken 2,000 , even novice investors have something to talk about around the office water cooler. While new all-time records are being set for the major indices during September, the unsung, tech-laden NASDAQ index has yet to surpass its all-time high of 5,132 achieved 14 and ½ years ago during March of 2000.
A lot has changed since then. Leading up to the pricking of the technology bubble, talks of an overhyped market started as early as December 5, 1996, when then Federal Reserve Chairman Alan Greenspan made his infamous “irrational exuberance” speech.
“But how do we know when irrational exuberance has unduly escalated asset values, which then become subject to unexpected and prolonged contractions as they have in Japan over the past decade?”-Alan Greenspan (Federal Reserve Chairman 1987 – 2006)
On that date, the NASDAQ closed at 1,300. A little over three years later, before values cratered by -78%, the index almost quadrupled higher to 5,132. Looked at from a slightly different lens, here is how the major indexes have fared since Greenspan’s widely referenced speech almost 18 years ago:

Despite the world’s most powerful banker calling stock prices irrational, the Dow & S&P have almost tripled in value (+164% & +167%, respectively) and the NASDAQ has almost quadrupled (+251%). The 80%+ outperformance (excluding dividends) is impressive, but reasonable if you consider this increase amounts to about a +7.2% compounded annual appreciation value. Investors have experienced a lot of heartburn over that long timeframe, but for any buy-and-holders, these returns would have trounced returns realized in alternative safe haven vehicles like CDs, savings accounts, or bonds.
Price: The Almighty Metric
There are many valuation metrics to evaluate but the most universal one is the Price/Earnings ratio (P/E). Just as in the process of assessing the value of a car, house, or stock, the price you pay is usually the most important factor of the purchase. The same principle applies to stock indexes. The cheaper the price paid, the greater probability of earning superior returns in the future. Unfortunately for investors in technology stocks, there was not much value in the NASDAQ index during late-1999, early-2000. Historical P/E data for the NASDAQ index is tough to come by, but some estimates pegged the index value at 200x’s its earnings at the peak of the 2000 technology mania. In other words, for every $1 in profit the average NASDAQ company earned, investors were willing to pay $200…yikes.
Today, the NASDAQ 100 index (the largest 100 non-financial companies in the NASDAQ index), which can serve as a proxy for the overll NASDAQ index, carries a reasonable P/E ratio of approximately 20x on a forward basis (24x on a trailing basis) – about 90% lower than the peak extremes of the NASDAQ index in the year 2000.
Although NASDAQ valuations are much lower today than during the bursting 2000 tech bubble, P/E ratios for the NASDAQ 100 still remain about +20% higher than the S&P 500, which begs the question, “Is the premium multiple deserved?”
As I wrote about in the NASDAQ Tech Revolution, you get what you pay for. If you pay a peanut multiple, many times you get a monkey stock. In the technology world, there is often acute obsolescence risk (remember Blackberry – BBRY?) that can lead to massive losses, but there also exists a winner-takes-all dynamic. Just think of the dominance of Google (GOOG/L) in search advertising, Microsoft (MSFT) in the PC, or Amazon (AMZN) in e-commerce. It’s a tricky game, but following the direction of cash, investments, and product innovation are key in my mind if you plan on finding the long-term winners. For example, the average revenue growth for the top 10 companies in the NASDAQ 100 averaged more than +100% annually from the end of 1999 to the end of 2013. Identifying the “Old Tech Guard” winners is not overly challenging, but discovering the “New Tech Guard” is a much more demanding proposition.
In the winner-takes-all hunt, one need not go any further than looking at the massive role technology plays in our daily lives. Twenty years ago, cell phones, GPS, DVRs (Digital Video Recorders), e-Readers, tablets, electric cars, iPods/MP3s, WiFi mobility, on-demand digital media, video-conferencing, and cloud storage either did not exist or were nowhere near mainstream. Many of these technologies manifest themselves into a whole host of different applications that we cannot live without. One can compile a list of these life-critical applications by thumbing through your smartphone or PC bookmarks. The list is ever-expanding, but companies like Twitter (TWTR), Facebook (FB), Amazon (AMZN), Uber, Netflix (NFLX), Priceline (PCLN), Yelp, Zillow (Z), and a bevy of other “New Tech Guard” companies have built multi-billion franchises that have become irreplaceable applications in our day-to-day lives.
Underlying all the arbitrary index value milestones (e.g., Dow 17,000 and S&P 2,000) since the 1990s has a persistent and unstoppable proliferation of technology adoption across virtually every aspect of our lives. NASDAQ 5,000 may not be here quite yet, but getting there over the next year or two may not be much of a stretch. Speculative tendencies could get us there sooner, and macro/geopolitical concerns could push the milestone out, but when we do get there the feeling of NASDAQ 5,000 déjà vu will have a much stronger foundation than the fleeting euphoric emotions felt when investors tackled the same level in year 2000.
Wade W. Slome, CFA, CFP®
Plan. Invest. Prosper.
DISCLOSURE: Sidoxia Capital Management (SCM) and some of its clients own AAPL, GOOG/L, AMZN, NFLX bonds (short the equity), FB (non-discretionary), MSFT (non-discretionary), PCLN (non-discretionary) and a range of positions in certain exchange traded fund positions, but at the time of publishing SCM had no direct position in TWTR, Uber, YELP, Z, or any other security referenced in this article. No information accessed through the Investing Caffeine (IC) website constitutes investment, financial, legal, tax or other advice nor is to be relied on in making an investment or other decision. Please read disclosure language on IC Contact page.
NASDAQ and the R&D-Tech Revolution
It’s been a bumpy start for stocks so far in 2014, but the fact of the matter is the NASDAQ Composite Index is up this year and hit a 14-year high in the latest trading session (highest level since 2000). The same cannot be said for the Dow Jones Industrial and S&P 500 indices, which are both lagging and down for the year. Not only did the NASDAQ outperform the Dow by almost +12% in 2013, but the NASDAQ has also trounced the Dow by over +70% over the last five years.
Is this outperformance a fluke or random coincidence? I’d beg to differ, and we will explore the reasons behind the NASDAQ being treated like the Rodney Dangerfield of indices. Or in other words, why the NASDAQ gets “no respect!” (see also NASDAQ Ugly Step Child).
Compared to the “bubble” days of the nineties, today’s discussions more rationally revolve around profits, cash flows, and valuations. Many of us old crusty veterans remember all the crazy talk of the “New Economy,” “clicks,” and “eyeballs” that took place in the mid-to-late 1990s. Those metrics and hyperbole are used less today, but if NASDAQ’s dominance extends significantly, I’m sure some new and old descriptive euphemisms will float to the conversational surface.
The technology bubble may have burst in 2000, and scarred memories of the -78% collapse in the NASDAQ (5,100 to 1,100) from 2000-2002 have not been forgotten. Despite that carnage, technology has relentlessly advanced through Moore’s Law, while internet connectivity has proliferated in concert with globalization. FedEx’s (FDX) Chief Information Officer Rob Carter summed it up nicely when he noted, “The sound we heard wasn’t the [tech] bubble bursting; it was the big bang.”
Even with the large advance in the NASDAQ index in recent years, valuations of the tech-heavy index remain within reasonable ranges. Accurate gauges of the NASDAQ Composite price-earnings ratio (P/E) are scarce, but just a few months ago, strategist Ned Davis pegged the index P/E at 21, well below the peak of 49 at the end of 1999. For now, the scars and painful memories of the 2000 crash have limited the amount of frothiness, although pockets of it certainly still exist (greed will never be fully eradicated).
Why NASDAQ & Technology Continue to Flourish
Regardless of how one analyzes the stock market, ultimately long-term stock prices follow the direction of profits and cash flows. Profits and cash flows don’t however grow out of thin air. Sustainable growth requires competitiveness. For most industries, a long-term competitive advantage requires a culture of innovation and technology adoption. As you can see from the NASDAQ listed companies BELOW, there is no shortage of innovation.
CLICK TO ENLARGE
Sources: ADVFN, SEC, Other
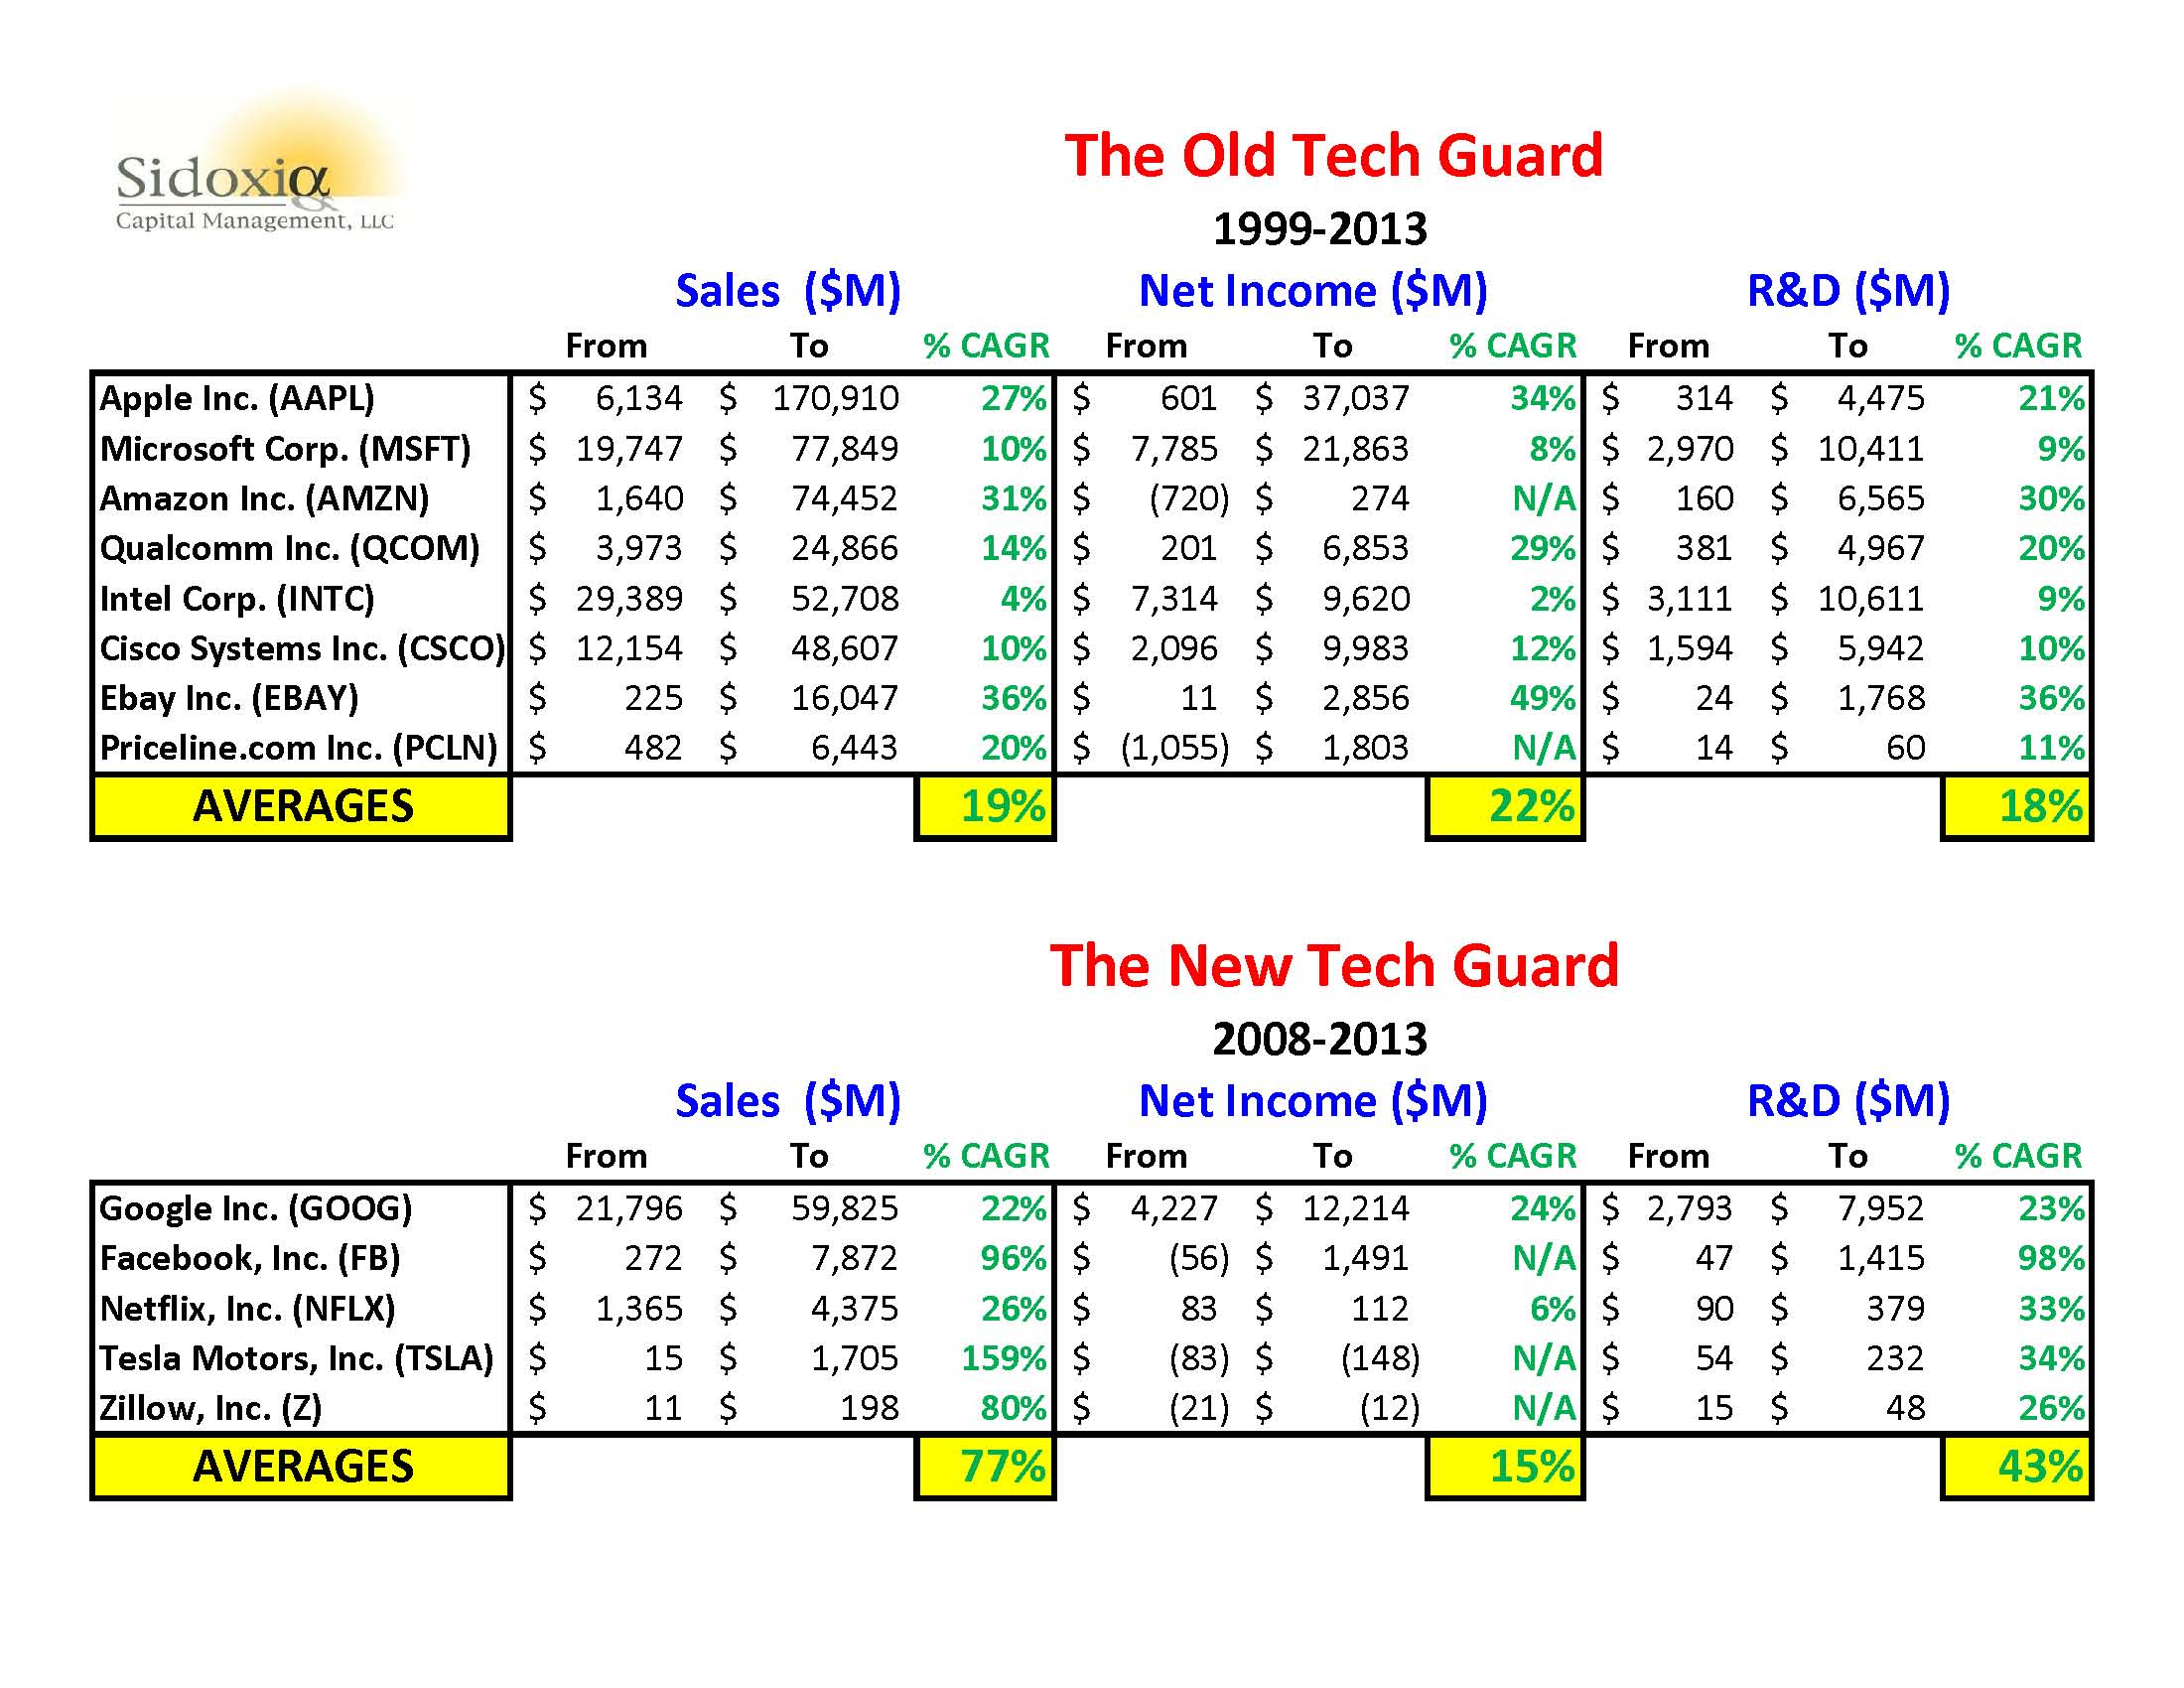
I’ve divided the largest technology companies in the NASDAQ 100 index that survived the bursting of the 2000 technology bubble into “The Old Tech Guard.” This group of eight stocks represents a total market value of about $1.5 trillion – equivalent to almost 10% of our country’s Gross Domestic Product (GDP). Incredibly, this select collection of companies achieved an average sales growth rate of +19%; income growth of +22%; and research & development growth of +18% over a 14-year period (1999-2013).
The second group of younger stocks (a.k.a., The New Tech Guard) that launched their IPOs post-2000 have accomplished equally impressive results. Together, these handful of companies have earned a market value of over $625 billion. There’s a reason investors are gobbling up these stocks. Over the last five years, The New Tech Guard companies have averaged an unbelievable +77% sales growth rate, coupled with a remarkable +43% expansion in average annual R&D expenditures.
Innovation Dead?
Who said innovation is dead? Not me. Combined, these 13 companies (Old Guard + New Guard) are spending about $55,000,000,000 on research and development…annually! If you consider the hundreds and thousands of other technology companies that are also investing aggressively for the future, it should come as no surprise that the pace of innovation is only accelerating.
While newscasters, bloggers, and newspapers will continue to myopically focus on the Dow and S&P 500 indices, do your investment portfolio a favor by not forgetting about the relentless R&D and tech revolution taking place within the innovative and often overlooked NASDAQ index.
Wade W. Slome, CFA, CFP®
Plan. Invest. Prosper.
DISCLOSURE: Sidoxia Capital Management (SCM) and some of its clients hold long positions in certain exchange traded funds (ETFs), AAPL, GOOG, AMZN, FDX, QCOM, and a short position in NFLX, but at the time of publishing SCM had no direct discretionary position in MSFT, INTC, CSCO, EBAY, PCLN, FB, TSLA, Z, or any other security referenced in this article. No information accessed through the Investing Caffeine (IC) website constitutes investment, financial, legal, tax or other advice nor is to be relied on in making an investment or other decision. Please read disclosure language on IC Contact page.
Lent: Giving Up the Gold Vice

Source: Photobucket
When it comes to Lent, most Christian denomination followers give up a vice, such as food, alcohol, or now in more modern times…Facebook (FB). Since Lent began on Ash Wednesday this year (February 22, 2012), investors have given up something else – gold (GLD). As a matter of fact, the shiny metal has declined by about -8% since Lent began. Stocks, on the other hand, as measured by the S&P 500, have outperformed gold by more than 10% over this period (the Lent period damage is even worse, if you look at the NASDAQ).
If you go back further in time, the underperformance is more extreme, once you account for dividends, which gold of course does not provide. For example, since the peak of the financial crisis panic in March of 2009, S&P 400, S&P 600, and NASDAQ stocks have outperformed gold by more than +40%. Yet, I am still waiting for the sign-spinning guy at the corner of First St. & Main St. to advertise stock trade-in opportunities. Contrarians may also get a kick out of the top investment CNBC survey too.

Source: Orlando Sentinel
Last Friday’s jobs data was nothing to write home about, so gold cheerleaders might wait for more fiat currency debasement to come in the form of QE3 (i.e., quantitative easing or printing press). But once again, while this potential added monetary stimulus may not be bad for gold, let’s not forget that stocks still outperformed gold under QE1 & QE2.
As I have always stated, I can’t disagree with the inflationary pressures that are brewing. Stimulative monetary and fiscal policies, coupled with emerging market expansion and undisciplined government spending don’t paint a pretty inflationary picture. So if that’s the case, why not focus on other commodities that provide real utility besides just shininess (e.g., agricultural goods, copper, aluminum, oil, and even silver).
The gold bugs may still have a little post-Lent party, until rates start going up and panic insurance premiums go down, but once the Fed’s easing policy stance changes (see Paul Volcker Fed Chairman era) and fiscal sanity eventually returns to Washington, investors may look to another vice to gorge on.
See also some other items to gorge on: CLICK HERE
Wade W. Slome, CFA, CFP®
Plan. Invest. Prosper.
DISCLOSURE: Sidoxia Capital Management (SCM) and some of its clients own certain exchange traded funds (including small cap ETFs, mid cap ETFs, energy ETFs, commodity ETFs) , but at the time of publishing SCM had no direct position in GLD, FB, or any other security referenced in this article. No information accessed through the Investing Caffeine (IC) website constitutes investment, financial, legal, tax or other advice nor is to be relied on in making an investment or other decision. Please read disclosure language on IC “Contact” page.
Investors Sit on Fence and Watch New Highs

Article includes excerpts from Sidoxia Capital Management’s 3/1/2012 newsletter. Subscribe on right side of page.
We’ve seen some things jump during this 2012 Leap Year (mainly stock prices), but investors have not been jumping – rather they have been doing a lot of fence sitting. Despite the NASDAQ index hitting 11+ year highs (+14% in 2012 excl. dividends), and the S&P 500 index approaching 4-year highs, investors have been pulling cash out in droves from equities. Just last month, Scott Grannis at Calafia Beach Pundit highlighted that $355 billion in equity outflows has occurred since September 2008, including $155 billion since April 2011 and $6 billion siphoned out at the beginning of 2012.
Once again, listening to the vast majority of TV talking heads has decimated investor portfolios. However, ignoring the dreadful, horrific news over the last three years would have made an equity investor 100%+ (yes, that’s right…double). Somehow, the facts have escaped the psyches of millions of average Americans as the train is leaving the station. Certainly in 2008, a generational decline in equity markets was accompanied by horrific headlines. Those who were positioned too aggressively suffered about 15 months of severe pain, but those who capitulated with knee-jerk reactions after the collapse did incredibly more damage by selling near the bottom and locking in losses. Only now, after the Dow has exploded from 6,500 to 13,000 over the last three years have investors begun to ask whether now is the time to buy stocks.
Of course, making decisions by reacting to news headlines is a horrible way to manage one’s money and will only lead to a puddle of tears in the long-run. Psychological studies have shown that losses are 2.5x’s as painful as the pleasure experienced from gains. The wounds from the 2000 technology bubble and 2008-2009 financial crisis are still too fresh in investors’ minds, and until the scars heal, millions of investors will remain on the sidelines. As usual, average investors unfortunately get more excited after much of the gains have already been garnered.
Investing should be treated like an extended game of chess that requires long-term thinking. As in investing, there are many strategies that can be used in chess. Shadowing your opponent’s every move generally is not a winning strategy. Rather than defensively reacting to an opponent’s every move, proactively planning for the future is a healthier strategy. Don’t be a pawn, but instead create a long-term, low-cost investment plan that accounts for your current balance sheet, future goals, and risk tolerance in order to achieve your retirement checkmate. But before you can do that, you must first get that rump off the fence and put a plan into action.
Hot News Bites

How Do You Like Them Apples? Apple Inc. (AAPL) has become the most valuable company on the planet as it has surpassed a half-trillion dollars in market value at the end of February. Thanks to record sales of new iPhones, iPads, and Mac computers, Apple has managed to stuff away close to $100 billion in cash in its coffers. What’s next for Apple? Besides introducing new versions of existing products, Apple is expected to innovate its television platform later this year.
Greece Dips into Euro Purse Again: Euro-zone ministers approved a $172 billion rescue package for Greece to avoid default for the second time in less than two years. In addition to the Greek citizens, private bondholders are sharing in the pain. The deal calls for debt holders to write down their Greek debt by 74%; demands stark austerity measures (Debt/GDP ratio of 120.5% by 2020); and a continuous monitoring of Greece’s fiscal standing by a European task force.
Taxes-Schmaxes: There’s nothing more exciting in politics than the discussion of taxes. OK, maybe former Speaker Newt Gingrich’s moon colony proposal is a tad more interesting. Nonetheless, Congress voted to extend the payroll-tax cut through December, and both President Obama and presidential candidate Mitt Romney unveiled their new tax plans. Although Obama’s plan hopes to tax the rich, both politicians have plenty of tax-cuts embedded in their plans. In an election year, apparently debt and deficit amnesia have set in.
Investors “Like” Facebook: Although investors appear to be “Like”-ing Facebook in advance of its initial public offering (IPO), employees and owners seem to be even happier, considering the company is estimated to reach up to $100 billion in value once shares begin trading. I can’t wait to read CEO Mark Zuckerberg’s status update when he cashes in on a portion of his stake of $25 billion or so.
Gas Prices Empty Wallet: Improving global economic data is not the only reason behind escalating gasoline prices (currently averaging $3.73 per gallon for Regular). Iran reduced its sales of crude oil to Britain and France after those countries stopped importing Iranian oil, and Iran stated it has made progress on its nuclear-development program. Can’t we just all get along?!
Plan. Invest. Prosper.
Wade W. Slome, CFA, CFP®
Plan. Invest. Prosper.
DISCLOSURE: Sidoxia Capital Management (SCM) and some of its clients own certain exchange traded funds, FB and AAPL, but at the time of publishing SCM had no direct position in any other security referenced in this article. No information accessed through the Investing Caffeine (IC) website constitutes investment, financial, legal, tax or other advice nor is to be relied on in making an investment or other decision. Please read disclosure language on IC “Contact” page.


