Posts tagged ‘margins’
Heartburn Pains After Digesting Market Gains

After gorging on +9% gains in the stock market (S&P 500 index) during July, investors suffered some heartburn pain in August (-4%). The indigestion really kicked in after Federal Reserve Chairman, Jerome Powell, gave a frank and candid outlook during his annual monetary policy speech at Jackson Hole, Wyoming. His key takeaways were that further interest rate increases are necessary to control and bring down inflation. And these economically-slowing measures, coupled with the Fed’s $95 billion in quantitative tightening policies (QT), will according to the Fed Chairman, “bring some pain to households and businesses. These are the unfortunate costs of reducing inflation. But a failure to restore price stability would mean far greater pain.”
But not everything is causing stomach pains. Yes, inflation is elevated (the rate declined to 8.5% in July from 9.1%), but there are multiple signs that overall prices are peaking. For example, gasoline prices have declined for 11 consecutive weeks to pre Russia-Ukraine invasion levels around $3.81/gallon nationally. There are also signs that housing prices, rent, used car prices, and other commodities like wheat, beef, and copper are all declining in price, as well. Even Bitcoin and other cryptocurrencies are joining in the deflation parade.
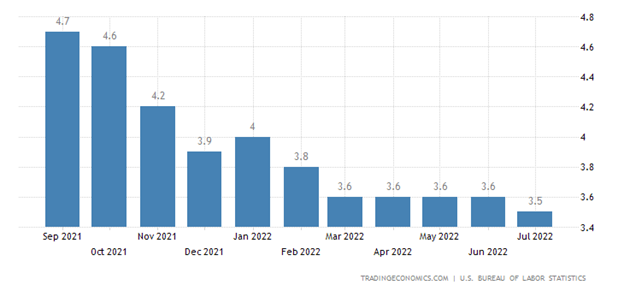
And while the Fed is doing its darnedest to bring a halt to gut-wrenching inflation, the job market remains on fire (see chart below). The unemployment rate registered in at a near a generational-low of 3.5% last month, but we will receive a fresh, new figure this week to see if this trend continues.
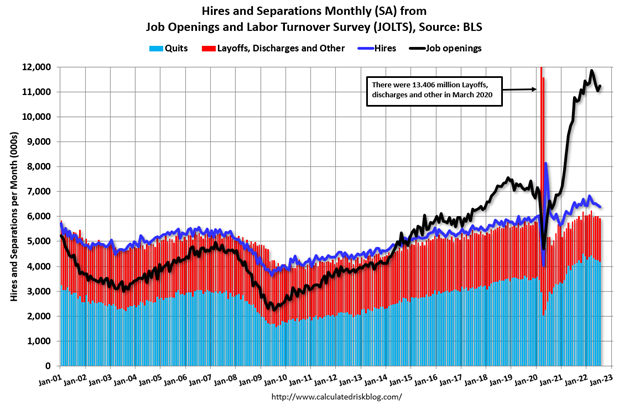
The economy’s ravenous appetite for workers can also be found in the just-released JOLTS job opening data (see chart below), which shows there are 11.2 million job openings, a total that is almost double the number of available workers (5.7 million).
Stimulus – Trillion Style
The subject of politics is not my strong suit, so perhaps only time will tell whether the net result of two large pieces of government legislation totaling more than $1 trillion (Inflation Reduction Act and Student Loan Forgiveness) will accelerate growth in the economy (Real GDP) or hasten the pace of inflation.
More specifically, the $565 billion Inflation Reduction Act is designed with the intent of investing in clean energy and healthcare initiatives, while negotiating lower pharmaceutical prices with drug companies, and raising tax revenues. The key measures planned in the legislation to fund the spending and forecasted deficit reduction are a minimum corporate tax, the termination of the carried interest tax loophole, and a doubling of the IRS (Internal Revenue Service) budget to hunt down tax dodgers.
With respect to the Student Loan Forgiveness Plan, the cost of the bill is estimated to be between $469 billion to $519 billion over a 10-year budget window, according to the University of Pennsylvania. The debt cancellation will apply to lower income individuals (earning less than $125,000 annually) with the potential of erasing debt of $10,000 – $20,000 per eligible person.
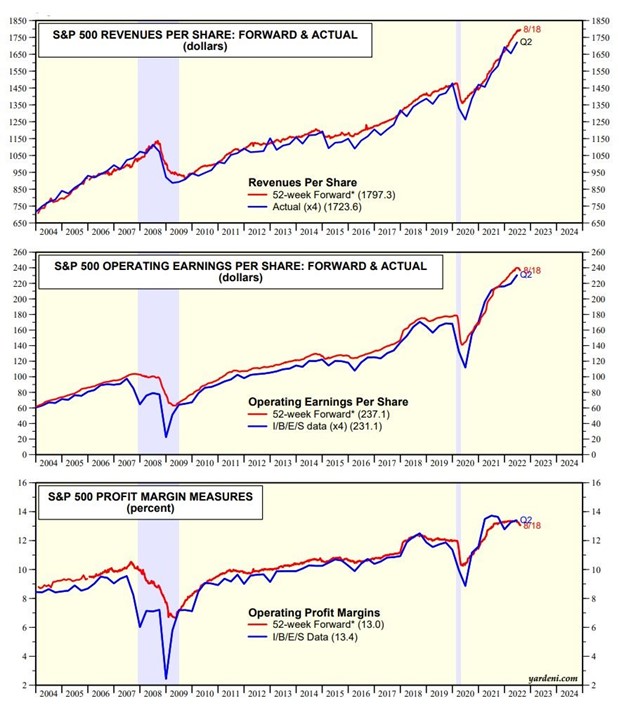
While the government passes various investing, spending, and tax-raising initiatives, corporations continue to crank out record results (see profit charts below), despite talks of an impending recession (see last month’s article, Recession or Mental Depression?).
Pessimists point to the economic strength as only temporary, as they brace for the Fed’s interest rate hiking medicine to take larger effect on the patient. Optimists point to the durability of corporate profits, relatively low interest rates (3.13% yield on the 10-Year Treasury Note), positive Q3 – GDP growth estimates of +1.6%, and reasonable valuations (17x Forward Price/Earnings ratio), given the evidence of peaking and declining inflation.
In view of all the current countervailing factors, the near-term volatility will likely create a lot of stomach-churning uneasiness. However, in the coming months, if it becomes clearer the Fed is closer to the end of its rate-hiking cycle and inflation subsides, you might be gleefully enjoying your tasty gains rather than complaining of financial heartburn and headache pains.

Wade W. Slome, CFA, CFP®
Plan. Invest. Prosper.
DISCLOSURE: Sidoxia Capital Management (SCM) and some of its clients hold positions and certain exchange traded funds (ETFs), but at the time of publishing had no direct position in BRKA/B or any other security referenced in this article. No information accessed through the Investing Caffeine (IC) website constitutes investment, financial, legal, tax or other advice nor is to be relied on in making an investment or other decision. Please read disclosure language on IC Contact Page.
Netflix: Burn It and They Will Come

In the successful, but fictional movie, Fields of Dreams, an Iowa farmer played by actor Kevin Costner is told by voices to build a field for baseball playing ghosts. After the baseball diamond is completed, the team of Chicago White Sox ghosts, including Shoeless Joe Jackson, come to play.
Well, in the case of the internet streaming giant Netflix Inc (NFLX), instead of chasing ghosts, the company continues to chase the ghosts of profitability. Netflix’s share price has already soared +63% this year as the company continues to burn hundreds of millions in cash, while aggressively building out its international streaming footprint. Unlike Kevin Costner, Netflix investors are likely to eventually get spooked by the by the stratospheric valuation and bleeding cash.
At Sidoxia, we may be a dying breed, but our primary focus is on finding market leading franchises that are growing cash flows at reasonable valuations. In sticking with my nostalgic movie quoting, I believe as Cuba Gooding Jr. does in the classic movie, Jerry Maguire, “Show me the money!” Unfortunately for Netflix, right now the only money to be shown is the money getting burned.
Burn It and They Will Come

In a little over three years, Netflix has burned over -$350 million in cash, added $2 billion in debt, and spent approximately -$11 billion on streaming content (about -$4.6 billion alone in the last 12 months). As the hemorrhaging of cash accelerates (-$163 million in the recent quarter), investors with valuation dementia have bid up Netflix shares to a head-scratching 350x’s estimated earnings this year and a still mind-boggling valuation of 158x’s 2016 Wall Street earnings estimates of $3.53 per share. Of course the questionable valuation built on accounting smoke and mirrors looks even more absurd, if you base it on free cash flow…because Netflix has none. What makes the Netflix story even scarier is that on top of the rising $2.4 billion in debt anchored on their balance sheet, Netflix also has commitments to purchase an additional $9.8 billion in streaming content in the coming years.
For the time being, investors are enamored with Netflix’s growing revenues and subscribers. I’ve seen this movie before (no pun intended), in the late 1990s when investors would buy growth with reckless neglect of valuation. For those of you who missed it, the ending wasn’t pretty. What’s causing the financial stress at Netflix? It’s fairly simple. Beyond the spending like drunken sailors on U.S. television and movie content (third party and original), the company is expanding aggressively internationally.
The open check book writing began in 2010 when Netflix started their international expansion in Canada. Since then, the company has launched their service in Latin America, the United Kingdom, Ireland, Finland, Denmark, Sweden Norway, Netherlands, Germany, Austria, Switzerland, France, Belgium, Luxembourg, Australia, and New Zealand.
With all this international expansion behind Netflix, investors should surely be able to breathe a sigh of relief by now…right? Wrong. David Wells, Netflix’s CFO had this to say in the company’s recent investor conference call. Not only have international losses worsened by 86% in the recent quarter, “You should expect those losses to trend upward and into 2016.” Excellent, so the horrific losses should only deteriorate for another year or so…yay.
While Netflix is burning hundreds of millions in cash, the well documented streaming competition is only getting worse. This begs the question, what is Netflix’s real competitive advantage? I certainly don’t believe it is the company’s ability to borrow billions of dollars and write billions in content checks – we are seeing plenty of competitors repeating the same activity. Here is a partial list of the ever-expanding streaming and cord-cutting competitive offerings:
- Amazon Prime Instant Video (AMZN)
- Apple TV (AAPL)
- Hulu
- Sony Vue
- HBO Now
- Sling TV (through Dish Network – DISH)
- CBS Streaming
- YouTube (GOOG)
- Nickelodeon Streaming
Sadly for Netflix, this more challenging competitive environment is creating a content bidding war, which is squeezing Netflix’s margins. But wait, say the Netflix bulls. I should focus my attention on the company’s expanding domestic streaming margins. This is true, if you carelessly ignore the accounting gimmicks that Netflix CFO David Wells freely acknowledges. On the recent investor call, here is Wells’s description of the company’s expense diversion trickery by geography:
“So by growing faster internationally, and putting that [content expense] allocation more towards international, it’s going to provide some relief to those global originals, and the global projects that we do have, that are allocated to the U.S.”
In other words, Wells admits shoving a lot of domestic content costs into the international segment to make domestic profit margins look better (higher). Longer term, perhaps this allocation could make some sense, but for now I’m not convinced viewers in Luxembourg are watching Orange is the New Black and House of Cards like they are in the U.S.
Technology: Amazon Doing the Heavy Lifting
If check writing and accounting diversions aren’t a competitive advantage, does Netflix have a technology advantage? That’s tough to believe when Netflix effectively outsources all their distribution technology to Amazon.com Inc (AMZN).
Here’s how Netflix describes their technology relationship with Amazon:
“We run the vast majority of our computing on [Amazon Web Services] AWS. Given this, along with the fact that we cannot easily switch our AWS operations to another cloud provider, any disruption of or interference with our use of AWS would impact our operations and our business would be adversely impacted. While the retail side of Amazon competes with us, we do not believe that Amazon will use the AWS operation in such a manner as to gain competitive advantage against our service.”
Call me naïve, but something tells me Amazon could be stealing some secret pointers and best practices from Netflix’s operations and applying them to their Amazon Prime Instant Video offering. Nah, probably not. Like Netflix said, Amazon wouldn’t steal anything to gain a competitive advantage…never.
Regardless, the real question surrounding Netflix should focus on whether a $35 billion valuation should be awarded to a money losing content portal that distributes content through Amazon? For comparison purposes, Netflix is currently valued at 20% more than Viacom Inc (VIA), the owner of valuable franchises and brands like Paramount Pictures, Nickelodeon, MTV, Comedy Central, BET, VH1, Spike, and more. Viacom, which was spun off from CBS 44 years ago, actually generated about $2.5 billion in cash last year and paid out about a half billion dollars in dividends. Quite a stark contrast compared to a company accelerating its cash losses.
I openly admit Netflix is a wonderful service, and I have been a loyal, longtime subscriber myself. But a good service does not necessarily equate to a good stock. And despite being short the stock, Sidoxia is actually long the company’s bonds. It’s certainly possible (and likely) Netflix’s stock will underperform from today’s nosebleed valuation, but under almost any scenario I can imagine, I have a difficult time foreseeing an outcome in which Netflix would go bankrupt by 2021. Bond investors currently agree, which explains why my Netflix bonds are trading at a 5% premium to par.
Netflix stockholders, and crazy disciples like Mark Cuban, on the other hand, may have more to worry about in the coming quarters. CEO Reed Hastings is sticking to his “burn it and they will come” strategy at all costs, but if profits and cash don’t begin to pile up quickly, then Netflix’s “Field of Dreams” will turn into a “Field of Nightmares.”

Wade W. Slome, CFA, CFP®
Plan. Invest. Prosper.
DISCLOSURE: Sidoxia Capital Management (SCM) and some of its clients hold positions in certain exchange traded funds (ETFs), AAPL, GOOGL, AMZN, long Netflix bond position, long Dish Corp bond, and a short position in NFLX, but at the time of publishing, SCM had no direct position in VIA, TWX, SNE, or any other security referenced in this article. No information accessed through the Investing Caffeine (IC) website constitutes investment, financial, legal, tax or other advice nor is to be relied on in making an investment or other decision. Please read disclosure language on IC Contact page.
Forecasting Recipe: Trend Analysis & Sustainability

Forecasting financial performance of a company requires a fairly simple recipe: one part trend analysis and one part determining sustainability. On the surface, forecasting sounds pretty easy. While discovering certain financial trends can be straightforward, the ability to ascertain the durability of a trend can become endlessly complex.
Before you become Nostradamus and spreadsheet your way to the Wall Street Hall of Fame, an accurate forecaster must first build a firm understanding of a company and the underlying industry. Unfortunately for the predictor, not all companies and industries are created equally. Evaluating the profit dynamics of Cheesecake Factory Inc. (CAKE), an upscale casual chain of restaurants, is quite different from deciphering the financials of 3SBio (SSRX), a Chinese biotech company focused on recombinant products. Regardless of the thorniness of the company or industry, before you can truly look out into the future, the investor should learn the language of the company. For example, learning the importance of “comparable store sales” and “sales per square foot” for CAKE may be just as important as learning about the “Phase III FDA trial endpoint” and “pipeline” for SSRX.
Because you could spend a lifetime following just one company – for instance General Electric Co. (GE) or Microsoft Corp. (MSFT) – and never make an investment, you would probably be better served by applying a framework that allows you to research and analyze multiple industries and companies. There are various tools, whether you consider Harvard professor Michael Porter’s Five Forces or SWOT analysis (Strengths Weaknesses Opportunities Threats), and each provides a template or process to use when tearing apart specific companies and industries.
Nuts & Bolts of Forecasting
Before you can identify a trend, you first need to gather the data. For all companies I examine, I first compile a quarterly and annual income statement, balance sheet, and cash flow statement – those that have followed me know the extreme importance I place on the cash flows of a business. In general a good start is to create common size financial statements for the income statement and balance sheet. Basically, this exercise creates an income statement and balance sheet in percentage terms – usually expressed as a percentage of net sales (income statement) and as a percentage of total assets (balance sheet). Earnings forecasts are often used as a logical starting point for driving the shape of future results across the financials, but further insight can be gleaned by comparing year-over-year (this year vs. last) and sequential (this quarter vs. last quarter) growth rates for key figures.
These common statements will then serve as the foundation of identifying the trends, and force the forecaster to seek answers to random questions like these?
- Why is depreciation expense going down even though the company is expanding retail stores?
- Gross margins increased for seven consecutive quarters for a total of 250 basis points (2.5%), however in the recent quarter margins declined by 175 basis points…why?
- Long-term debt increased by $200 million in the current quarter, but if the company just issued $325 million in equity last quarter, then why do they need new capital?
Many of these types of questions may have logical explanations, but by getting answers the analyst will be in a position to better understand the business issues affecting financial performance and to better forecast future economic values.
Forecasting Your Way to Wrongness
A lot can go wrong with forecasting, principally in the assumptions used for the forecast. As the character Felix Unger from the Odd Couple stated, “You should never “assume.” You see, when you “assume,” you make an “ass”… out of “you”… and “me.”” Often assumptions do not consider the inclusion of important economic shocks or unexpected factors, such as recessions, currency fluctuations, management turnover, lawsuits, accounting changes, new products, restructurings, acquisitions, divestitures, flash crashes, Greek debt downgrades, regulatory reform…yada…yada…yada (you get the idea). To get a better sense for a range of outcomes, sensitivity analysis can be employed to determine a “base case” outcome in conjunction with a rosier “upside case” and more conservative “downside case.” Worth noting is the impact debt levels can have on the variance of outcomes – I think Bear Stearns and Lehman Brothers would concur with this point.
Pinpointing variable financial figures is quite difficult. Different companies and industries inherently have more or less predictable attributes. Predicting when the sun will rise and set is quite a bit more predictable than predicting what Intel Corp’s (INTC) gross margins will be on a quarterly basis. As mentioned earlier, layering on debt can increase the volatility of earnings forecasts as well.
Forecasting is essential in the investment world, but even if you were the best forecaster in the world, investors cannot disregard the importance of valuation skills. The art of valuation is just as important, if not more important than being right on your financial scenarios.
All in all, the recipe of forecasting sounds simple if you look at the basic ingredients of trend and sustainability analysis. However, before the ultimate forecast comes out of the oven, this straightforward recipe requires a lot of preparation, whether it is slicing and dicing cash flow figures, whipping up some margin trends, or measuring up sales growth. Any way you cut it, systematically following a recipe of trend and sustainability analysis is a non-negotiable requirement if you want to heat up superior financial results.
Wade W. Slome, CFA, CFP®
Plan. Invest. Prosper.
*DISCLOSURE: Sidoxia Capital Management (SCM) and some of its clients own certain exchange traded funds, but at the time of publishing SCM had no direct positions in GE, MSFT, CAKE, SSRX, INTC, JPM/Bear Stearns, Lehman Brothers, or any other security referenced in this article. No information accessed through the Investing Caffeine (IC) website constitutes investment, financial, legal, tax or other advice nor is to be relied on in making an investment or other decision. Please read disclosure language on IC “Contact” page.


