Posts tagged ‘leading indicators’
The Dirty Little Stock Market Secret

Shhhh…don’t tell anyone, I have a dirty little secret. Are you ready? Are you sure? The world is not going to end…really.
Despite lingering trade concerns (see Trump Hits China with Tariffs on $200 Billion in Goods), Elon Musk being sued by the Securities and Exchange Commission (SEC) for tweeting his controversial intentions to take Tesla Inc. (TSLA) private, and Supreme Court nominee, Brett Kavanaugh, facing scandalous sexual assault allegations when he was in high school, life goes on. In the face of these heated headlines, stocks still managed to rise to another record in September (see Another Month, Another Record). For the month, the Dow Jones Industrial Average climbed +1.9% (+7.0% for 2018), the S&P 500 notched a +0.4% gain (+9.0% for 2018), while the hot, tech-laden NASDAQ index cooled modestly by -0.8% after a scorching +17.5% gain for the year.
If the world were indeed in the process of ending and we were looking down into the abyss of another severe recession, we most likely would not see the following tangible and objective facts occurring in our economy.
- New Revamped NAFTA (North American Free Trade Agreement) 2.0 trade deal between the U.S., Mexico, and Canada was finalized (new deal is called United States-Mexico-Canada Agreement).
- Leading Economic Indicators are at a record high (a predictive statistic that historically falls before recessionary periods – in gray)
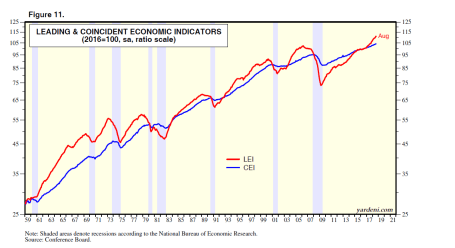
Source: Yardeni.com
- Unemployment Rate of 3.9% is near a record low
- Small Business Optimism is near record highs
- Consumer Confidence is near record highs
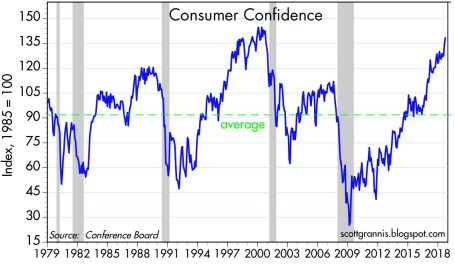
Source: Scott Grannis
- Corporate Profits are at record highs
- Interest Rates remain at historically low levels despite the Federal Reserve’s actions to slowly migrate their interest rate target higher
- Economic Growth (GDP) accelerating to +4.2% growth rate in the recent quarter
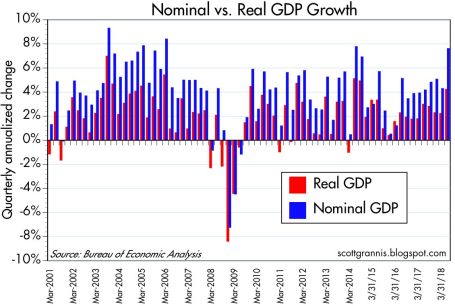
Source: Scott Grannis
Are we closer to a recession with the stock market potentially falling 20-30% in value? As I have written on numerous occasions, so-called pundits have been falsely forecasting recessions over the last decade, for as long as this bull market has been alive (see Professional Double-Dip Guesses are “Probably” Wrong).
Why so much investor angst as stock prices continue to chug along to record levels? One reason is investors are used to historically experiencing a recession approximately twice a decade on average, and we have yet to suffer one since the Great Recession around 10 years ago. While the mantra “we are due” for a recession might be a true statement, the fact also remains that this economic recovery has been the slowest since World War II, which logically could argue for a longer expansionary period.
What also holds true is that corporate profits already experienced a significant “profit recession” during this economic cycle, post the 2008-2009 financial crisis. More specifically, S&P 500 operating profits declined for seven consecutive quarters from December 2014 through June 2016. The largest contributors to the 2014-2016 profit recession were collapsing oil and commodity prices, coupled with a rapid appreciation in the value of the U.S. dollar, which made our exports more expensive and squeezed multinational corporation profits. The stock market eventually digested these profit-crimping headwinds and resumed its ascent to record levels, but not before the S&P 500 remained flat to down for about a year and a half (2014-2016).
Doom-and-gloom, in conjunction with toxic politics, continue to reign supreme over the airwaves. If you want in on a beneficial dirty little secret, you and your investments would be best served by ignoring all of the media noise and realizing the world is not going to end any time soon.

Wade W. Slome, CFA, CFP®
Plan. Invest. Prosper.
This article is an excerpt from a previously released Sidoxia Capital Management complimentary newsletter (October 1, 2018). Subscribe on the right side of the page for the complete text.
DISCLOSURE: Sidoxia Capital Management (SCM) and some of its clients hold positions in certain exchange traded funds (ETFs), but at the time of publishing had no direct position in TSLA or any other security referenced in this article. No information accessed through the Investing Caffeine (IC) website constitutes investment, financial, legal, tax or other advice nor is to be relied on in making an investment or other decision. Please read disclosure language on IC Contact page.
Have Peripheral Colds Caused a U.S. Recession Flu?

At the trough of the recent correction, which was underscored by a brief but sharp -1,100 point drop in the Dow Jones Industrial Average, the Dow had temporarily corrected by -16.2% from its peak in May, earlier this year. Whether we retest or break below the 15,370 level again is debatable, but with the Dow almost reaching “bear market” (-20%) territory, it begs the question of whether the U.S. has caught a recessionary flu from the ill international markets’ colds?
Certainly, several factors have investors concerned about a potential recession, including the following: slowing growth and financial market instability in China; contraction of -0.4% in Japan’s Q2 GDP growth; and turmoil in emerging markets like Russia and Brazil. With stock prices down more than double digits, it appears investors factored in a significant chance of a recession occurring. Although the Tech Bubble of 2000 and generational Great Recession of 2008-2009 were no ordinary recessions, your more garden variety recessions like the 1980 and 1990 recessions resulted in peak to trough declines in the Dow Jones Industrial Average of -20.5% and -22.5%, respectively.
In other words, with the Dow recently down -16.2% in three months, investors were awfully close to factoring in a full blown U.S. recession. Should this be the case? In answering this question, one must certainly understand the stock market is a predicting or discounting mechanism. However, if we pull out our economic thermometers, right now there are no definitive indicators sending us to the recessionary doctor’s office. Here are a number of the indicators to review.
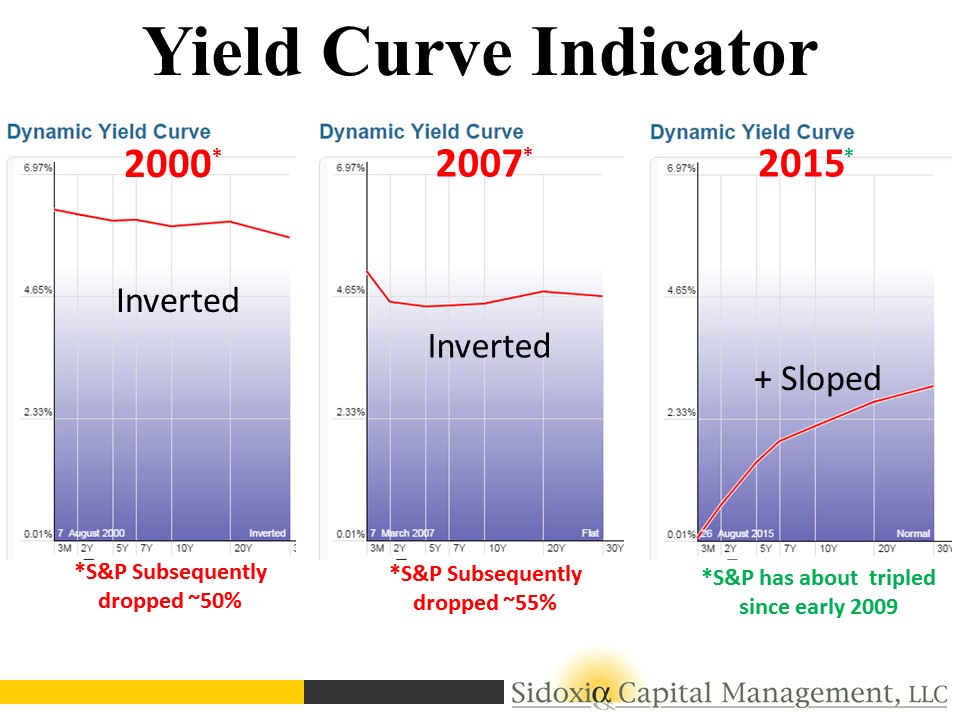
Yield Curve Indicator
For starters, let’s take a look at the yield curve. Traditionally, in a normally expanding economy, we would normally expect inflationary expectations and a term premium for holding longer maturity bonds to equate to a positively shaped yield curve (e.g., shorter term 2-Year Treasuries with interest rates lower than 30-Year Treasuries). Interestingly, historically an inverted yield curve (shorter term interest rates are higher than longer term rates) has been an excellent leading indicator and warning signal for unhealthy stock market conditions forthcoming.
As you can see in the charts below, before the two preceding recessions, in the years 2000 and 2007, we experienced an inverted yield curve that served as a tremendous warning signal in advance of significant downdrafts in stock prices. If you fast forward to today, the slope of the yield curve is fairly steeply sloped – nowhere close to inverted. When the yield curve flattens meaningfully, I will become much more cautious.
The Oil Price Indicator
There is substantial interest and focus on the recessionary conditions in the energy sector, and more specifically the high yield (junk bond) issuers that could suffer. It is true that high yield energy credit spreads have widened, but typically this sector’s pain has been the economy’s gain, and vice versa. The chart below shows that the gray shaded recessionary time periods have classically been preceded by spikes upward in oil prices. As you know, we currently are experiencing the opposite trend. Over the last 12 months, WTI oil prices have been chopped by more than half to $45 per barrel. This is effectively a massive tax for consumers, which should help support the economy.
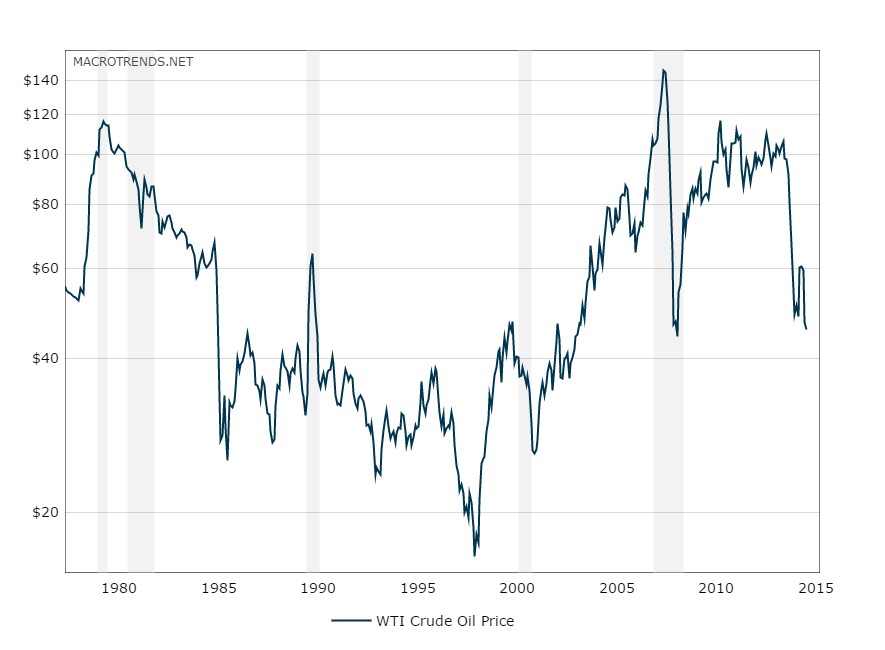
Source: MacroTrends.Net
Other Macro Statistics
Toward the top of any recession-causing, fear factor list right now is China. Slowing economic growth and an unstable Shanghai stock market has investors nervously biting their nails. Although China is the 2nd largest global economy behind the U.S., China still only accounts for about 15% of overall global economic activity, and U.S. exports to the region only account for about 0.7% of our GDP, according to veteran Value investor Bill Nygren. If on top of the China concern you layer a fairly strong U.S. labor market, an improving housing market (albeit slowly), and a recently revised higher GDP statistics, you could probably agree the economic dashboard is not signaling bright red flashing lights.
There is never a shortage of concerns to worry about, including most recently the slowing growth and stock market turbulence in China. While volatility may be implying sickness and international markets may be reaching for the Kleenex box, the yield curve, oil prices, and other macroeconomic indicators are signaling the outlook for U.S. stock remains relatively healthy.

Wade W. Slome, CFA, CFP®
Plan. Invest. Prosper.
DISCLOSURE: Sidoxia Capital Management (SCM) and some of its clients hold positions in certain exchange traded funds (ETFs) , but at the time of publishing, SCM had no direct position in any other security referenced in this article. No information accessed through the Investing Caffeine (IC) website constitutes investment, financial, legal, tax or other advice nor is to be relied on in making an investment or other decision. Please read disclosure language on IC Contact page.


