Posts tagged ‘iran war’
Bombs Away – Iran & Oil Spark an Explosive Month

The stock market felt the blast of geopolitical tension last month as all three major domestic indexes all retreated. In March, the S&P 500 fell -5.1%, the Dow Jones Industrial Average dropped -5.4%, and the NASDAQ slid -4.8%.
While a -5% monthly drop grabs headlines, perspective and context are key. Since the start of 2023, the S&P 500 remains up approximately +70% (excluding dividends). Even after the recent -7% pullback from January’s record highs, the index is still trading +35% above its April 2025 lows.
The Strait Has Created An Oil Gate
The primary catalyst for the market volatility is the escalating conflict involving the U.S., Israel, and Iran. Beyond the tragic human cost, the economic “bomb” has been the disruption of the Strait of Hormuz, which handles the flow of roughly 20% of the world’s oil supply.
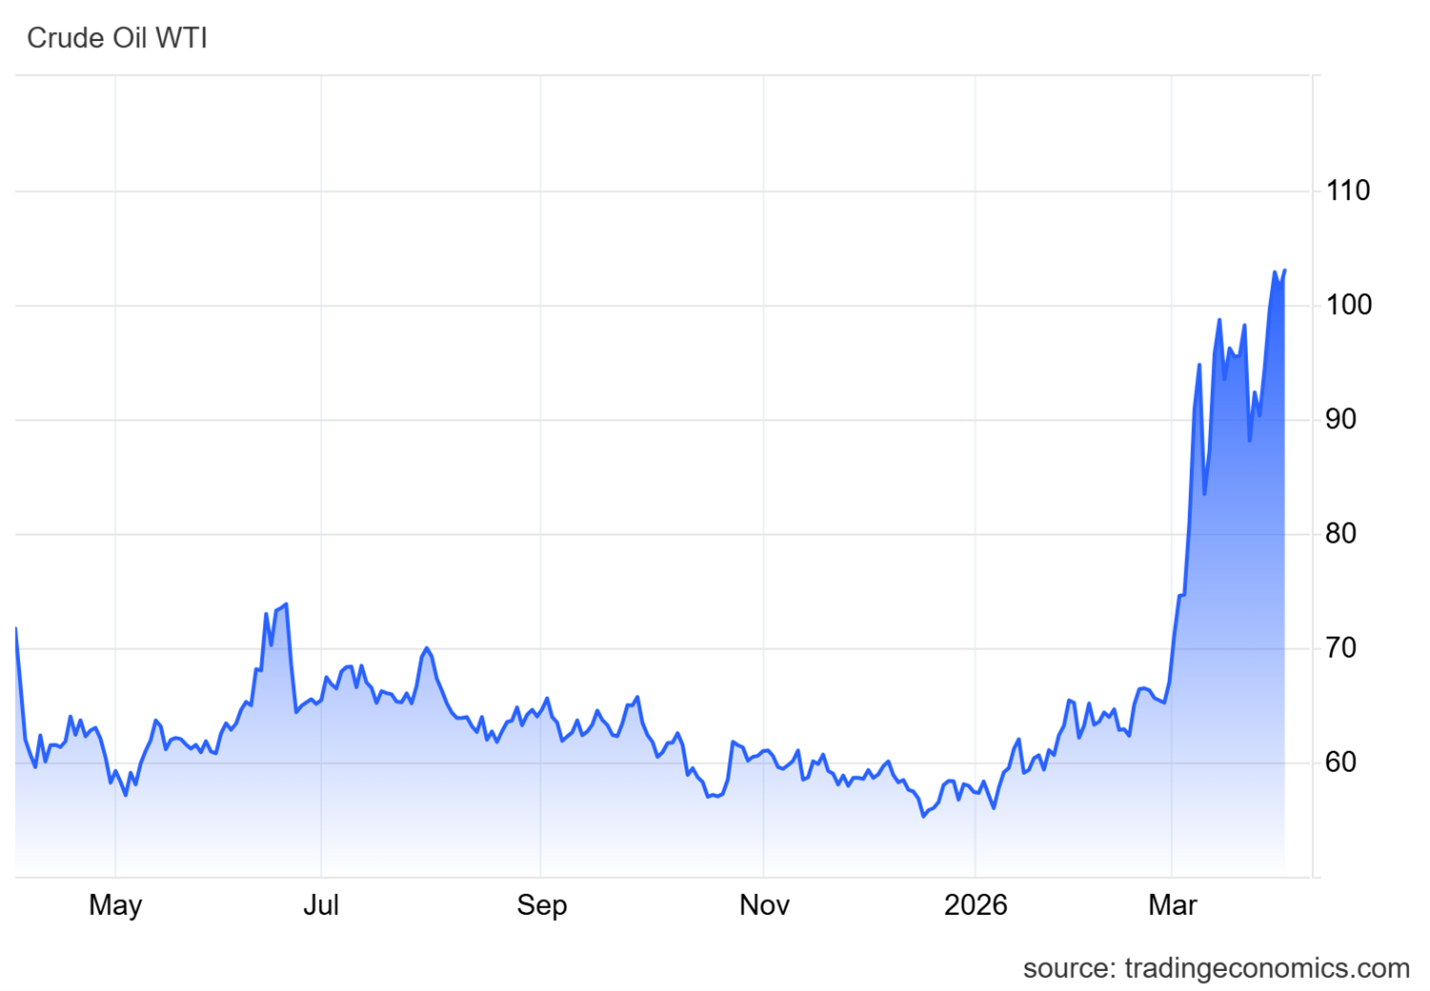
Basic economics dictates that when supply is choked, prices skyrocket. We saw exactly that: WTI Crude spiked roughly +54% over the last month, surging from $67 to a peak near $103 per barrel (see chart below).
The “energy tax” from higher oil prices has introduced four major stressors for investors:
- Drained Consumer Wallets: Every extra dollar spent at the pump is a dollar not spent on groceries, healthcare, or retail. Since consumers disproportionately control the U.S. economy, cuts in discretionary spending on things like vacations, cars, and houses has a material negative impact on the nation’s financial output.
- Widespread Industrial Shock: High oil prices inflate costs for almost every physical industry, including airline fuel, trucking logistics, petroleum-based fertilizers, and construction inputs like asphalt and steel.
- Labor Market Cooling: The February jobs report was a wake-up call, showing a loss of -92,000 jobs (well below the expected gain of +130,000). While AI-driven displacement is a factor, the sudden spike in energy overhead has clearly contributed to employers pausing their hiring.
- Recessionary Red Flags: Prediction markets like Polymarket now place the probability of a U.S. recession by the end of 2026 at 34.5%, up significantly from just a few months ago (see chart below).
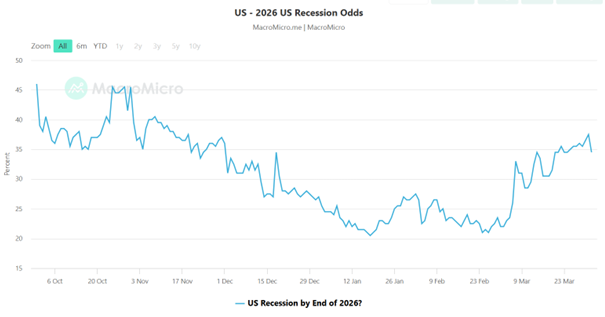
Source: MacroMicro & Polymarket
Geopolitical Noise vs. Market Reality
While current volatility feels unique, seasoned investors have seen this movie before. It is easy to forget that the S&P 500 slumped -21% last year as markets grappled with the administration’s aggressive tariff strategies, only to see prices roar back once the initial shock subsided. Even with the recent -7% pullback from January’s record highs, the S&P 500 remains +35% higher than the lows of April 2025.
Both the tariff friction and the Iranian conflict could be viewed as “self-inflicted” geopolitical maneuvers. While the long-term economic gains of these high-stakes decisions are still being debated, one short-term reality is certain: the November midterm elections are fast approaching.
History suggests that as elections loom, the administration will prioritize stability and “voter-friendly” economic conditions. We are already seeing a shift in rhetoric that suggests an “off-ramp” for the Iran conflict may be closer than the headlines imply. President Trump is addressing the nation today with an update on the current situation. When political capital is on the line, pragmatic pivots often follow unpopular volatility. What does this mean for investors? This means we are likely closer to the end of this Iranian conflict than we are to the beginning.
The Resilience of History
The last decade has been a relentless cycle of “unprecedented” global unrest. However, as the timeline below illustrates, geopolitical shocks have historically acted as speed bumps, not roadblocks, for long-term equity growth:
- 2026: Maduro Kidnapping (Venezuela)
- 2025: Operation Midnight Hammer (Iran)
- 2024: Collapse of the Assad Regime (Syria) & Moscow Terrorist Attack
- 2024: Houthi Red Sea Attacks
- 2023: Israel-Hamas Conflict
- 2022: Russia-Ukraine Invasion
- 2021: U.S. Withdrawal from Afghanistan
- 2017: North Korean “Fire and Fury”
- 2016: Brexit
- 2015: Paris Terrorist Attacks
The Bottom Line: Since the beginning of 2015, the S&P 500 has more than tripled (+217%). The data is clear: even in the face of horrific global events, the market’s primary engine – corporate innovation and earnings – tends to prevail. In the world of investing, a timeless (if cynical) truth remains: “When missiles fly, it’s time to buy!”
The Fed’s “Wet Towel”
This oil-driven inflation has also doused hopes for aggressive monetary easing. At the start of the year, the appointment of Kevin Warsh as the incoming Fed Chairman (set to succeed Jerome Powell in May) led markets to price in multiple rate cuts. However, the March “dot plot” (see chart below) revealed a much more hawkish reality. The Federal Reserve now projects only one 25-basis-point cut for the remainder of 2026, bringing the target range to 3.25%–3.50%. Seven officials now see zero cuts this year, reflecting a “higher for longer” stance as they battle renewed energy-led inflation.
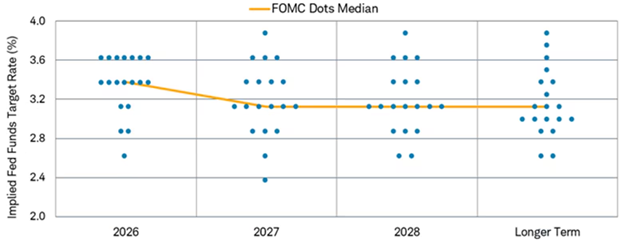
Source: Charles Schwab
The Sidoxia Strategy: Don’t Fear the Turbulence
History reminds us that while geopolitical shocks are terrifying in the moment, their impact on diversified portfolios is almost always temporary. Since 2015, the S&P 500 has more than tripled (+217%) despite a decade defined by the Russia-Ukraine war, the collapse of the Assad regime, and various “Operation Midnight Hammer” style conflicts.
As we look toward the November midterm elections, we expect political rhetoric to shift toward stabilization. President Trump has already signaled that an “offramp” for the Iranian conflict may be approaching, as high energy prices are rarely a winning campaign strategy. At Sidoxia, we aren’t distracted by the noise of the “bombs.” We continue to focus on fundamental valuations and opportunistically use this volatility to improve our clients’ positioning. In the world of investing, the best time to stay disciplined is exactly when everyone else is looking for the exit.
Wade W. Slome, CFA, CFP®
Plan. Invest. Prosper.
This article is an excerpt from a previously released Sidoxia Capital Management complimentary newsletter (Apr. 1, 2026). Subscribe Here to view all monthly articles.
DISCLOSURE: Sidoxia Capital Management (SCM) and some of its clients hold positions in certain exchange traded funds (ETFs), but at the time of publishing had no direct position in any other security referenced in this article. No information accessed through the Investing Caffeine (IC) website constitutes investment, financial, legal, tax or other advice nor is to be relied on in making an investment or other decision. Please read disclosure language on IC Contact page.
Mideast War an Investor Bore as Markets Soar

If I told you at the beginning of the year that the U.S. would bomb key nuclear sites in Iran, would you have guessed that Middle East stability would follow—and that global financial markets would soar to record highs? Personally, I wouldn’t have bet on that outcome. But that’s exactly what happened last month. While geopolitical dynamics remain fluid, markets shrugged off the chaos. The S&P 500 rallied +5.0%, the Dow Jones Industrial Average climbed +4.3%, and the NASDAQ catapulted +6.6%, powered largely by artificial intelligence stocks like NVIDIA Corp., which surged +16.9% for the month to a market value of $3.9 trillion (more on AI below). This is an important reminder that trading off of news headlines is a fool’s errand.
Economy Resilient Despite Tariffs and Geopolitical Turmoil
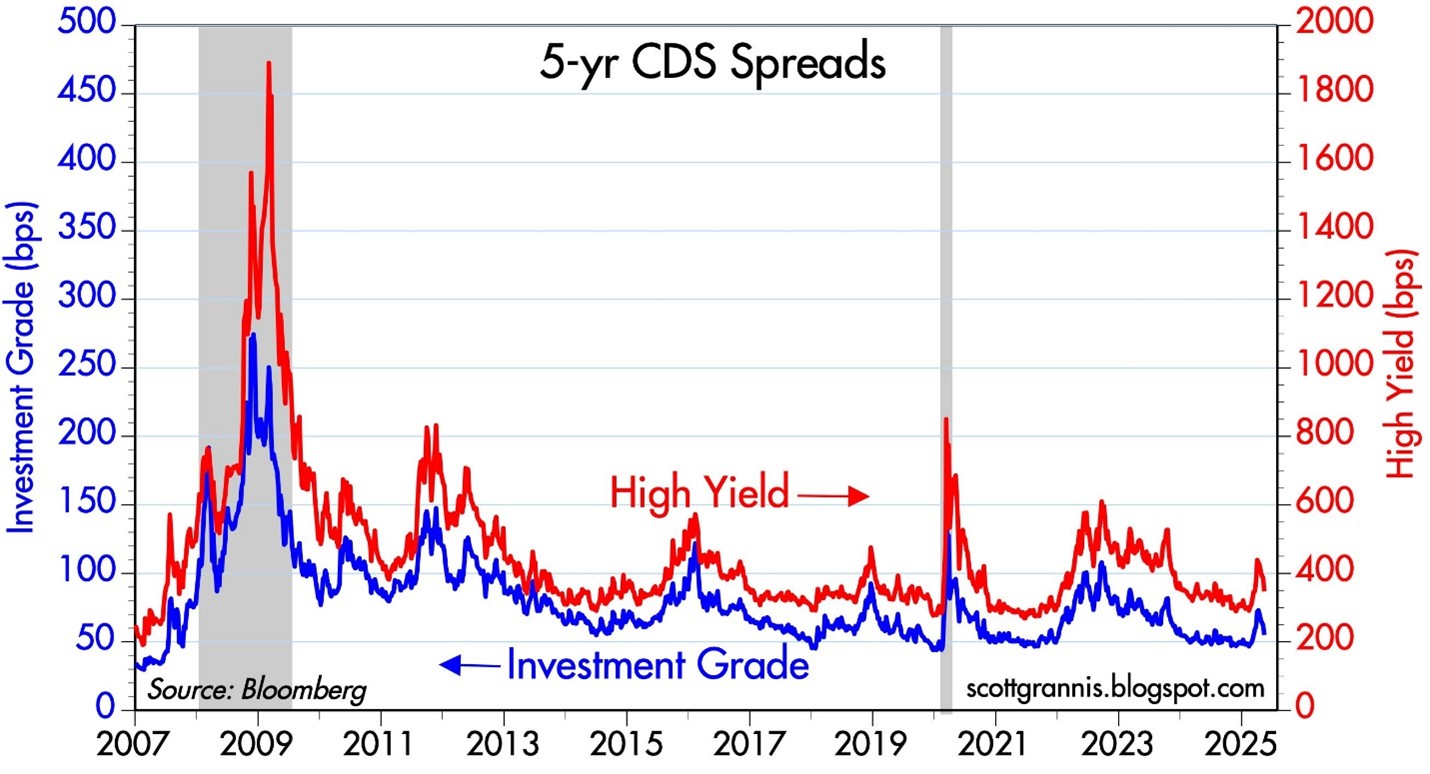
Source: Calafia Beach Pundit
Credit Default Swaps (CDS) act as insurance contracts that protect investors against corporate debt defaults. During financial stress—like the 2008 crisis or the COVID crash in 2020—CDS prices surge as investors seek protection. Today, however, CDS prices are falling across both high-yield (junk bonds) and investment-grade (Blue Chip) debt. As seen in the chart above, the cost to insure corporate bonds has declined steadily over the past two years. This signals bond investors aren’t worried about a recession or a wave of defaults, despite tariff policy uncertainty, geopolitical risk, and modest GDP growth.
Inflation Tame as Tariffs Loom
President Trump has repeatedly criticized Fed Chair Jerome Powell for not cutting interest rates, calling him everything from a “dummy” to a “major loser” and a “stupid person” to a “numbskull”. While the name-calling is colorful, the economic pressure is real: U.S. GDP contracted -0.5% in Q1 2025. Powell, however, wants to see the full impact of upcoming tariffs before making a move. . A new tariff deadline looms on July 9th, and the market is anxiously awaiting clarity. But even if tariffs are implemented, many economists believe the inflationary impact will be temporary—what’s known as a one-time price shock.
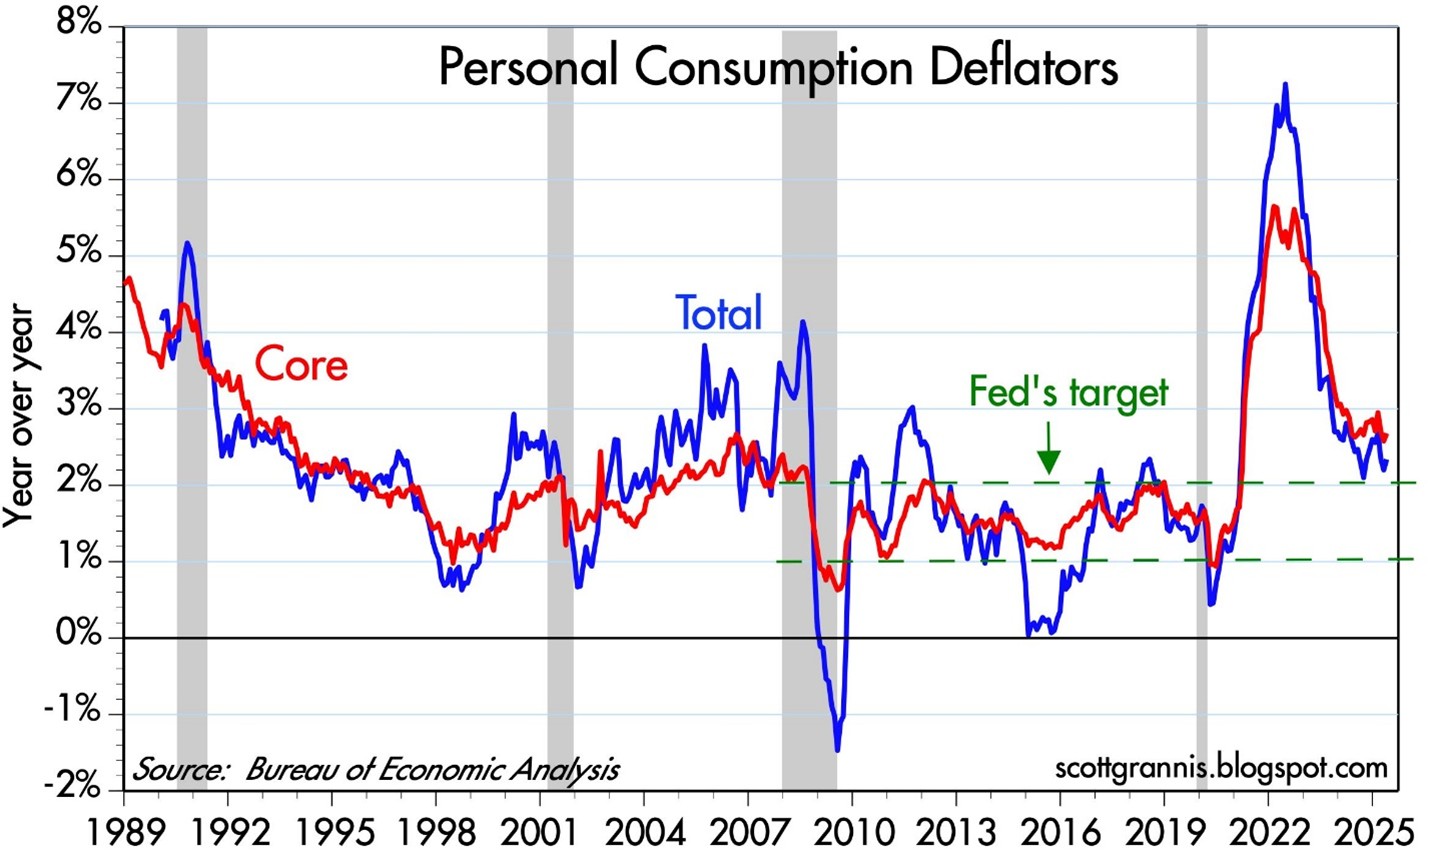
Source: Calafia Beach Pundit
The Fed’s preferred inflation gauge—the Personal Consumption Expenditure (PCE) index—has been easing and is now near the 2% target (see chart above). With inflation cooling, Trump’s case for rate cuts gains credibility. Still, the Fed appears in no rush. It will take time to understand the lasting effects of the tariff rollout.
AI Wave Fueling Markets
For a generation, the semiconductor revolution has quietly powered innovation, guided by Moore’s Law—the principle that chip performance doubles roughly every two years (see my article The Traitorous 8). Sixty years after Gordon Moore wrote his seminal article, “Cramming More Components onto Integrated Circuits”, the power of software is catching up. NVIDIA’s Grace Blackwell GB200 chip contains an astronomical 208 billion transistors, supercharging AI software models like ChatGPT.
The AI revolution is fueling trillions in global investment and rapidly transforming industries – from data centers and self-driving cars to robotics and drug discovery. It’s important to realize that this AI arms race is not just occurring in the United States. AI investment spending extends way beyond Silicon Valley to countries like Saudi Arabia, Singapore, and China.
The AI boom is not a U.S.-only phenomenon. Countries like China, Saudi Arabia, and Singapore are pouring capital into AI, creating a global arms race in tech. In the U.S., the four biggest hyperscalers—Amazon, Microsoft, Google, and Meta—are projected to spend over $300 billion on capital expenditures in 2025 alone (see chart below).
To illustrate the scale: Amazon is forecasted to spend more than $100 billion in CapEx this year. For context, that’s 40% more than the company spent over the entire 2000–2020 period combined.
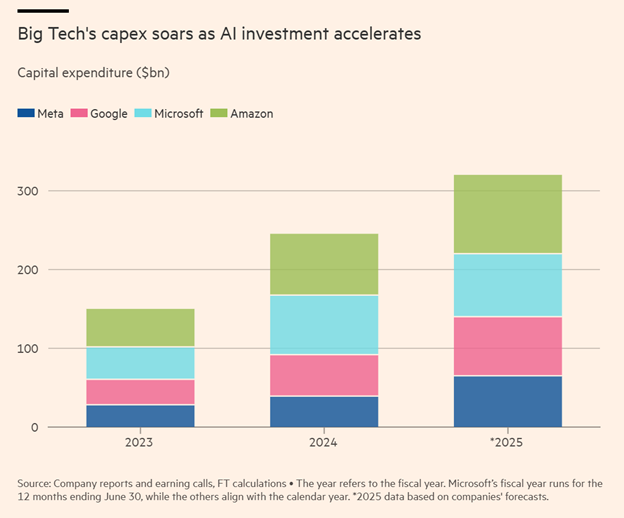
Source: The Financial Times
The Stargate Initiative: AI Infrastructure on a Galactic Scale
A prime example of the AI gold rush is the $500 billion Stargate initiative, with Phase 1 already underway in Abilene, Texas (see rendering below). The initial construction includes two buildings totaling 1,000,000 square feet. Ultimately, the full project will cove about 1,000 acres and be powered by an on-site natural gas facility generating 360 megawatts—enough to support 300,000 homes.
A huge portion of the project costs are dedicated to the budget for NVIDIA super chips. Oracle Corp. has committed $40 billion to purchase 400,000 of NVIDIA’s GB200 chips, making this project a centerpiece of the global AI infrastructure boom. Just this week, Oracle also announced a new $30 billion cloud deal, which will soak up a good chunk of the data center supply created by the database and enterprise software company.
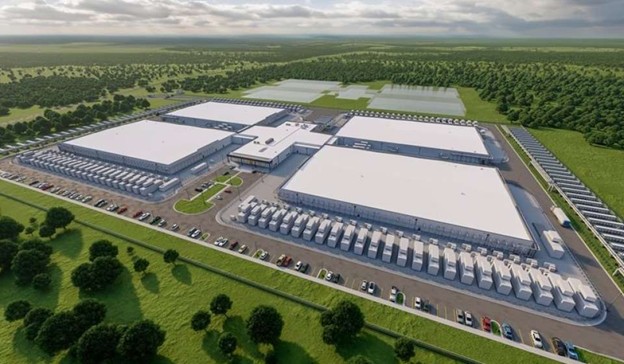
Source: CoStar
The Big Picture: Volatility and Opportunity
There’s no shortage of risk—geopolitics, inflation, Fed uncertainty, tariffs. But the economy is showing surprising resilience. If tariff clarity improves, interest rate cuts materialize, and AI capital spending accelerates, a “boring” market could rapidly turn into a soaring one.
Wade W. Slome, CFA, CFP®
Plan. Invest. Prosper.
This article is an excerpt from a previously released Sidoxia Capital Management complimentary newsletter (July 1, 2025). Subscribe Here to view all monthly articles.
DISCLOSURE: Sidoxia Capital Management (SCM) and some of its clients hold positions in certain exchange traded funds (ETFs), but at the time of publishing had no direct position in any other security referenced in this article. No information accessed through the Investing Caffeine (IC) website constitutes investment, financial, legal, tax or other advice nor is to be relied on in making an investment or other decision. Please read disclosure language on the IC Contact page.


