Posts tagged ‘interest rates’
The SaaSpocalypse Has Arrived…Or Has It?

Well, the new month has started with a bang. Financial markets have not only experienced a bang from another military strike on Iran, but also an explosion of AI paranoia. As hundreds of billions of AI investment dollars flood into the economy, fears are intensifying that the AI displacement of workers could have a detrimental impact on the economy and financial markets.
The Monthly Scorecard
It was a mixed performance in the market last month. Geopolitical headlines surrounding Iran and the Middle East are currently front and center, but under the surface, the real story isn’t just geopolitics—it’s a growing investor anxiety around artificial intelligence and its disruptive potential. Here’s what happened last month:
- S&P 500: -0.9%
- Dow Jones Industrial Average: +0.2%
- NASDAQ: -3.4%
The “SaaSpocalypse” and the Tech Identity Crisis
Software stocks are currently under assault, plunging -9.7% for the month and a staggering -22.8% for the start of the year (as measured by the IGV iShares Software index). Analysts are calling this the “SaaSpocalypse” (Software as a Service)—a phenomenon where the market fear is that AI is “eating” software companies.
High-profile casualties have added fuel to the fire. IBM, for example, suffered its worst trading day in 25 years, dropping -13% in a single day. Concerns came to light that new AI agent coding tools like Anthropic’s Claude Code could threaten IBM’s legacy dominance in COBOL-based mainframe systems.
Paranoia vs. Reality
This “AI Paranoia” has spread far beyond Silicon Valley, infecting industries like transportation, banking, travel, real estate, and food delivery. Two major catalysts fueled this fire:
The Citrini Report: A viral, dystopian report from described an “avalanche” of white-collar firings (see chart below). The report argues that while the government may try to intervene with stimulus, it “won’t change the fact that an AI Claude agent can do the work of a $180,000 product manager for $200/month.”
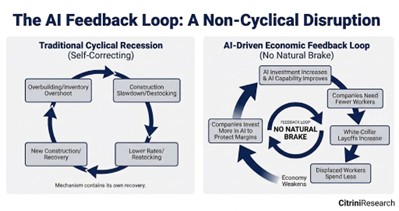
Source: Citrini Research
- Corporate Reductions: High-profile cuts have validated these fears. Block Inc. (led by Jack CEO Dorsey, former Twitter Founder) announced it is slashing 40% of its workforce due to AI advancements, while Amazon recently eliminated 30,000 white-collar positions (10% of its corporate staff).
However, there is a silver lining to that perspective. While software jobs have flattened since ChatGPT arrived in late 2022, we have yet to see the “cliff dive” in total employment that many predicted. In fact, employment (165 million employed) and labor force (172 million) figures are near record levels, so we have not seen AI kill the economy quite just yet (see chart below).
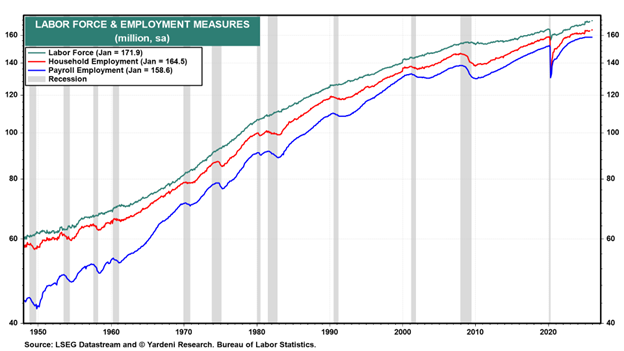
Source: Yardeni Research and Bureau of Labor Statistics
The Great Rotation: Looking for “HALO”
As investors try to decipher the winners and losers, they are migrating away from technology and rotating into HALO stocks (Hard Asset, Low Obsolescence). These companies are seen as less susceptible to AI disruption. Evidence of this shift is clear in the outperformance of value, small-cap, and mid-cap stocks. Notably, the Dow Jones Industrial Average, an index heavy with hard asset exposure, just posted its 10th consecutive month of gains despite the broader technology stock volatility.
A Massive Bet on the Future
Despite the “bubble” murmurs, the AI juggernauts are doubling down. OpenAI just closed the largest private financing in history, raising $110 billion—including $50 billion from Amazon, $30 billion from NVIDIA, and $30 billion from SoftBank. The demand for compute and data centers remains insatiable, supported by the $700 billion being spent by the large hyperscalers (Amazon, Alphabet-Google, Microsoft, and Meta Platforms) this year.
Geopolitical and Legal Headwinds
Adding to the month’s complexity are external shocks:
- Middle East Tensions: Military strikes on Iran recently killed the Iranian Supreme Leader, Ali Khamenei, and other key leaders, injecting significant geopolitical risk.
- Tariff Uncertainty: The Supreme Court recently ruled against the IEEPA tariffs instituted by the Trump administration. While temporary alternatives are in place, the markets are waiting for a permanent solution to work through the courts.
Resilience in the Face of Technological Change
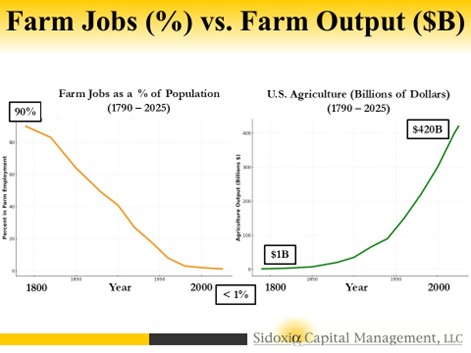
It is easy to get lost in the dystopian narrative, but history offers a more hopeful guide. Technology has been replacing human workers for centuries—from the looms of the Industrial Revolution to the tractors of the Agricultural Revolution – see chart below (1790 – 2025). In every instance, while specific roles were displaced, new industries emerged that not only soaked up the unemployed but expanded the labor force into areas we couldn’t have previously imagined (see also The Fallacy Behind Technological Innovation).
The reality today is that the economy remains remarkably strong. Employment data is resilient, labor force participation is near record levels, and corporate profits are breaking out to new all-time highs. Furthermore, the ISM Manufacturing PMI (Purchasing Managers Index) recently spiked to 52.6, signaling an expansion in a sector that had been declining for years (see chart below).
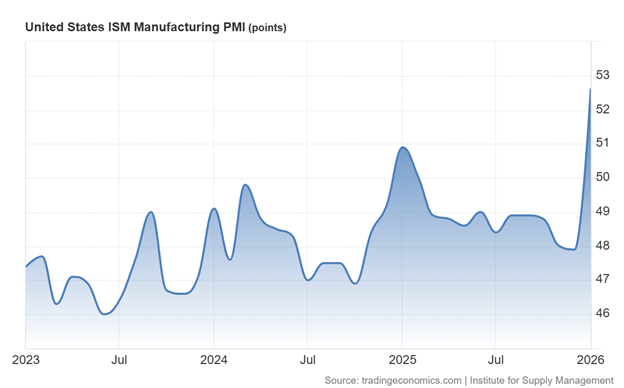
Source: Trading Economics
We are not witnessing the end of work, but rather a high-speed evolution. As we’ve seen before, the human capacity for innovation and adaptation usually outruns the machines.
Wade W. Slome, CFA, CFP®
Plan. Invest. Prosper.
This article is an excerpt from a previously released Sidoxia Capital Management complimentary newsletter (Mar. 2, 2026). Subscribe Here to view all monthly articles.
DISCLOSURE: Sidoxia Capital Management (SCM) and some of its clients hold positions in AMZN, GOOGL, META, MSFT, NVDA, certain exchange traded funds (ETFs), but at the time of publishing had no direct position in IBM, XYZ or any other security referenced in this article. No information accessed through the Investing Caffeine (IC) website constitutes investment, financial, legal, tax or other advice nor is to be relied on in making an investment or other decision. Please read disclosure language on IC Contact page.
Scary Headlines Abound as Dow Knocks on 50-Thou…What Now?

The Dow Jones Industrial Average first crossed the 40,000 milestone in mid-2024 (see Investing Caffeine – Dow 40,000), yet barely 18 months later, the index has notched another record closing high and is now knocking on the door of 50,000.
For the most recent month:
Dow Jones: +1.7%
S&P 500: +1.4%
NASDAQ: +1.0%
Remarkably, as we enter 2026 flirting with these major milestones, this marks the third consecutive year of double-digit gains across the major stock indices—despite what feels like a nonstop barrage of alarming and often unimaginable headlines.
And that’s the key point.
A World on Fire… According to the Headlines
• Greenland Takeover Threat: Over a year ago, President Trump declared U.S. control of Greenland an “absolute necessity” for national security amid rising Russian and Chinese Arctic influence. Last month, tensions escalated when a proposed tariff regime—starting at 10% and rising to 25%—was announced against Denmark and several European allies. Markets ultimately breathed a sigh of relief after tariffs and military threats were reversed following the announcement of a negotiated framework.
• Venezuelan Invasion: In early January, U.S. forces executed a high-precision raid of the Venezuelan capital of Caracas in the middle of the night, when President Nicolas Maduro was successfully extracted without any Americans killed. Maduro now faces narcoterrorism and corruption charges in federal court in Brooklyn. Meanwhile, Secretary of State Marco Rubio has spearheaded a plan that prioritizes the rebuilding of Venezuela’s oil infrastructure by seizing tankers and millions of barrels of sanctioned crude oil to finance the reconstruction.
• ICE Protests in Minnesota Turn Deadly: Immigration protests in Minnesota escalated last month, resulting in two high-profile fatalities as demonstrators clashed with federal ICE authorities (Immigration and Customs Enforcement).
• Government Shutdown (Again): A partial government shutdown began January 31, 2026, after six of twelve appropriations bills expired. Political gridlock—particularly surrounding DHS (Department of Homeland Security) and ICE funding—has once again sidelined Washington as lawmakers attempt to negotiate a resolution. House members gather back from recess on February 2nd in an attempt to end the budget standoff.
• Federal Reserve Leadership Uncertainty: Fed Chair Jerome Powell’s term expires in May. President Trump has nominated Kevin Warsh as his successor, criticizing “Too Late” Powell’s pace of rate cuts for years. Warsh, a former Fed Governor during the 2008 Financial Crisis, is widely respected but faces scrutiny regarding Fed independence, in part because he shares the President’s view that interest rates should be lower in the current environment. His Senate confirmation remains pending.
• Middle East Tensions in Iran: Following last year’s U.S. strikes on Iranian nuclear facilities, tensions have reignited amid reports of mass protester killings by Iran’s IRGC (Islamic Revolutionary Guard Corps). The U.S. has since mobilized substantial regional military assets, signaling possible intervention in support of regime change.
• Supreme Court Tariff Ruling Looms: The Supreme Court has yet to rule on the administration’s use of the International Emergency Economic Powers Act (IEEPA) of 1977 to impose sweeping global tariffs. A ruling against the government could trigger over $100 billion in retroactive refunds. The next decision window is February 20, 2026.
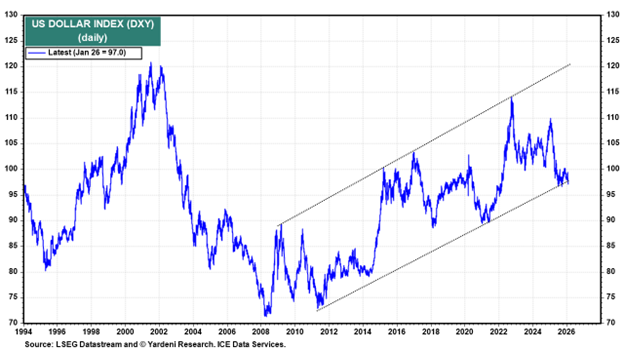
• U.S. Dollar Weakness: After declining roughly 10% in 2025, the dollar continued to weaken in January 2026 (-1%) – see chart below. Precious metals surged alongside the move—gold up +12% and silver +17% for the month—despite sharp end-of-month pullbacks.
• Cryptocurrency Collapse: Bitcoin has fallen roughly -38% from its October 2025 peak near $126,000 to about $78,000, once again challenging its “digital gold” and “store-of-value” narrative.
• Ongoing Ukraine War and Gaza Conflict: The Russia-Ukraine conflict drags into its fifth year, while violence persists in Gaza despite a loosely agreed ceasefire, with casualties continuing to rise.
Source: Yardeni Research
Don’t Believe the Hype
That’s a staggering amount of uncertainty. So how has the stock market responded?
By soaring.
S&P 500 Returns:
2023: +24.2%
2024: +23.3%
2025: +16.4%
The verdict on 2026 remains unwritten—but so far, the trend remains intact.
For most of my professional career, I’ve urged investors to tune out fear-driven media narratives (see Turn Off the TV). History repeatedly shows there is little correlation between scary headlines and long-term stock prices.
In fact, I’ve argued before that bad news can often be good news for markets (see Bad News is Good News). Conversely, in 2022 we witnessed strong employment and solid economic growth—yet both stocks and bonds suffered significant losses.
What Actually Moves Markets (“The Stool”)

Rather than reacting to noise, investors should focus on what truly drives long-term returns. At Sidoxia Capital Management, we emphasize four foundational forces (see Don’t Be a Fool, Follow the Stool):
1. Profits
2. Interest Rates
3. Sentiment
4. Valuations
These four legs of the “Sidoxia Stool” exert far more influence over market direction than daily headlines ever will.
While the current environment presents a mixed picture across these factors, monitoring them—rather than reacting emotionally to media narratives—offers investors far greater clarity on where markets may head next. And whether the Dow reaches 50,000… or 100,000 likely won’t be decided by headlines. It will be decided by fundamentals.
Wade W. Slome, CFA, CFP®
Plan. Invest. Prosper.
This article is an excerpt from a previously released Sidoxia Capital Management complimentary newsletter (Feb. 2, 2026). Subscribe Here to view all monthly articles.
DISCLOSURE: Sidoxia Capital Management (SCM) and some of its clients hold positions in certain exchange traded funds (ETFs), but at the time of publishing had no direct position in any other security referenced in this article. No information accessed through the Investing Caffeine (IC) website constitutes investment, financial, legal, tax or other advice nor is to be relied on in making an investment or other decision. Please read disclosure language on IC Contact page.
Green Lights Everywhere… But Is It Time to Tap the Brakes?

The economic and market fundamentals appear to be flashing green lights everywhere. Growth is strong, inflation has cooled, and financial conditions have eased. Yet even with clear skies and open roads, experienced drivers know conditions can change quickly. It may not be time to slam on the brakes—but it could be time to keep a foot hovering nearby.
After the Federal Reserve aggressively applied the brakes in 2022 with seven rate hikes—taking the federal funds rate from 0.25% to 4.50%—the stock market declined nearly 19%. Since rates peaked at 5.50% in 2023, the Fed has cut rates six times, lowering them by a cumulative 1.75% to approximately 3.75%. Those cuts have helped pave the way for a smoother ride, providing a meaningful tailwind to equity markets.
That said, the most recent quarter-point cut produced mixed results. Last month, the Dow Jones Industrial Average rose +0.7%, the S&P 500 was essentially flat at –0.1%, and the NASDAQ lagged with a –0.5% decline.
Navigating the Winning Streak
We have encountered a few economic speed bumps along the way—tariffs and geopolitical events earlier in 2025, for example—but once investors realized those tariffs were more bark than bite (as I discussed previously in Tariff Sheriff), stocks resumed their impressive run. The market has now delivered three consecutive years of strong returns: 2023 (+24%), 2024 (+23%), and 2025 (+16%).
With these strong gains, today’s environment can feel like cruising on a national highway—clear roads, sunny skies, cruise control engaged, and little traffic in sight. The momentum could continue. Three strong years in a row do not rule out a fourth or fifth. In fact, the late 1990s offer a powerful reminder: from 1995 through 2000, the stock market averaged approximately 29% annual returns through the March 2000 peak (see table below). However, once the technology bubble burst, it took more than 13 years for the market to reclaim new year-end highs.
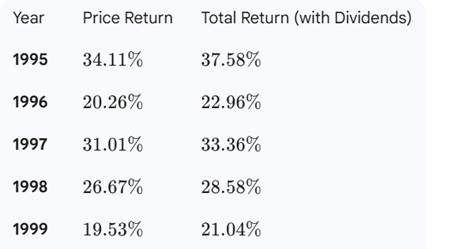
Source: Gemini
After more than three decades of investing, one lesson remains clear: trees can grow for years—but they do not grow to the sky forever. Bull markets often last longer than expected, but they eventually end.
Why the Forecast Looks Rosy
Several factors are supporting today’s strong market backdrop:
- Strong Economic Growth: Third-quarter GDP growth of 4.3% marked the fastest expansion in two years (see chart below)
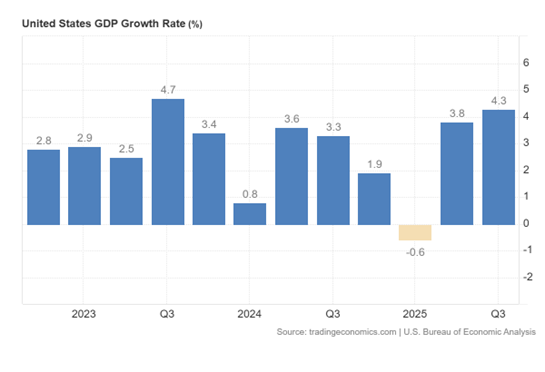
Source: Trading Economics
- AI-Driven Productivity: GDP growth has remained robust even as unemployment has risen from 4.0% earlier in the year to approximately 4.6% today. Growth outpacing employment is the definition of productivity, and the proliferation of artificial intelligence is accelerating this trend. Large companies such as Amazon.com (AMZN), Microsoft (MSFT), Alphabet-Google (GOOGL), and Meta Platforms (META) have reduced headcount significantly by tens of thousands in recent years while revenues and profits continue to surge (see also Mag 7 Takes Cash to the Bank).
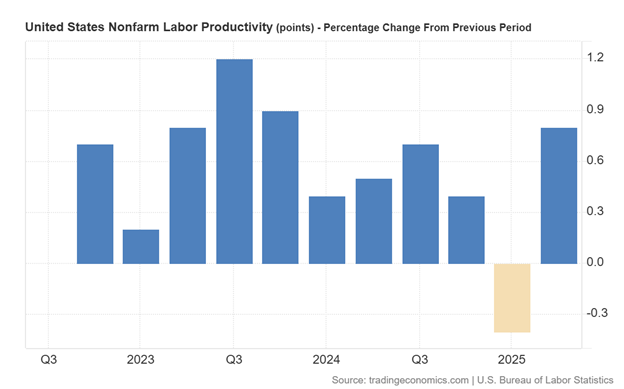
Source: Trading Economics
- Taming Inflation: Crude oil prices have fallen roughly 20% over the last year, and Owner’s Equivalent Rent (which makes up about one-third of CPI inflation) has been steadily declining—both positive signals for inflation pressures ahead (see chart below).

Source: Calafia Beach Pundit
- Lapping Tariffs: Tariffs represented a one-time price increase. As we move into 2026, their inflationary impact should diminish as those increases roll off.
- Narrowing Budget Deficit: While debt and deficits remain headline risks, federal spending has been flat over the past year while revenues have increased roughly 10%, according to Scott Grannis (see chart below).
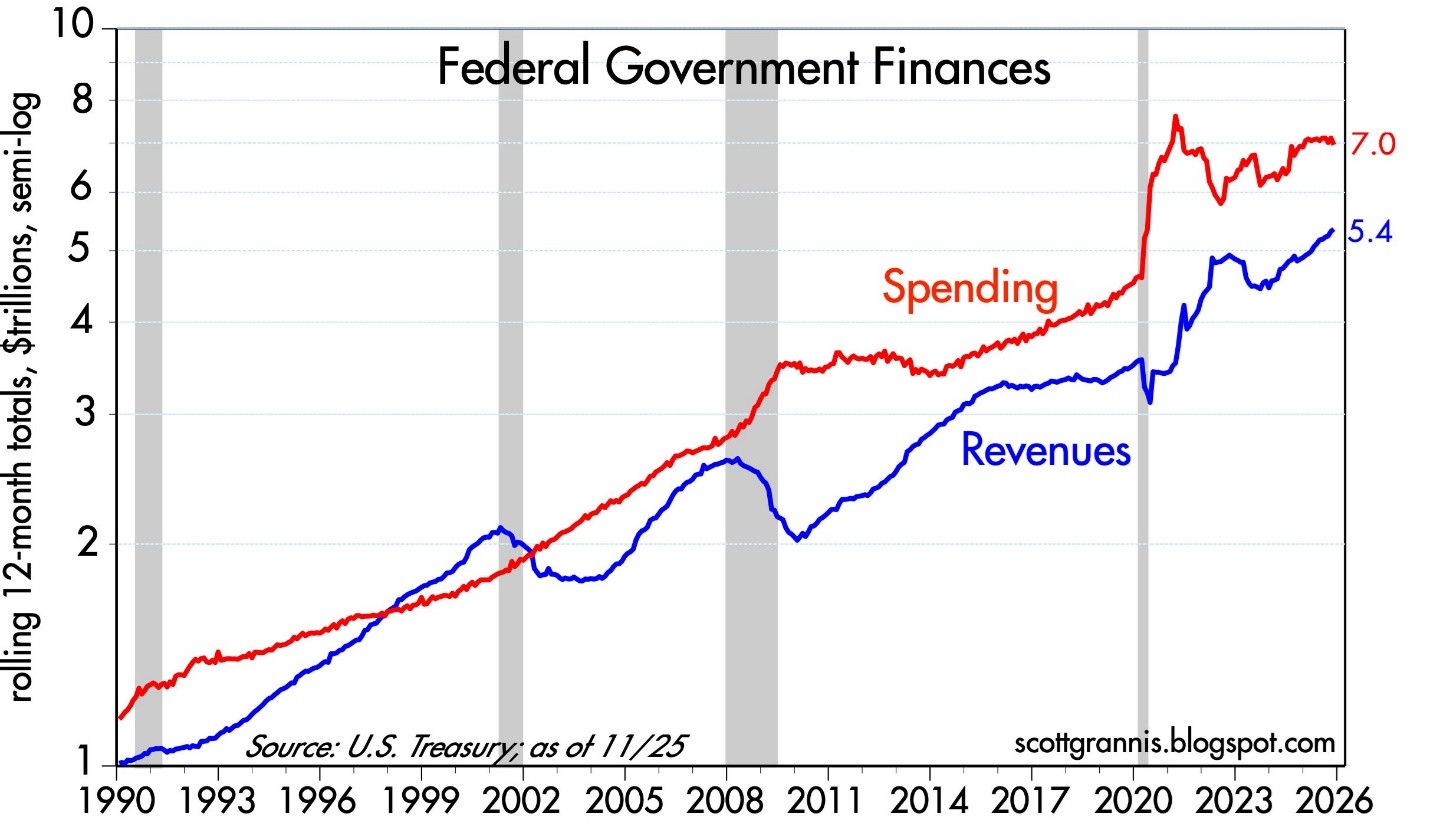
Source: Calafia Beach Pundit
- Tax Cuts & Higher Refunds Ahead: Many provisions of the One Big Beautiful Bill (OBBB) will be felt more fully in 2026, including 100% bonus depreciation for businesses, higher SALT deduction caps, increased standard deductions, no tax on tips or overtime, and a higher Child Tax Credit (CTC). Collectively, these could result in refunds up to $1,000 higher per individual.
Together, these factors could support continued market strength into 2026. But weather, road conditions, and markets can change quickly.
Reasons to Keep Your Foot Near the Brake Pedal
While the road looks smooth, several caution signs deserve attention:
- Elevated Valuations: Forward price-to-earnings ratios (P/E) are at their highest levels since the late 1990s, outside of the brief post-COVID period. (see chart below).
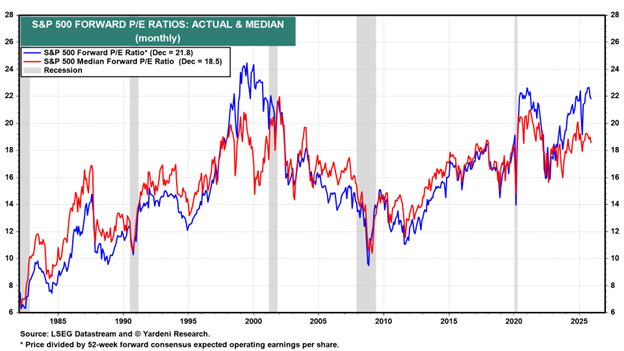
Source: Yardeni Research
- Animal Spirits Are Back: Speculation has expanded well beyond traditional markets. Prediction platforms such as Kalshi, Polymarket, FanDuel, DraftKings, Robinhood, Coinbase, and others now allow bets on everything from political outcomes to economic data—further evidence of speculative behavior.
- Gold and Silver Speculation: Despite a relatively stable U.S. dollar over the past six months, gold rose +64% and silver catapulted +145% in 2025—moves difficult to justify by fundamentals alone (see chart below).

Source: MarketSurge
- Investor Complacency: The Volatility Index (VIX), often called the “fear gauge,” currently hovers near 15, well below its long-term average of 20. Historically, true fear doesn’t surface until readings exceed 25.
- Market Concentration: The “Magnificent 7” stocks represent roughly 1% of the companies in the S&P 500 but account for about 37% of the index’s weighting (see Mag 7 Takes Cash to the Bank)—a concentration reminiscent of the late 1990s. When leadership narrows, downturns can be sharper.
The Sidoxia View
At Sidoxia Capital Management, we have implemented all-weather, time-tested strategies through decades of both bull and bear markets. We believe diversification and disciplined risk management are essential—not fruitless prediction attempts. Rather than attempting to time short-term market moves, we focus on adapting portfolios to changing conditions and navigating inevitable financial potholes.
We don’t always get it right, but over the long run, this approach has allowed us to earn and retain the trust, loyalty, and confidence of our clients.
After three years of strong performance, it’s easy to assume clear roads and blue skies will continue indefinitely. But history teaches us that the most dangerous moments often occur when confidence is highest. This is not a call to abandon the journey—only a reminder to stay alert. When markets accelerate this quickly, discipline, diversification, and risk management matter more than ever.
Wade W. Slome, CFA, CFP®
Plan. Invest. Prosper.
This article is an excerpt from a previously released Sidoxia Capital Management complimentary newsletter (Jan. 2, 2026). Subscribe Here to view all monthly articles.
DISCLOSURE: Sidoxia Capital Management (SCM) and some of its clients hold positions in MSFT, GOOGL, AMZN, META, and certain exchange traded funds (ETFs), but at the time of publishing had no direct position in ORCL or any other security referenced in this article. No information accessed through the Investing Caffeine (IC) website constitutes investment, financial, legal, tax or other advice nor is to be relied on in making an investment or other decision. Please read disclosure language on IC Contact page.
As We Give Thanks, AI and Mag 7 Take Cash to the Bank

Market volatility resurfaced last month as speculation intensified over whether an AI bubble may be forming—and potentially bursting. Yet despite the jitters, equity markets remain solidly positive for the year (S&P 500 +16.5%, NASDAQ +21.0%, Dow +12.2%) – see S&P 500 chart below. A significant portion of the gains have been powered in large part by ongoing strength in the Magnificent 7. Standouts such as NVIDIA (+31.8%) and Alphabet (+68.1%) have been instrumental in carrying the broader indices higher.

Even with these sizable year-to-date gains, memories of the 2000 Tech Bubble and 2008 Financial Crisis resurfaced and prompted investors to temporarily tap the brakes. Mid-month, the NASDAQ retreated roughly -9% from its October peak. After a month-end bounce, the S&P 500 finished essentially flat (+0.1%), the NASDAQ slipped -1.5%, and the Dow eked out a +0.3% increase.
OpenAI and the $1.4 Trillion Question
At the center of the AI controversy sits OpenAI, parent of the three-year-old technology toddler, ChatGPT (Generative Pre-trained Transformer), which now boasts more than 800 million global users (see chart below). The company reportedly runs at a $20 billion annual revenue pace, yet faces difficult questions about how it intends to fund its staggering $1.4 trillion AI infrastructure commitments.
Those concerns came to a head when tech investor Brad Gerstner pressed CEO Sam Altman on his podcast last month. Instead of answering how OpenAI plans to underwrite such an enormous buildout, Altman childishly shot back defensively:
“If you want to sell your shares, I’ll find you a buyer.” (See clip here — or full interview here)

Source: Digital Information World
OpenAI is a key player, but just one component in the vast—and rapidly expanding—web of global AI infrastructure. Gartner, a global research and advisory firm, forecasts $2 trillion of AI investment in 2026, while NVIDIA CEO Jensen Huang recently said:
“Over the next five years, we’re going to scale into… effectively a $3 to $4 trillion AI infrastructure opportunity.”
These provocative “Is this a bubble?” questions make for great headlines, but to truly evaluate AI sustainability, it’s wise to follow the classic Watergate guidance from of All the President’s Men character, Deep Throat (FBI Associate Director, Mark Felt), who tells journalist Bob Woodward to “follow the money,” if he wants to get to the bottom of the Watergate scandal.
The same principle applies to investors who follow the money – the picture looks very different from past bubbles.
Forget Pets.com—Today’s AI Buildout Is Being Funded by Cash-Rich Titans
Unlike the flimsy, profitless internet startups of the late 1990s—companies that raised billions based on “eyeballs” and cocktail-napkin business plans—the current AI buildout is being financed largely by profitable cash-generating giants.
Yes, some firms like Oracle (ORCL) are leaning on debt financing for data-center expansion. But the overwhelming majority of AI capex is being funded by customers and by the cash flow of the Magnificent 7, a group with the financial firepower to sustain multi-year spending without relying heavily on capital markets.
This dynamic alone separates today’s environment from classic bubble conditions.
Do the Magnificent 7 Really Deserve a $22 Trillion Valuation?
The Mag 7 represent only 1% of S&P 500 constituents yet account for a massive 35% of the index’s market value. That concentration understandably raises eyebrows, evoking historical parallels to the “Nifty Fifty” of the 1970s or the “Four Horsemen” of the 1990s.
But headline concentration can be misleading—because the fundamentals tell a very different story. Here are some of the major disparities:
1.) Mag 7 Share of Profits Matches Their Share of Market Value: The Mag 7 collectively contribute $22 trillion of the S&P 500’s $58 trillion total value (below). Said differently, the market values and weightings of the Mag 7 equate to about $22 trillion and 37% of the S&P 500, respectively:
· Nvidia Corp: $4.3T & 7.0%
· Apple Inc.: $4.1 T & 6.7%
· Alphabet Inc.: $3.9 T & 6.3%
· Microsoft Corp.: $3.7 T & 5.9%
· Amazon.com Inc.: $2.5 T & 4.0%
· Meta Platforms Inc.: $1.6T & 2.6%
· Tesla Inc.: $1.4T & 2.3%
· TOTAL: $22T / 37%
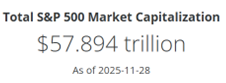
Source: Slickcharts
Conveniently (and importantly), the Mag 7’s roughly $747 billion in annual cash flow (see table below) is a good proxy for their profit contribution to the $2 trillion in S&P profits.
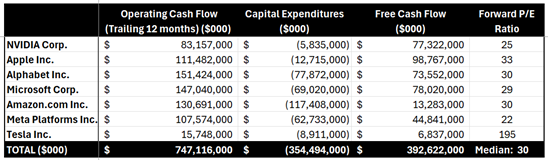
Source: SEC Filings & MarketSurge
The $747 billion in Mag 7 cash flows divided by the $2 trillion in S&P 500 coincidentally also equates to 37% ($747B/$2T).
These calculations of the Mag 7 are not bubble math—these calculation comparisons are rational math. Arguments could be made that Mag 7 market values are actually undervalued (not in bubble territory) and should appreciate to a higher percentage of the S&P 500 weightings because these 7 stocks are growing sales and profits faster than compared to the other “absentee” 493 stocks in the index.
2.) Mag 7 are Swimming in Cash: That $747 billion in annual cash flow is on track to hit a jaw-dropping $1 trillion, giving these firms ample capital to fund AI buildouts without substantially accessing the equity or credit markets. The ability to self-fund a multi-trillion-dollar infrastructure expansion is the opposite of bubble behavior.
3.) Valuations Are Elevated—but Far from Bubble Territory: During the 2000 Tech Bubble, many leading tech names traded at 100x+ earnings (See also: Rational or Irrational Exuberance. Today, the Mag 7 trade at a median forward P/E around 30x. Expensive? Historically, yes, versus long-term averages, but nowhere near historical extremes. Relative to growth, profitability, and cash flow, valuations are far more grounded today than during prior manias.
The bottom line is there is plenty to be thankful for and bubble fears are overstated. Despite pockets of AI froth, the underlying economic engine powering AI adoption is real, profitable, and well-capitalized. When investors follow the money, they discover:
· The Mag 7 generate over one-third of S&P 500 profits
· They generate and hold hundreds of billions in cash
· They largely fund their own AI capital expenditures
· Valuations remain far below bubble-era extremes
Investors have a lot to be thankful for. And while volatility will likely continue, the ingredients for a classic, catastrophic AI bubble are noticeably absent. For disciplined, long-term investing strategies like those employed at Sidoxia Capital Management, this environment still offers abundant opportunity—without the need to fear a pricked AI balloon anytime soon.
Wade W. Slome, CFA, CFP®
Plan. Invest. Prosper.
This article is an excerpt from a previously released Sidoxia Capital Management complimentary newsletter (Dec. 1, 2025). Subscribe Here to view all monthly articles.
DISCLOSURE: Sidoxia Capital Management (SCM) and some of its clients hold positions in NVDA, AAPL, MSFT, GOOGL, AMZN, META, TSLA, and certain exchange traded funds (ETFs), but at the time of publishing had no direct position in ORCL or any other security referenced in this article. No information accessed through the Investing Caffeine (IC) website constitutes investment, financial, legal, tax or other advice nor is to be relied on in making an investment or other decision. Please read disclosure language on IC Contact page.
Trade & OBBB Deals Sealed, Fed Dread, and AI/Meme Dreams

As the stock market reached new all-time highs, investors had plenty to juggle—both in Washington, D.C., and on Wall Street. The S&P 500 climbed +2.2%, the NASDAQ surged +3.7%, and the Dow Jones Industrial Average edged higher by +0.1% for the month.
The One Big Beautiful Bill
What has fueled the rally? A major catalyst was President Trump’s signing of the One Big Beautiful Bill Act (OBBB) on July 4th. The nearly 900-page legislation spans a broad range of economic issues including tax reform, healthcare, energy policy, and national security.

According to the Congressional Budget Office (CBO), the combined impact of tax cuts, new spending, and spending reductions will result in a net cost of $3.4 trillion over 10 years (see chart above). Supporters of the bill argue that this projection underestimates the long-term stimulative effects of tax relief and strategic investments. Whether the deficit widens as the CBO projects, or narrows thanks to a stronger, growing economy, remains to be seen.
Trade Deals Sealed
Since Liberation Day on April 2nd, trade negotiations have progressed unevenly. The administration’s reciprocal tariff hikes were paused through August 1st to allow final agreements to be reached. Following months of tough rhetoric, multiple major trading partners ultimately signed deals before the deadline—including the European Union, Japan, the United Kingdom, Vietnam, and South Korea—thereby avoiding punitive tariffs.
Talks with our two key trading partners, Mexico and Canada, remain ongoing. While Mexico was granted a 90-day extension amid constructive dialogue, Trump slapped a 35% tariff on Canada (from 25%) due to what the White house said was “continued inaction and retaliation.” The tariff pause with China stops on August 12th.
Here’s a list of the new country tariffs released by the president late yesterday: CLICK HERE
Regardless of all the tariff uncertainty, investor sentiment improved last month as the terms of the signed deals were significantly milder than originally feared.
Adding to the optimism:
- Core inflation in June remained modest at 2.8% (Reuters), and
- Tariff revenues collected through July reached $126 billion, beating initial estimates (Politico) – see chart below. Strategist Ed Yardeni forecasts that 2025 tariff revenues could surge to between $400 billion and $500 billion (Barron’s).

Source: Politico
Fed Dread
Of course, when it comes to financial markets, everything can’t just be rainbows and unicorns without something for investors to worry about—and this month, a key concern remains Federal Reserve policy. Critics, including the president, argue that interest rates are too high, with the Federal Funds Rate currently set at 4.25%–4.50% (Yardeni Research) – see chart below.
By comparison:
- The European Central Bank’s Deposit Facility Rate stands at 2.00%, and
- The Bank of Japan’s overnight rate is only 0.50%.

Source: Yardeni Research
Fed Chair Jerome Powell has held off on further cuts, citing the need for more clarity on inflation and labor market data, especially in light of recent tariffs. Ironically, when the Fed last cut rates by -1.00% late last year, the 10-year Treasury yield rose by roughly +1% (see chart above), reflecting fears of rising inflation.
This week, the Fed held rates steady for the fifth consecutive meeting (YouTube). Notably, two FOMC members—Christopher Waller and Michelle Bowman—dissented, voting in favor of a rate cut. It was the first dual dissent by Fed governors in over 30 years—a clear signal of division inside the central bank.
Meme Dreams
With the major indexes at new highs, speculation has returned in full force. Money-losing, struggling companies like Opendoor Technologies, GoPro Inc., and Kohl’s Corp. saw their shares double, triple, or even quadruple over a short span (WSJ) – see chart below. We saw similar trends occur during the GameStop and AMC meme craze in 2021.

Source: The Wall Street Journal
Adding fuel to the fire:
- Cryptocurrency prices are on the rise again.
- Euphorically priced IPOs (Initial Public Offerings) like Figma, Inc. (FIG), which more than tripled in value ($115 per share) on its first trading day above its offering price ($33 per share) valuing the company above $50 billion – more than 30 times next year’s forecasted revenues.
- SPACs (Special Purpose Acquisition Companies)—often criticized for poor governance—are staging a comeback.
Combined, all these trends raise concerns about froth, which investors have experienced at previous peaks.
Climb in AI Stocks Persists
No discussion of this rally would be complete without highlighting the AI mega-cap giants. Companies like Alphabet (Google), Meta (Facebook), Microsoft, and Amazon all recently announced capital expenditures for 2025 that will likely exceed an astounding $350 billion —most of it allocated to AI infrastructure.
Meanwhile, NVIDIA Corp., the AI-chip juggernaut and major beneficiary of all the AI capex, has seen its share price soar +63% in just three months, reaching a staggering $4.4 trillion market value.

Source: Yardeni Research
Valuations High but Fundamentals Remain Strong
While stock valuations remain elevated above historical averages (the S&P 500 red line trades at 22x forward earnings, according to Yardeni) – see chart above, the macro backdrop remains supportive:
- The economy is strong,
- Unemployment is low,
- Corporate profits are growing, and
- Monetary policy may turn more accommodative in coming months.
In this momentum environment, the market should continue its productive juggling, but if the frothy or economic winds worsen, investors should be prepared for a dropped ball.
Wade W. Slome, CFA, CFP®
Plan. Invest. Prosper.
This article is an excerpt from a previously released Sidoxia Capital Management complimentary newsletter (August 1, 2025). Subscribe Here to view all monthly articles.
DISCLOSURE: Sidoxia Capital Management (SCM) and some of its clients hold positions in GOOGL, META, AMZN, MSFT, NVDA, and certain exchange traded funds (ETFs), but at the time of publishing had no direct position in OPEN, GPRO, KSS, GME, AMC, FIG or any other security referenced in this article. No information accessed through the Investing Caffeine (IC) website constitutes investment, financial, legal, tax or other advice nor is to be relied on in making an investment or other decision. Please read disclosure language on IC Contact page.
Mideast War an Investor Bore as Markets Soar

If I told you at the beginning of the year that the U.S. would bomb key nuclear sites in Iran, would you have guessed that Middle East stability would follow—and that global financial markets would soar to record highs? Personally, I wouldn’t have bet on that outcome. But that’s exactly what happened last month. While geopolitical dynamics remain fluid, markets shrugged off the chaos. The S&P 500 rallied +5.0%, the Dow Jones Industrial Average climbed +4.3%, and the NASDAQ catapulted +6.6%, powered largely by artificial intelligence stocks like NVIDIA Corp., which surged +16.9% for the month to a market value of $3.9 trillion (more on AI below). This is an important reminder that trading off of news headlines is a fool’s errand.
Economy Resilient Despite Tariffs and Geopolitical Turmoil
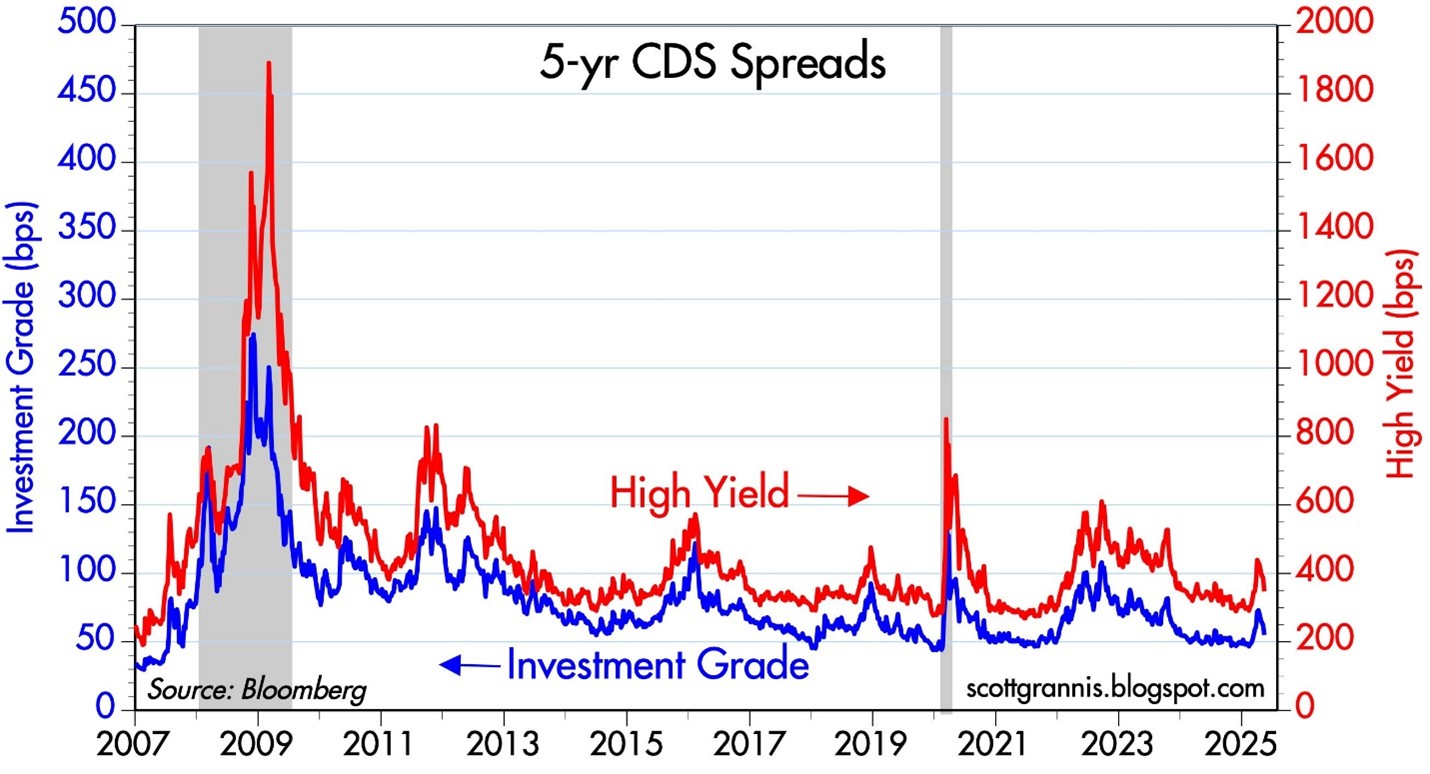
Source: Calafia Beach Pundit
Credit Default Swaps (CDS) act as insurance contracts that protect investors against corporate debt defaults. During financial stress—like the 2008 crisis or the COVID crash in 2020—CDS prices surge as investors seek protection. Today, however, CDS prices are falling across both high-yield (junk bonds) and investment-grade (Blue Chip) debt. As seen in the chart above, the cost to insure corporate bonds has declined steadily over the past two years. This signals bond investors aren’t worried about a recession or a wave of defaults, despite tariff policy uncertainty, geopolitical risk, and modest GDP growth.
Inflation Tame as Tariffs Loom
President Trump has repeatedly criticized Fed Chair Jerome Powell for not cutting interest rates, calling him everything from a “dummy” to a “major loser” and a “stupid person” to a “numbskull”. While the name-calling is colorful, the economic pressure is real: U.S. GDP contracted -0.5% in Q1 2025. Powell, however, wants to see the full impact of upcoming tariffs before making a move. . A new tariff deadline looms on July 9th, and the market is anxiously awaiting clarity. But even if tariffs are implemented, many economists believe the inflationary impact will be temporary—what’s known as a one-time price shock.
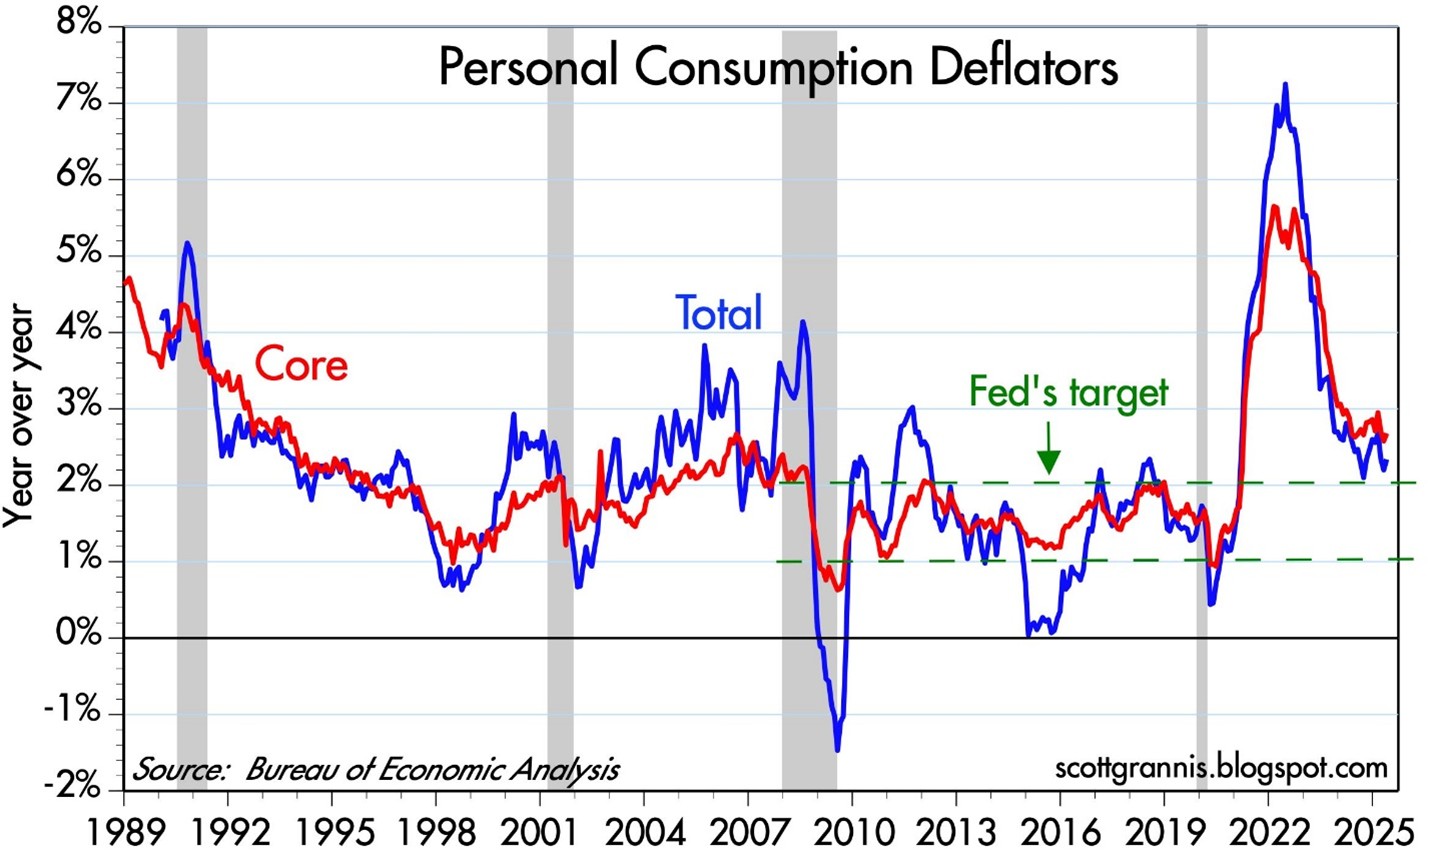
Source: Calafia Beach Pundit
The Fed’s preferred inflation gauge—the Personal Consumption Expenditure (PCE) index—has been easing and is now near the 2% target (see chart above). With inflation cooling, Trump’s case for rate cuts gains credibility. Still, the Fed appears in no rush. It will take time to understand the lasting effects of the tariff rollout.
AI Wave Fueling Markets
For a generation, the semiconductor revolution has quietly powered innovation, guided by Moore’s Law—the principle that chip performance doubles roughly every two years (see my article The Traitorous 8). Sixty years after Gordon Moore wrote his seminal article, “Cramming More Components onto Integrated Circuits”, the power of software is catching up. NVIDIA’s Grace Blackwell GB200 chip contains an astronomical 208 billion transistors, supercharging AI software models like ChatGPT.
The AI revolution is fueling trillions in global investment and rapidly transforming industries – from data centers and self-driving cars to robotics and drug discovery. It’s important to realize that this AI arms race is not just occurring in the United States. AI investment spending extends way beyond Silicon Valley to countries like Saudi Arabia, Singapore, and China.
The AI boom is not a U.S.-only phenomenon. Countries like China, Saudi Arabia, and Singapore are pouring capital into AI, creating a global arms race in tech. In the U.S., the four biggest hyperscalers—Amazon, Microsoft, Google, and Meta—are projected to spend over $300 billion on capital expenditures in 2025 alone (see chart below).
To illustrate the scale: Amazon is forecasted to spend more than $100 billion in CapEx this year. For context, that’s 40% more than the company spent over the entire 2000–2020 period combined.
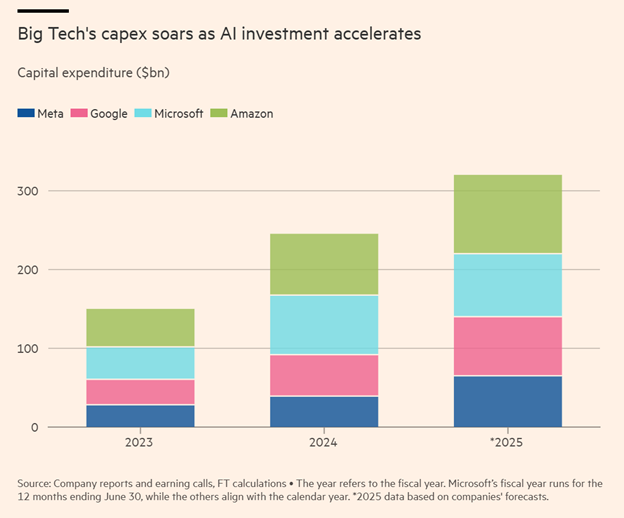
Source: The Financial Times
The Stargate Initiative: AI Infrastructure on a Galactic Scale
A prime example of the AI gold rush is the $500 billion Stargate initiative, with Phase 1 already underway in Abilene, Texas (see rendering below). The initial construction includes two buildings totaling 1,000,000 square feet. Ultimately, the full project will cove about 1,000 acres and be powered by an on-site natural gas facility generating 360 megawatts—enough to support 300,000 homes.
A huge portion of the project costs are dedicated to the budget for NVIDIA super chips. Oracle Corp. has committed $40 billion to purchase 400,000 of NVIDIA’s GB200 chips, making this project a centerpiece of the global AI infrastructure boom. Just this week, Oracle also announced a new $30 billion cloud deal, which will soak up a good chunk of the data center supply created by the database and enterprise software company.
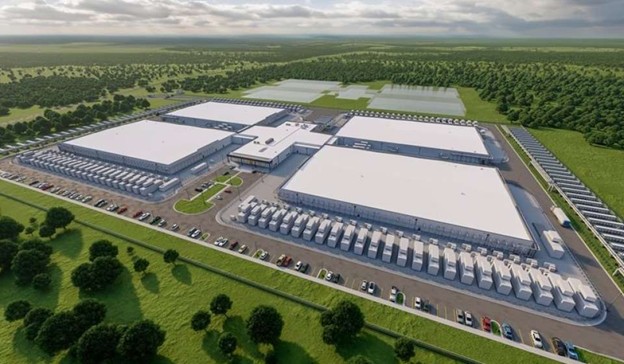
Source: CoStar
The Big Picture: Volatility and Opportunity
There’s no shortage of risk—geopolitics, inflation, Fed uncertainty, tariffs. But the economy is showing surprising resilience. If tariff clarity improves, interest rate cuts materialize, and AI capital spending accelerates, a “boring” market could rapidly turn into a soaring one.
Wade W. Slome, CFA, CFP®
Plan. Invest. Prosper.
This article is an excerpt from a previously released Sidoxia Capital Management complimentary newsletter (July 1, 2025). Subscribe Here to view all monthly articles.
DISCLOSURE: Sidoxia Capital Management (SCM) and some of its clients hold positions in certain exchange traded funds (ETFs), but at the time of publishing had no direct position in any other security referenced in this article. No information accessed through the Investing Caffeine (IC) website constitutes investment, financial, legal, tax or other advice nor is to be relied on in making an investment or other decision. Please read disclosure language on the IC Contact page.
Tariffs & Free Trade by Wade

Tariffs and trade have dominated the media headlines since the beginning of the year, creating a volatile rollercoaster ride in the financial markets and broader economy. What were screams of fear just last month turned into cheers of optimism after a trade deal between the U.S. and the U.K. was announced earlier this month.
This agreement—combined with hopes for future trade deals and the absence of runaway inflation or economic collapse—sparked a rally in stock prices. The minimum 10% baseline tariff in the U.K. agreement has fueled optimism that a simplified framework might extend to other international trade pacts. For the month, the S&P 500 surged by +6.2%, the Dow Jones Industrial Average climbed +3.9%, and the tech-heavy NASDAQ soared by +9.6%.
However, tariffs and trade haven’t faded into the background. In fact, just this week, a federal court ruled that the president’s tariff policies were illegal, citing misuse of emergency powers under the International Emergency Economic Powers Act (IEEPA) of 1977. Subsequently, the same court has granted the Trump administration a reprieve pending appeal—potentially escalating the issue to the Supreme Court. Even if the ruling stands, the president has alternative avenues to impose tariffs through other legal mechanisms.
So, what is all this fuss over tariffs and trade really about? I’ve previously written extensively on the topic (“Tariff Sheriff”), but some fundamental economic concepts still get lost in the tariff chaos noise.
It’s true that many countries engage in unfair trade practices against the U.S.—including subsidies, currency manipulation, non-tariff barriers, dumping, quotas, complex permitting, and value-added taxes (VAT). However, the powerful benefits of free trade are often underappreciated or poorly explained by the pundits.
Tariffs and Free Trade 101: China & France Experiment
To illustrate, let’s reference an example drawn from an op-ed by Princeton economist Burton Malkiel, author of the legendary finance book A Random Walk Down Wall Street.
Every country enjoys a comparative advantage in producing certain goods. For example, China historically benefits from low labor costs, making it a global manufacturing hub. Meanwhile, the U.S. leads in technological innovation, and countries like Brazil leverage vast land resources to dominate agricultural exports—such as being the world’s top coffee exporter. Let’s consider a simplified example using two countries: China and France, each with 100 labor hours available, and only able to produce T-shirts and wine.

China’s Output (see graphic above) – China’s comparative advantage in making more T-shirts than bottles of wine results in the following:
- 50 hours = 50 T-shirts
- 50 hours = 10 bottles of wine
France’s Output (see graphic above) – France’s comparative advantage in making more bottles of wine than T-shirts results in the following:
- 50 hours = 50 bottles of wine
- 50 hours = 20 T-shirts
Combined Total (China + France): 70 T-shirts + 60 bottles of wine = 130 total units of goods.
Example #2: Production Plan #2 (Each country specializes in their comparative advantage)

China’s Output (T-shirt specialization):
- 100 hours = 100 T-shirts
France’s Output (Wine specialization):
- 100 hours = 100 bottles of wine
Combined Total: 100 T-shirts + 100 bottles of wine = 200 total units of goods.
But here’s the challenge: the Chinese still want wine, and the French still want T-shirts. That’s where free trade comes in – see next example (graphic below).
Example #3: Production Plan #2 + Free Trade

Through free trade, each country can specialize in what they do best and then trade for other goods wanted or needed. If China trades 50 T-shirts for 50 bottles of wine with France, both countries end up with:
- China: 50 T-shirts + 50 bottles of wine
- France: 50 bottles of wine + 50 T-shirts
This plan produces 54% more total goods than the original production plan (200 vs. 130 – Example #1), with no increase in labor hours. China gets 300% more wine, and France gets 150% more T-shirts—a clear win-win.
Today’s Tariff Reality
In 2024, the U.S. trade deficit stood at $918 billion. President Trump’s aggressive tariff strategy aims to reduce this gap by incentivizing domestic manufacturing, increasing exports, and reducing imports. The challenge is that tariffs also raise prices for consumers and disrupt the benefits of free trade.
If the administration succeeds in establishing fairer rules for a level trading field, increasing government revenue, and narrowing the trade deficit, then history will likely view President Trump’s tariff policy favorably. But if tariffs lead to higher prices, inflation, and a weaker economy, the tariff policy may be judged as a costly misstep. The stock market, voters, and time will ultimately serve as the principal judges.
Looking ahead, two key dates are on the calendar:
- July 9 marks the end of the 90-day reciprocal tariff pause. Without new trade agreements, tariffs will spike on imports from many countries — raising costs for consumers.
- July 4 is not only Independence Day, but also the target date for Senate Republicans to pass the “One Big Beautiful Bill”, which packages several of President Trump’s top priorities: tax cuts, welfare reform, energy expansion, and border security. While the bill could stimulate growth, critics warn of its potential to balloon the national deficit.
Most Americans support the idea of fairer global trade. The question is whether aggressive tariffs across the globe are the right tool to achieve that goal — and whether trading partners will agree to new deals. Regardless of the outcome, this crash course in Tariffs & Free Trade 101 underscores the enduring value of specialization and free trade, even amid today’s turbulent tariff battles.
Wade W. Slome, CFA, CFP®
Plan. Invest. Prosper.
This article is an excerpt from a previously released Sidoxia Capital Management complimentary newsletter (June 2, 2025). Subscribe Here to view all monthly articles.
DISCLOSURE: Sidoxia Capital Management (SCM) and some of its clients hold positions in certain exchange traded funds (ETFs), but at the time of publishing had no direct position in any other security referenced in this article. No information accessed through the Investing Caffeine (IC) website constitutes investment, financial, legal, tax or other advice nor is to be relied on in making an investment or other decision. Please read disclosure language on the IC Contact page.
Rollercoaster Ride

Remember Liberation Day – the day reciprocal tariffs were announced? For those of us strapped daily into the financial market seat, it has felt like an endless rollercoaster ride since that eventful day. It may not seem like it, but reciprocal tariffs were unveiled a mere four weeks ago. Initially, after the April 2nd announcement, the stock market experienced a scary free fall. Then, after President Trump proclaimed a 90-day pause on the reciprocal tariffs and walked back other tariffs with exemptions, stock prices reversed course and catapulted higher to finish the month almost flat.
More specifically, the S&P 500 index slipped -0.8%, the NASDAQ index climbed +0.9% and the Dow Jones Industrial Average fell -3.2% in April.
Although the S&P 500 was temporarily down -21% from the February peak, the index has now bounced back and is down only -5% for the year (see chart below). Worries about a recession and tariff-induced inflation have not disappeared, but corporate profits remain strong, and we will get a fresh picture of the labor market on Friday when the monthly employment figures are released. If investors obtain some tariff clarity, trade deal announcements, and/or tax-cut legislation progress, the queasy stock market rollercoaster ride could turn to smooth sailing.

Wade W. Slome, CFA, CFP®
Plan. Invest. Prosper.
This article is an excerpt from a previously released Sidoxia Capital Management complimentary newsletter (May 1, 2025). Subscribe Here to view all monthly articles.
DISCLOSURE: Sidoxia Capital Management (SCM) and some of its clients hold positions in certain exchange traded funds (ETFs), but at the time of publishing had no direct position in any other security referenced in this article. No information accessed through the Investing Caffeine (IC) website constitutes investment, financial, legal, tax or other advice nor is to be relied on in making an investment or other decision. Please read disclosure language on the IC Contact page.
Animal Spirits to Animal Hibernation

Investor mood or sentiment can change rather quickly. Immediately after the 2024 presidential elections, positive animal spirits catapulted the stock market higher due to hopes of stimulating tax cuts and deregulation legislation. However, those warm and fuzzy feelings soured last month, as investor focus shifted to on-again, off-again tariff talks, and stagflation concerns, which have converted animal spirits into gloomy feelings of hibernation.
As a result, the advancing bull market took a breather and transformed into a weary bear during March. For the month, the S&P 500 (-5.8%), NASDAQ (-8.2%), and the Dow Jones Industrial Average (-4.2%) all fell significantly in the wake of tariffs, inflation, and recession worries.
Lovely Liberation Day or Tariff Trouble?
Since the President took office in January, he has announced, reversed, and implemented tariffs across a wide range of countries and sectors, including China, Canada, Mexico, the EU, Colombia, Venezuela, steel, aluminum, oil, automobiles, digital services taxes, and more.
The day of reckoning begins on April 2nd, designated Liberation Day by the president. This is when the president and the White House officially announce global reciprocal tariffs on foreign countries in an attempt to reverse the nation’s large trade deficit (see chart below) and bring manufacturing back to the United States. For example, if Germany subsidizes BMW cars sold in the U.S. while simultaneously placing tariffs (i.e., additional taxes) on American Ford Explorers sold in Germany, the president wants to impose equivalent reciprocal tariffs on those same BMWs sold in the U.S. in an effort to level the trading playing field. On the surface, a $131 billion trade deficit sounds very significant, but when compared to a $30 trillion economy (Gross Domestic Product – GDP), this negative trade balance represents less than 0.5% of GDP – effectively a rounding error. I have previously written how tariffs represent more of a molehill than a mountain (see Tariff Sheriff), in part because consumer spending and services make up the vast majority of our country’s economic activity, whereas trade and manufacturing are relatively smaller segments.

Source: Trading Economics
Driving home the point that tariffs are more bark than bite, Senior White House trade and manufacturing counselor Peter Navarro recently stated the 2025 tariffs could add $700 billion annually to U.S. revenues, including $100 billion from the recently announced 25% auto tariffs. Many economists believe this collection estimate is too optimistic. However, even if this target is achievable, $700 billion only represents a measly 2% of overall GDP.
Tariffs = Recession or Stagflation?
With the recent stock market downdraft and growing concerns related to tariffs, some economists and pundits are raising the probability of a recession and the possibility of inflation accompanying an economic downturn (i.e., stagflation).
Economic data should clear some of the fog. Fresh employment numbers will be released this Friday, which should shine some light on the health of the economy. Irrespective of this month’s results, the most recent 4.1% unemployment rate (see chart below), though slightly higher over the last two years, does not strongly indicate a recession.

Source: Trading Economics
Other “hard” data, such as GDP, also suggest a slowing economy rather than a recession. For instance, a recent survey of 14 economists estimates the economy is growing at a paltry +0.3% rate in Q1 – 2025 versus +2.3% in Q4 – 2024. Data is continually changing, but if a looming recession were imminent, corporate earnings would likely be trending downward, not upwards, as evident in the chart below.

Source: Yardeni Research
Tariff Inflation Has Yet to Arrive
There is no doubt tariffs function as a tax hike on consumers because U.S. companies that pay the tariffs on imported goods are eventually forced to raise prices to maintain profit margins or limit margin degradation.
Nonetheless, inflation did not spike under President Trump’s first term. Even if the president’s new policies result in more aggressive tariff actions this go-around, inflation will likely remain in check due to the point mentioned earlier – imported goods represent a small percentage of overall consumer and business purchases.
Tariff implementation is just beginning, so only time will tell how pervasive inflation will become. However, what we do know now is that inflation has declined dramatically over the last couple of years and has not yet spiked (see Consumer Price Index chart below).

Source: Calafia Beach Pundit
Where Could I Be Wrong?
I have explained how some of the lagging “hard” data does not signal recession or stagflation, but what could I be missing? For starters, some of the leading “soft” data (e.g., surveys) indicate various cracks in the economic foundation are forming. Take the recent Consumer Confidence data (see chart below), which has weakened dramatically from pre-COVID and even post-COVID levels.

Source: Trading Economics
It’s not just consumers who are feeling uneasy about the economic environment; businesses are as well. Another soft data point flashing red is the NFIB Small Business Uncertainty index, which recently reported its second-highest reading in 48 years (see chart below). Even if my argument that tariffs are too small to materially impact the economy holds, if the psychological effects of tariff uncertainty paralyzes consumer and business economic activity to a standstill, then tariffs could indeed become a substantial factor.

Source: National Federation of Independent Business (NFIB)
What Comes Next After Liberation Day?
Liberation Day is unlikely to trigger an immediate and sustained V-shaped recovery in the stock market because international trading partners will be forced to announce retaliatory tariffs in response to President Trump’s reciprocal tariffs, potentially leading to additional reactionary tariffs by the U.S.
Additionally, the reciprocal tariffs announced on April 2nd will likely serve as a starting point for subsequent negotiations with trading partners. Without a comprehensive resolution, investor sentiment will likely remain somewhat unresolved and unsettled. Regardless of your views on the size and impact of tariffs, Liberation Day will at least bring some clarity and reduce the uncertainty surrounding the current murky and chaotic environment.
The multi-year bull market continued its charge after the presidential election, but investor sentiment has weakened the bull run due to tariff uncertainty. In response, the excited bull has temporarily turned into a sleepy bear. Depending on how these tariff events unfold, we will soon find out whether Liberation Day will awaken the bear to hunt for bulls or send it into deep hibernation.
Wade W. Slome, CFA, CFP®
Plan. Invest. Prosper.
This article is an excerpt from a previously released Sidoxia Capital Management complimentary newsletter (April 1, 2025). Subscribe Here to view all monthly articles.
DISCLOSURE: Sidoxia Capital Management (SCM) and some of its clients hold positions in certain exchange traded funds (ETFs), but at the time of publishing had no direct position in F or any other security referenced in this article. No information accessed through the Investing Caffeine (IC) website constitutes investment, financial, legal, tax or other advice nor is to be relied on in making an investment or other decision. Please read disclosure language on the IC Contact page.
Par for the Course

Stocks have been in a multi-year bull market, but just as investors cannot earn positive returns every month, golfers also cannot achieve a hole-in-one or birdie on every hole, either. A challenging performance is exactly what happened last month when stocks recorded a bogey on the scorecard.
More specifically, this is how far out-of-bounds the major indexes were last month:
- S&P 500: -1.4%
- Dow Jones Industrial Average -1.6%
- NASDAQ: -4.0%
Technology stocks and the Magnificent 7 stocks felt the largest brunt of the force last month as tariffs and the impact of Chinese AI (Artificial Intelligence) competition gave investors heartburn as they digested the information (see New Year, New AI ERA & New Tariff Sheriff).
Tariffs – More Molehill Than Mountain
As mentioned, a large part of last month’s volatility can be explained by the policy uncertainty surrounding the impending tariffs on China, Canada, and Mexico. Despite the absence of new tariffs being implemented, in an attempt to lock in cheaper imported goods, U.S. corporations and consumers have been stockpiling foreign goods before prices move higher due to tariffs. The 25% proposed tariffs on Canadian and Mexican goods are set to be applied as soon as March 4th. A flat 25% tariff on imported steel and aluminum products is expected to begin on March 12th – these particular tariffs are expected to have a disproportionately negative impact on the automotive industry.
Regarding other proposed reciprocal trade agreements, the White House’s analysis on tariffs for all other countries (beyond China, Canada, and Mexico) is expected to arrive on the president’s desk on April 2nd.
All these proposed changes are having an immediate economic impact whether intended or not. Not only are consumers buying more overseas products now, as they brace for higher prices, but businesses are also shifting supply chains to countries outside of China, Canada, and Mexico, in hopes of finding temporary tariff loopholes.
The bottom-line is our country’s imports have been spiking up recently, especially in the first quarter. Imports by definition subtract from America’s economic activity, so if businesses and consumers are rationally stockpiling foreign goods before prices go up from tariffs, investors should not be surprised that GDP (Gross Domestic Product) growth is set to go negative in the first quarter (-1.5%), according to the Federal Reserve Bank of Atlanta.
This short-term spike in foreign product purchases should be temporary until the tariffs are officially put in place. Subsequently, demand for relatively cheaper U.S. goods should rise because foreign goods will be pricier. In other words, buyers may begin purchasing more American-made t-shirts on Amazon because those shirts could be cheaper than the Chinese-made t-shirts after the additional tariffs commence on China.
How large are these overall tariffs? When it comes to Mexico and Canada, the size of these countries’ imports is estimated at $918 billion (see the 2023 import breakdown below for the two countries). On the surface, this sounds like a very large number, and it is. However, if you consider the size of the U.S. GDP ($29.4 trillion), these tariffs will mathematically have less than a 1% impact on the direction of our country’s economic activity.
However, if demand for American products goes up after the tariffs begin, as mentioned above, then it is perfectly logical to expect the drag from imports can be diminished or possibly completely reversed, if consumers decide to buy more American goods.

Source: Visual Capitalist
Also worth noting, as I documented last month in my Investing Caffeine blog, imports only account for 13.9% of our country’s economic activity (see New Tariff Sheriff). So, while tariffs make for great scary headlines, the reality of the numbers paints a different picture. Overall, the uncertainty surrounding the discussion of tariffs is having a much larger economic impact than the actual tariffs themselves. In other words, what we are discussing is more molehill than mountain. We saw this same movie before during the administration’s first-term when tariffs did not crater the economy into recession or create disproportionately high inflation.
War at the White House
A geopolitical soap opera played out on global television last Friday during a meeting between Ukraine’s President Volodymyr Zelensky and President Trump in the Oval Office. The meeting was designed to be a celebratory signing of a minerals deal in which the U.S. would gain access to strategically important Ukrainian rare earth metals in exchange for continued U.S. aid and military support. A signed deal would increase the probability of a peace deal between Russia and Ukraine dramatically. What actually happened was a war of words at the White House, which resulted in Zelensky getting kicked out of the White House with no signed deal.
Both sides have economic and strategic incentives to reengage in peace and mineral deal negotiations, but if the U.S.-Ukraine relationship totally crumbles, Europe and the other NATO (North Atlantic Treaty Organization) countries will need to pick up the slack in their military and economic aid to Ukraine. Regardless, increased European support is required to stave off a broader incursion by Russia and Vladimir Putin into a wider portion of Europe.
Tariffs, the Russia-Ukraine war, and AI issues may have heightened investor anxiety last month, but long-term investors understand that annual -5% and -10% corrections in the equity markets are considered par for the course. In fact, over the last 12 months, the S&P 500 index has declined -5% five times, and -10% one time, yet the stock market is still up +16% on a trailing 12-month basis (see chart below).

Source: Trading Economics
Financial markets end up in the rough plenty of the time, which often results in performance scorecard bogeys. However, long-term investors and Sidoxia Capital Management clients have won more often than not because the benefits of American capitalism have created many more birdies and pars over time.
Wade W. Slome, CFA, CFP®
Plan. Invest. Prosper.
This article is an excerpt from a previously released Sidoxia Capital Management complimentary newsletter (March 3, 2025). Subscribe Here to view all monthly articles.
DISCLOSURE: Sidoxia Capital Management (SCM) and some of its clients hold positions in META, NVDA, certain exchange traded funds (ETFs), but at the time of publishing had no direct position in BABA or any other security referenced in this article. No information accessed through the Investing Caffeine (IC) website constitutes investment, financial, legal, tax or other advice nor is to be relied on in making an investment or other decision. Please read disclosure language on the IC Contact page.


