Posts tagged ‘inflation’
Jobs and the DMV Economy

If you have ever gone to get your driver’s license at the Department of Motor Vehicles (DMV)…you may still be waiting in line? It’s a painful but often a mandatory process, and in many ways the experience feels a lot like the economic recovery we currently have been living through over the last four years. Steady progress is being made, but in general, people hardly notice the economy moving forward.
My geographic neighbor and blogger here in Orange County, California (Bill McBride – Calculated Risk) has some excellent visuals that compare our sluggish DMV economy with previous economic cycles dating back to 1948:
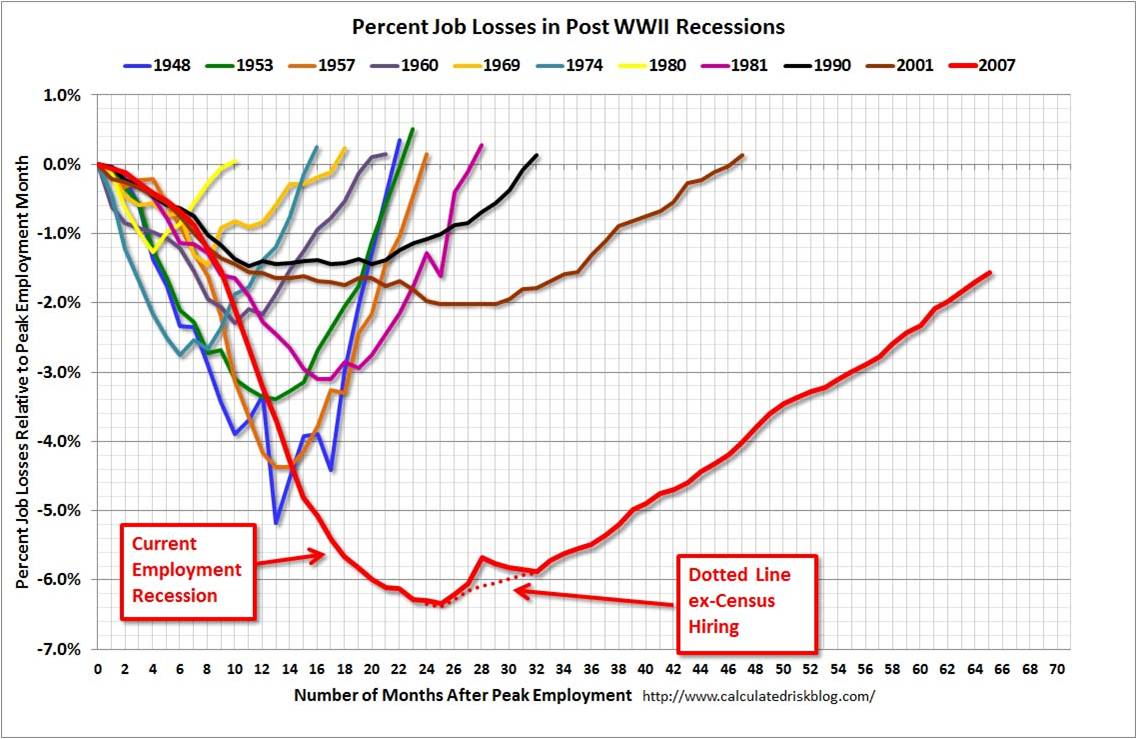
Source: Calculated Risk
As you can see from the chart above, the current economic recovery (red-line), as measured by job losses, is the slowest comeback in more than a half-century. Basically, over a two year period, the U.S. lost about nine million jobs, and during the following three years the economy regained approximately seven million of those jobs – still digging out of the hole. Last Friday’s June jobs report was welcomed, as it showed net jobs of +195,000 were added during the month, and importantly the previous two months were revised higher by another +70,000 jobs. These data points combined with last month’s Fed’s QE3 tapering comments by Ben Bernanke help explain why the continued rout in 10 year Treasury rates has continued in recent weeks, propelling the benchmark rate to 2.71% – almost double the 1.39% rate hit last year amidst continued European financial market concerns.
As with most recessions or crashes, the bursting of the bubble (i.e., damage) occurs much faster than the inflation (i.e., recovery), and McBride’s time series clearly shows this fact:

Source: Calculated Risk
While pessimists point to the anemic pace of the current recovery, the glass half-full people (myself included) appreciate that the sluggish rebound is likely to last longer than prior recoveries. There are two other key dynamics underlying the reported employment figures:
- Continued Contraction in Government Workers: Excessive government debt and deficits have led to continued job losses – state and local job losses appear to be stabilizing but federal cuts are ongoing.
- Decline in the Labor Force Participation Rate: Discouraged workers and aging Baby Boomer demographics have artificially lowered the short-term unemployment figures because fewer people are looking for work. If economic expansion accelerates, the participation contraction trend is likely to reverse.
Skepticism Reigns Supreme
Regardless of the jobs picture and multi-year expansion, investors and business managers alike remain skeptical about the sustainability of the economic recovery. Anecdotally I encounter this sentiment every day, but there are other data points that bolster my assertion. Despite the stock market more than doubling in value from the lows of 2009, CNBC viewer ratings are the weakest in about 20 years (see Value Walk) and investments in the stock market are the lowest in 15 years (see Gallup poll chart below):

Source: Gallup
Why such skepticism? Academic research in behavioral finance highlights innate flaws in human decision-making processes. For example, humans on average weigh losses twice as much as gains as economist and Nobel prizewinner Daniel Kahneman explains in his book Thinking Fast and Slow (see Investing Caffeine article: Decision Making on Freeways and in Parking Lots). Stated differently, the losses from 2008-2009 are still too fresh in the minds of Americans. Until the losses are forgotten, and/or the regret of missing gains becomes too strong, many investors and managers will fearfully remain on the sideline.
The speed of our economic recovery is as excruciatingly agonizing, and so is waiting in line at the DMV. The act of waiting can be horrific, but obtaining a driver’s license is required for driving and investing is necessary for retirement. If you don’t want to go to investing jail, then you better get in the investing line now before job growth accelerates, because you don’t want to be sent to the back of the line where you will have to wait longer.
Wade W. Slome, CFA, CFP®
Plan. Invest. Prosper.
DISCLOSURE: Sidoxia Capital Management (SCM) and some of its clients hold positions in certain exchange traded funds (ETFs), but at the time of publishing, SCM had no direct position in any other security referenced in this article. No information accessed through the Investing Caffeine (IC) website constitutes investment, financial, legal, tax or other advice nor is to be relied on in making an investment or other decision. Please read disclosure language on IC Contact page.
U.S. Small-Caps Become Global Big Dog

With the emerging market currencies and financial markets under attack; Japan’s Nikkei index collapsing in the last three weeks; and the Federal Reserve hinting about its disciplinarian tapering of $85 billion in monthly QE3 bond purchases, one would expect higher beta small cap stocks to get hammered in this type of environment.
Before benchmarking results in the U.S., let’s take a closer look at some of the international carnage occurring from this year’s index value highs:
- Japan: -19% (Nikkei 225 index)
- Brazil: -22% (IBOVESPA index)
- Hong Kong: -12% (Hang Seng index)
- Russia: -19% (MICEX/RTS indexes)
Not a pretty picture. Given this international turmoil and the approximately -60% disintegration in U.S. small-cap stock prices during the 2007-2009 financial crisis, surely these economically sensitive stocks must be getting pummeled in this environment? Well…not necessarily.
Putting the previously mentioned scary aspects aside, let’s not forget the higher taxes, Sequestration, and ObamaCare, which some are screaming will push us off a ledge into recession. Despite these headwinds, U.S. small-caps have become the top dog in global equity markets. Since the March 2009 lows, the S&P 600 SmallCap index has more than tripled in value ( about +204%, excluding dividends), handily beating the S&P 500 index, which has advanced a respectable +144% over a similar timeframe. Even during the recent micro three-week pullback/digestion phase, small cap stocks have retreated -2.8% from all-time record highs (S&P 600 index). Presumably higher dividend, stable, globally-diversified, large-cap stocks would hold up better than their miniature small-cap brethren, but that simply has not been the case. The S&P 500 index has underperformed the S&P 600 by about -80 basis points during this limited period.
How can this be the case when currencies and markets around the world are under assault? Attempting to explain short-term moves in any market environment is a hazardous endeavor, but that has never slowed me down in trying. I believe these are some of the contributing factors:
1) No Recession. There is no imminent recession coming to the U.S. As the saying goes, we hear about 10 separate recessions before actually experiencing an actual recession. The employment picture continues to slowly improve, and the housing market is providing a slight tailwind to offset some the previously mentioned negatives. If you want to fill that half-full glass higher, you could even read the small-cap price action as a leading indicator for a pending acceleration in a U.S. cyclical recovery.
2) Less International. The United States is a better house in a shaky global neighborhood (see previous Investing Caffeine article), and although small cap companies are expanding abroad, their exposure to international markets is less than their large-cap relatives. Global investors are looking for a haven, and U.S. small cap companies are providing that service now.
3) Inflation Fears. Anxiety over inflation never seems to die, and with the recent +60 basis point rise in 10-year Treasury yields, these fears appear to have only intensified. Small-cap stocks cycle in and out of favor just like any other investment category, so if you dig into your memory banks, or pull out a history book, you will realize that small-cap stocks significantly outperformed large-caps during the inflationary period of the 1970s – while the major indexes effectively went nowhere over that decade. Small-cap outperformance may simply be a function of investors getting in front of this potential inflationary trend.
Following the major indexes like the Dow Jones Industrials index and reading the lead news headlines are entertaining activities. However, if you want to become a big dog in the investing world and not get dog-piled upon, then digging into the underlying trends and market leadership dynamics of the market indexes is an important exercise.
Wade W. Slome, CFA, CFP®
Plan. Invest. Prosper.
DISCLOSURE: Sidoxia Capital Management (SCM) and some of its clients hold positions in certain exchange traded funds (ETFs) including emerging market ETFs, IJR, and EWZ, but at the time of publishing, SCM had no direct position in Hong Kong ETFs, Japanese ETFs, Russian ETFs, or any other security referenced in this article. No information accessed through the Investing Caffeine (IC) website constitutes investment, financial, legal, tax or other advice nor is to be relied on in making an investment or other decision. Please read disclosure language on IC Contact page.
Helicopter Ben to QE3 Rescue

Faster than a speedy credit default swap, more powerful than a federal funds interest rate cut, and able to leap a tall Mario Draghi in a single bound, look…it’s Helicopter Ben! How did Federal Reserve Chairman Ben Bernanke become a monetary superhero with such a cool nickname as Helicopter Ben (a.k.a. “HB”)? Bernanke, a former Princeton University professor, has widely been known to be a diligent student of the Great Depression, and his aviation nickname stems from a 2002 speech in which he referenced dropping money from a helicopter to combat deflation. While investors may worry about HB’s ability to fight the inflation thugs, there should be no questions about his willingness to implement accommodative, deflation-fighting monetary policies.
Chairman Bernanke may not epitomize your ideal superhero, however this slightly past middle-aged bearded and balding man has helped mastermind some of the most creative and aggressive monetary rescue efforts our country and globe has seen in the history of man (and woman). This week’s money-printing QE3 announcement solidified Bernanke’s historic capital saturating ranking.
Since Helicopter Ben’s heroic appointment as Federal Reserve Chairman in 2006 by George W. Bush, Bernanke has instituted numerous monetary gadgets in hopes of meeting the Federal Reserve’s dual mandate, which is i) to achieve low inflation and ii) to strive for maximum employment. Arguably, given the anemic growth here in the U.S.; the recession in Europe; and slowing growth in the emerging markets (i.e., China, Brazil, India, etc.), slack in the economy and static labor wages have largely kept inflation in check. With the first part of the dual mandate met, Bernanke has had no problem putting his monetary superpowers to work.
As referenced earlier, Bernanke’s bazooka launch of QE3, an open ended MBS (Mortgage Back Securities) bond binging program, will add $40 billion of newly purchased assets to the Fed’s balance sheet on a monthly basis until the labor market improves “substantially” (whatever that means). What’s more, in addition to the indefinite QE3, Bernanke has promised to keep the federal funds rate near zero “at least through mid-2015,” even for a “considerable time after the economic recovery strengthens.”
HB’s Track Record
Throughout superhero history, Superman, Spider-man, and Batman have used a wide-array of superhuman powers, extraordinary gadgets, and superior intellect to conquer evil-doers and injustices across the globe. Bernanke has also forcefully put his unrivaled money-printing talents to work in an attempt to cure the financial ills of the world. Here’s a quick multi-year overview of how Bernanke has put his unique talents to print trillions of dollars and keep interest rates suppressed:
Rate Cuts (September 2007 – December 2008): Before “quantitative easing” was a part of our common vernacular, the Fed relied on more traditional monetary policies, such as federal funds rate targeting, conducted through purchases and sales of open market securities. Few investors recall, but before HB’s fed funds rate cut rampage of 10 consecutive reductions in 2007 and 2008 (the fed funds rate went from 5.25% to effectively 0%), Bernanke actually increased rates three times in 2006.
Crisis Actions (2007 – 2009): Love him or hate him, Bernanke has been a brave and busy soul in dealing with the massive proportions of the global financial crisis. If you don’t believe me, just check out the Financial Crisis Timeline listed at the St. Louis Federal Reserve. Many investors don’t remember, but Bernanke helped orchestrate some of the largest and most unprecedented corporate actions in our history, including the $30 billion loan to JPMorgan Chase (JPM) in the Bear Stearns takeover; the $182 billion bailout of AIG; the conversion of Morgan Stanley (MS) and Goldman Sachs Group Inc. (GS) into bank holding companies; and the loan/asset-purchase support to Fannie Mae (FNMA) and Freddie Mac (FMCC). These actions represented just the tip of the iceberg, if you also consider the deluge of liquidity actions taken by the Fed Chairman.
HB Creates Acronym Soup
In order to provide a flavor of the vastness in emergency programs launched since the crisis, here is an alphabet soup of program acronyms into which the Fed poured hundreds of billions of dollars:
- Term Asset-Backed Securities Loan Facility (TALF)
- Term Auction Facility (TAF)
- Money Market Investor Funding Facility (MMIFF)
- Commercial Paper Funding Facility (CPFF)
- Primary Dealer Credit Facility (PDCF)
- Asset-Backed Commercial Paper Money Market Fund Liquidity Facility (AMLF)
- Temporary Reciprocal Currency Arrangements (Swap lines)
- Term Securities Lending Facility (TSLF)
Plenty of acronyms to go around, but these juicy programs have garnered most of investors’ attention:
QE1 (November 2008 – March 2010): In hopes of lowering interest rates for borrowers and stimulating the economy, HB spearheaded the Fed’s multi-step, $1 trillion+ buying program of MBS (mortgage backed securities) and Treasuries.
QE2 (November 2010 – June 2011): Since the Fed felt QE1 didn’t pack enough monetary punch to keep the economy growing at a fast enough clip, the FOMC (Federal Open Market committee) announced its decision to expand its holdings of securities in November 2010. The Committee maintained its existing policy of reinvesting principal payments from its securities holdings and to also purchase a further $600 billion of longer-term Treasury securities by the end of the second quarter of 2011 (an equivalent pace of about $75 billion per month).
Operation Twist (September 2011 – December 2012): What started out as a $400 billion short-term debt for longer-term debt swap program in September 2011, expanded to a $667 billion program in June 2012. With short-term rates excessively low, Bernanke came up with this Operation Twist scheme previously used in the early 1960s. Designed to flatten the yield curve (bring down long-term interest rates) to stimulate economic activity, Bernanke thought this program was worth another go-around. Unlike quantitative easing, Operation Twist does not expand the Fed’s balance sheet – the program merely swaps short-term securities for long-term securities. Currently, the program is forecasted to conclude at the end of this year.
The Verdict on HB
So what’s my verdict on the continuous number of unprecedented actions that Helicopter Ben and the Fed have taken? Well for starters, I have to give Mr. Bernanke an “A-” on his overall handling of the financial crisis. Had his extreme actions not been taken, the pain and agony experienced by all would likely be significantly worse, and the financial hole a lot deeper.
With that said, am I happy about the announcement of QE3 and the explosion in the Fed’s money printing activities? The short answer is “NO”. It’s difficult to support a program with questionable short-run interest rate benefits, when the menacing inflationary pressures are likely to outweigh the advantages. The larger problem in my mind is the massive fiscal problem we are experiencing (over $16 trillion in debt and endless trillion dollar deficits). More importantly, this bloated fiscal position is creating an overarching, nagging crisis of confidence. A resolution to the so-called “fiscal cliff,” or the automated $600 billion in tax increases and spending cuts, is likely to have a more positive impact on confidence than a 0.05% – 0.25% reduction in mortgage rates from QE3. Once adequate and sustained growth returns, and inflation rears its ugly head, how quickly Helicopter Ben tightens policy will be his key test.
Until then, Bernanke will probably continue flying around while gloating in his QE3 cape, hoping his quantitative easing program will raise general confidence. Unfortunately, his more recent monetary policies appear to be creating diminishing returns. Even before QE3’s implementation, Helicopter Ben has witnessed his policies expand the Fed’s balance sheet from less than $900 billion at the beginning of the recession to almost $3 trillion today. Despite these gargantuan efforts, growth and confidence have been crawling forward at only a modest pace.
No matter the outcome of QE3, as long as Ben Bernanke remains Federal Reserve Chairman, and growth remains sluggish, you can stay confident this financial man of steel will continue dumping money into the system from his helicopter. If Bernanke wants to create a true legendary superhero ending to this story, the kryptonite-like effects of inflation need to be avoided. This means, less money-printing and more convincing of Congress to take action on our out-of-control debt and deficits. Now, that’s a comic book I’d pay to read.
Wade W. Slome, CFA, CFP®
Plan. Invest. Prosper.
DISCLOSURE: Sidoxia Capital Management (SCM) and some of its clients hold positions in certain exchange traded funds (ETFs), but at the time of publishing SCM had no direct positions in JPM, AIG, MS, GS, FNMA, FMCC, or any other security referenced in this article. No information accessed through the Investing Caffeine (IC) website constitutes investment, financial, legal, tax or other advice nor is to be relied on in making an investment or other decision. Please read disclosure language on IC Contact page.
Equity Quicksand or Bond Cliff?

The markets are rigged, the Knight Capital Group (KCG) robots are going wild, and the cheating bankers are manipulating Libor. I guess you might as well pack it in…right? Well, maybe not. While mayhem continues, equity markets stubbornly grind higher. As we stand here today, the S&P 500 is up approximately +12% in 2012 and the NASDAQ market index has gained about +16%? Not bad when you consider 15 countries are offering negative yields on their bonds…that’s right, investors are paying to lose money by holding pieces of paper until maturity. As crazy as buying technology companies in the late 1990s for 100x’s or 200x’s earnings sounds today, just think how absurd negative yields will sound a decade from now? For heaven’s sake, buying a gun and stuffing money under the mattress is a cheaper savings proposition.
Priced In, Or Not Priced In, That is the Question?
So how can stocks be up in double digit percentage terms when we face an uncertain U.S. presidential election, a fiscal cliff, unsustainable borrowing costs in Spain, and S&P 500 earnings forecasts that are sinking like a buried hiker in quicksand (see chart below)?
I guess the answer to this question really depends on whether you believe all the negative news announced thus far is already priced into the stock market’s below average price-earnings (P/E) ratio of about 12x’s 2013 earnings. Or as investor Bill Miller so aptly puts it, “The question is not whether there are problems. There are always problems. The question is whether those problems are already fully discounted or not.”

Source: Crossing Wall Street
While investors skeptically debate how much bad news is already priced into stock prices, as evidenced by Bill Gross’s provocative “The Cult of Equity is Dying” article, you hear a lot less about the nosebleed prices of bonds. It’s fairly evident, at least to me, that we are quickly approaching the bond cliff. Is it possible that we can be entering a multi-decade, near-zero, Japan-like scenario? Sure, it’s possible, and I can’t refute the possibility of this extreme bear argument. However with global printing presses and monetary stimulus programs moving full steam ahead, I find it hard to believe that inflation will not eventually rear its ugly head.
Again, if playing the odds is the name of the game, then I think equities will be a better inflation hedge than most bonds. Certainly, not all retirees and 1%-ers should go hog-wild on equities, but the bond binging over the last four years has been incredible (see bond fund flows).
While we may sink a little lower into the equity quicksand while the European financial saga continues, and trader sentiment gains complacency (Volatility Index around 15), I’ll choose this fate over the inevitable bond cliff.
Wade W. Slome, CFA, CFP®
Plan. Invest. Prosper.
DISCLOSURE: Sidoxia Capital Management (SCM) and some of its clients own certain exchange traded funds, but at the time of publishing SCM had no direct position in KCG or any other security referenced in this article. No information accessed through the Investing Caffeine (IC) website constitutes investment, financial, legal, tax or other advice nor is to be relied on in making an investment or other decision. Please read disclosure language on IC “Contact” page.
Rates Dance their Way to a Floor

The globe is awash in debt, deficits are exploding, and the Euro is about to collapse…right? Well, then why in the heck are six countries out of the G-7 seeing their 10-year sovereign debt trade at 2.5% or lower on a consistent downward long-term trajectory? What’s more, three of the six countries witnessing their rates plummet are from Europe, despite pundits continually calling for the demise of the eurozone.
Here is a snapshot of 10-year sovereign debt yields for the majority of the G-7 countries over the last few decades:

Source: TradingEconomics.com
The sole G-7 member missing from the bond yield charts above? Italy. Although Italy’s deficits are not massive (Italy actually has a smaller deficit than U.S. as % of GDP: 3.9% in 2011), its Debt/GDP ratio has been large and rising (see chart below):

Source: TradingEconomics.com
As the globe has plodded through the financial crisis of 2008-2009, investors have flocked to the perceived stability of these larger developed countries’ bonds, even if they are merely better homes in a bad neighborhood right now. PIMCO likes to call these popular sovereign bonds, “cleaner dirty shirts.” Buying sovereign debt from these less dirty shirt countries, without sensitivity to price or yield, has been a lucrative trade that has worked consistently for quite some time. Now, however, with sovereign bond yields rapidly approaching 0%, it becomes mathematically impossible to fall lower than the bottom rate floor that developed countries are standing on.
Bond bears have been wrong about the timing of the inevitable bond price reversal, myself included, but the bulls are skating on thinner and thinner ice as rates continue moving lower. The bears may prolong their bragging rights if interest rates continue downward, or persist at these lower levels for extended periods of time. Eventually the “buy the dips” mentality dies, as we so poignantly experienced in 2000 when the technology dips turned into outright collapse.
The Flies in the Bond Binging Ointment
As long as equities remain in a trading range, the “risk-off” bond binging arguments will continue holding water. If corporate earnings remain elevated and stock buybacks carry on, the pain of deflating real returns will eventually become too unbearable for investors. As the insidious rising prices of energy, healthcare, food, leisure, and general costs keep eating away everyone’s purchasing power, even the skeptics will become more impatient with the paltry returns they are currently earning. Earning negative real returns in Treasuries, CDs, money market accounts, and other conservative investments, is not going to help millions of Americans meet their future financial goals. Due to the laundry list of global economic concerns, large swaths of investors are still running and hiding, but this is not a sustainable strategy longer term. The danger from these so-called “safe,” low-yielding asset classes is actually riskier than the perceived risk, in my view.
With that said, I’ve consistently held there are a subset of investors, including a significant number of my Sidoxia Capital Management clients, who are in the later stage of retirement and have a rational need for capital preservation and income generating assets (albeit low yielding). For this investor segment, portfolio construction is not executed due to an opportunistic urge of chasing potential outsized rates of return, but more-so out of necessity. Shorter time horizons eliminate the prudence of additional equity exposure because of the extra associated volatility. Unfortunately, many of the 76 million Baby Boomers will statistically live another 20 – 30 years based on actuarial life expectations and under-save, so the risks of being too conservative can dramatically outweigh the risks of increasing equity exposure. This is all stated in the context of stocks paying a higher yield than long-term Treasuries – the first time in a generation.
Short-term risks and uncertainties remain high, with Greek election outcomes unknown; a U.S. Presidential election in flux; and an impending domestic fiscal cliff that needs to be addressed. But with interest rates accelerating towards 0% and investors’ fright-filled buying of pricey, low-yielding asset classes, many of these risks are already factored into current valuations. As it turns out, the pain of panic can be more detrimental than being stuck in over-priced assets, driven by rates dancing near an absolute floor.
Wade W. Slome, CFA, CFP®
Plan. Invest. Prosper.
DISCLOSURE: Sidoxia Capital Management (SCM) and some of its clients own certain exchange traded funds, but at the time of publishing SCM had no direct position in any other security referenced in this article. No information accessed through the Investing Caffeine (IC) website constitutes investment, financial, legal, tax or other advice nor is to be relied on in making an investment or other decision. Please read disclosure language on IC “Contact” page.
Sweating Your Way to Investment Success

Source: StopSweatyArmpits.com
There are many ways to make money in the financial markets, but if this was such an easy endeavor, then everybody would be trading while drinking umbrella drinks on their private islands. I mean with all the bright blinking lights, talking baby day traders, and software bells and whistles, how difficult could it actually be?
Unfortunately, financial markets have a way of driving grown men (and women) to tears, usually when confidence is at or near a peak. The best investors leave their emotions at the door and follow a systematic disciplined process. Investing can be a meat grinder, but the good news is one does not need to have a 90% success rate to make it lucrative. Take it from Peter Lynch, who averaged a +29% return per year while managing the Magellan Fund at Fidelity Investments from 1977-1990. “If you’re terrific in this business you’re right six times out of 10,” says Lynch.
Sweating Way to Success
If investing is so tough, then what is the recipe for investment success? As the saying goes, money management requires 10% inspiration and 90% perspiration. Or as strategist and long-time investor Don Hays notes, “You are only right on your stock purchases and sales when you are sweating.” Buying what’s working and selling what’s not, doesn’t require a lot of thinking or sweating (see Riding the Wave), just basic pattern recognition. Universally loved stocks may enjoy the inertia of upward momentum, but when the music stops for the Wall Street darlings, investors rarely can hit the escape button fast enough. Cutting corners and taking short-cuts may work in the short-run, but usually ends badly.
Real profits are made through unique insights that have not been fully discovered by market participants, or in other words, distancing oneself from the herd. Typically this means investing in reasonably priced companies with significant growth prospects, or cheap out-of-favor investments. Like dieting, this is easy to understand, but difficult to execute. Pulling the trigger on unanimously hated investments or purchasing seemingly expensive growth stocks requires a lot of blood, sweat, and tears. Eating doughnuts won’t generate the conviction necessary to justify the valuation and excess expected return for analyzed securities.
Times Have Changed
Investing in stocks is difficult enough with equity fund flows hemorrhaging out of investor accounts like the asset class is going out of style (See ICI data via The Reformed Broker). Stocks’ popularity haven’t been helped by the heightened volatility, as evidenced by the multi-year trend in the schizophrenic volatility index (VIX) – escalated by the “Flash Crash,” U.S. debt ceiling debate, and European financial crisis. Globalization, which has been accelerated by technology, has only increased correlations between domestic market and international markets. As we have recently experienced, the European tail can wag the U.S. dog for long periods of time. In decades past, concerns over economic activity in Iceland, Dubai, and Greece may not even make the back pages of The Wall Street Journal. Today, news travels at the speed of a “Tweet” for every Angela Merkel – Nicolas Sarkozy breakfast meeting or Chinese currency adjustment, and eventually results in a sprawling front page headline.
The equity investing game may be more difficult today, but investing for retirement has never been more important. Stuffing money under the mattress in Treasuries, money market accounts, CDs, or other conservative investments may feel good in the short run, but will likely not cover inflation associated with rising fuel, food, healthcare, and leisure costs. Regardless of your investment strategy, if your goal is to earn excess returns, you may want to check the moistness of your armpits – successful long-term investing requires a lot of sweat.
Wade W. Slome, CFA, CFP®
Plan. Invest. Prosper.
DISCLOSURE: Sidoxia Capital Management (SCM) and some of its clients own certain exchange traded funds, but at the time of publishing SCM had no direct position in ETFC, VXX, or any other security referenced in this article. No information accessed through the Investing Caffeine (IC) website constitutes investment, financial, legal, tax or other advice nor is to be relied on in making an investment or other decision. Please read disclosure language on IC “Contact” page.
Dominoes, Deleveraging, and Justin Bieber

Despite significant 2011 estimated corporate profit growth (+17% S&P 500) and a sharp rebound in the markets since early October (+18% since the lows), investors remain scared of their own shadows. Even with trembling trillions in cash on the sidelines, the Dow Jones Industrial Average is up +5.0% for the year (+11% in 2010), and that excludes dividends. Not too shabby, if you think about the trillions melting away to inflation in CDs, savings accounts, and cash. With capital panicking into 10-year Treasuries, hovering near record lows of 2%, it should be no surprise to anyone that fears of a Greek domino toppling Italy, the eurozone, and the global economy have sapped confidence and retarded economic growth.
Deleveraging is a painful process, and U.S. consumers and corporations have experienced this first hand since the financial crisis of 2008 gained a full head of steam. Sure, housing has not recovered, and many domestic banks continue to chew threw a slew of foreclosures and underwater loan modifications. However, our European friends are now going through the same joyful process with their banks that we went through in 2008-2009. Certainly, when it comes to the government arena, the U.S. has only just begun to scratch the deleveraging surface. Fortunately, we will get a fresh update of how we’re doing in this department, come November 23rd, when the Congressional “Super Committee” will update us on $1.2 trillion+ in expected 10-year debt reductions.
Death by Dominoes?
Is now the time to stock your cave with a survival kit, gun, and gold? I’m going to go out on a limb and say we may see some more volatility surrounding the European PIIGS debt hangover (Portugal/Italy/Ireland/Greece/Spain) before normality returns, but Greece defaulting and/or exiting the euro does not mean the world is coming to an end. At the end of the day, despite legal ambiguity, the ECB (European Central Bank) will come to the rescue and steal a page from Ben Bernanke’s quantitative easing printing press playbook (see European Deadbeat Cousin).
Greece isn’t the first country to be attacked by bond vigilantes who push borrowing costs up or the first country to suffer an economic collapse. Memories are short, but it was not too long ago that a hedge fund on ice called Iceland experienced a massive economic collapse. It wasn’t pretty – Iceland’s three largest banks suffered $100 billion in losses (vs. a $13 billion GDP); Iceland’s stock market collapsed 95%; Iceland’s currency (krona) dropped 50% in a week. The country is already on the comeback trail. Currently, unemployment (@ 6.8%) in Iceland is significantly less than the U.S. (@ 9.0%), and Iceland’s economy is expanding +2.5%, with another +2.5% growth rate forecasted by the IMF (International Monetary Fund) in 2012.
Iceland used a formula of austerity and deleveraging, similar in some fashions to Ireland, which also has seen a dramatic -15% decrease in its sovereign debt borrowing costs (see chart below).

Source: Bloomberg.com
OK, sure, Iceland and Ireland are small potatoes (no pun intended), so how realistic is comparing these small countries’ problems to the massive $2.6 trillion in Italian sovereign debt that bearish investors expect to imminently implode? If these countries aren’t credibly large enough, then why not take a peek at Japan, which was the universe’s second largest economy in 1989. Since then, this South Pacific economic behemoth has experienced an unprecedented depression that has lasted longer than two decades, and seen the value of its stock market decline by -78% (from 38,916 to 8,514). Over that same timeframe, the U.S. economy has seen its economy grow from roughly $5.5 trillion to $15.2 trillion.
There’s no question in mind, if Greece exits the euro, financial markets will fall in the short-run, but if you believe the following…
1.) The world is NOT going to end.
2.) 2012 S&P profits are NOT declining to $65.
AND/OR
3.) Justin Bieber will NOT run and overtake Mitt Romney as the leading Republican candidate
…then I believe the financial markets are poised to move in a more constructive direction. Perhaps I am a bit too Pollyannaish, but as I decide if this is truly the case, I think I’ll go play a game of dominoes.
Wade W. Slome, CFA, CFP®
Plan. Invest. Prosper.
DISCLOSURE: Sidoxia Capital Management (SCM) and some of its clients own certain exchange traded funds, but at the time of publishing SCM had no direct position in any other security referenced in this article. No information accessed through the Investing Caffeine (IC) website constitutes investment, financial, legal, tax or other advice nor is to be relied on in making an investment or other decision. Please read disclosure language on IC “Contact” page.
Mr. Market Bullying Investors

Source: Photobucket
There’s been a bully pushing investor’s around and his name is “Mr. Market.” Volatility is Mr. Market’s partner in crime, and over the last 10 trading days Mr. M has used volatility to school equity investors to the tune of 1,600+ point swings, which has contributed to equity investors’ failing grade over the last few months. Who is Mr. Market? Charles Ellis, author of Winning the Loser’s Game (1998) described him best:
“Mr. Market is a mischievous but captivating fellow who persistently teases investors with gimmicks and tricks such as surprising earnings reports, startling dividend announcements, sudden surges of inflation, inspiring presidential announcements, grim reports of commodities prices, announcements of amazing new technologies, ugly bankruptcies, and even threats of war.”
How has Mr. Market been stealing investors’ lunch money? The process really hasn’t been that difficult for him, once you consider how many times investors have been heaved into the garbage can over the last decade, forced to deal with these messy events:
• 2001 technology bubble beating
• 2006 real estate collapse
• 2008 – 2009 financial crisis and recession
• 2010 “flash crash” and soft patch
• 2011 debt ceiling debate and credit rating downgrade
With this backdrop, investors are dropping like flies due to extreme bully fatigue. Over the last four months alone, approximately $75 billion in equities been liquidated, according to data from the Investment Company Institute – this is even more money withdrawn than the outflows occurring during the peak panic months after the Lehman Brothers collapse.
The Atomic Wedgie

Exhibit I (Source: Photobucket)
Mr. Market understands the severity of these prior economic scars, which have been even more painful than atomic wedgies (reference Exhibit I above), so he opportunistically is taking advantage of fragile nerves. Introducing the following scary scenarios makes collecting lunch money from panicked investors much easier for Mr. Market. What is he using to frighten investors?
- A potential Greek sovereign debt default that will trigger a collapse of the Euro.
- Slowing growth in China due to slowing developed market economic activity.
- Possible double-dip recession in the U.S. coupled with an austerity driven downturn in Europe.
- Lack of political policy response to short and long-term economic problems in Washington and abroad.
- Impending deflation caused by decelerating global growth or likely inflation brought about by central banks’ easy monetary policies (i.e., printing money).
- End of the world.
Bully Victim Protection
Of course, not all of these events are likely to occur. As a matter of fact, there are some positive forming trends, besides just improving valuations, that provide protection to bully victims:
- Not only is the earnings yield (E/P – 12-month trailing EPS/share price) trouncing the yield on the 10-year Treasury note (~8% vs. ~2%, respectively), but the dividend yield on the S&P 500 index is also higher than the 10-year Treasury note yield (source: MarketWatch). Historically, this has been an excellent time to invest in equities with the S&P 500 index up an average of 20% in the ensuing 12 months.
- Jobs data may be poor, but it is improving relative to a few years ago as depicted here:

Source: Calafia Beach Pundit


Source: Calafia Beach Pundit
- Record low interest rates and mortgage rates provide a stimulative backdrop for businesses and consumers. Appetite for risk taking remains low, but as history teaches us, the pendulum of fear will eventually swing back towards greed.

Source: Calafia Beach Pundit
As I say in my James Carville peace from earlier this year, It’s the Earnings Stupid, long term prices of stocks follow the path of earnings. Recent equity price market declines have factored in slowing in corporate profits. How severely the European debt crisis, and austerity have (and will) spread to the U.S. and emerging markets will become apparent in the coming weeks as companies give us a fresh look at the profit outlook. So far, we have gotten a mixed bag of data. Alpha Natural Resources (ANR) acknowledged slowing coal demand in Asia and FedEx Corp. (FDX) shave its fiscal year outlook by less than 2% due to international deceleration. Other bellwethers like Oracle Corp. (ORCL) and Nike Inc. (NKE) reported strong growth and outlooks. In the short-run Mr. Market is doing everything in his power to bully investors from their money, and lack of international policy response to mitigate the European financial crisis and contagion will only sap confidence and drag 2011-2012 earnings lower.
Punching Mr. Market
The warmth of negative real returns in cash, bonds, and CDs may feel pleasant and prudent, but for many investors the lasting effects of inflation erosion will inflict more pain than the alternatives. For retirees with adequate savings, these issues are less important and focus on equities should be deemphasized. For the majority of others, long-term investors need to reject the overwhelming sense of fear.
As I frequently remind others, I have no clue about the short-term direction of the market, and Greece could be the domino that causes the end of the world. But what I do know is that history teaches us the probabilities of higher long-term equity returns are only improving. Mr. Market is currently using some pretty effective scare tactics to bully investors. For those investors with a multi-year time horizon, who are willing to punch Mr. Market in the nose, the benefits are significant. The reward of better long-term returns is preferable to an atomic wedgie or a head-flush in the toilet received from Mr. Market.
Wade W. Slome, CFA, CFP®
Plan. Invest. Prosper.
DISCLOSURE: Sidoxia Capital Management (SCM) and some of its clients own certain exchange traded funds, and FDX, but at the time of publishing SCM had no direct position in ANR, ORCL, NKE, or any other security referenced in this article. No information accessed through the Investing Caffeine (IC) website constitutes investment, financial, legal, tax or other advice nor is to be relied on in making an investment or other decision. Please read disclosure language on IC “Contact” page.
Stretching Rubber Band Creating More Value

Concerns over debt ceiling negotiations, European financial challenges, and overall economic malaise has reached a feverish pitch in the U.S., yet in the background, a valuation rubber band has quietly been stretching to ever more attractive levels. Regardless of whether seniors might not receive Social Security checks, troops not obtain ammunition, and investors not collect credit rating agency love, corporations keep churning profits out like they are going out of style (17%+ growth in 2011 estimated earnings). We have barely scratched the surface on earnings season, and I’m sure better than expected earnings from the likes of Google Inc. (GOOG), JPMorgan Chase & Co. (JPM), FedEx Corp. (FDX), Nike Inc. (NKE), and Bed Bath & Beyond Inc. (BBBY) will not sway the bears, but in the meantime profits keep chugging along. Although profits have more than doubled in the last 12 years, not to mention a halving in interest rates (10-year Treasury yield cut from 6% to about 3%), yet the S&P 500 is still down approximately -4% (June 1999 – June 2011).
What Gives?
Could the valuation stretching continue as earnings continue to grind higher? Absolutely. Just because prices have been chopped in half, doesn’t mean they can’t go lower. From 1966 – 1982 the Dow Jones Industrial index traded at around 800 and P/E multiples contracted to single digits. That rubber band eventually snapped and the index catapulted 17-fold from 800 to almost 14,000 in 25 years. Even though equities have struggled in the 21st century, a few things have changed from the low-point reached about 30 years ago. For starters, we have not hit an inflation rate of 15% or a Federal Funds rate of 20% (4% and 0% today, respectively), so we have a tad bit more headroom before the single digit P/E apocalypse descends upon us. If you listen to Peter Lynch, investor extraordinaire, his “Rule of 20” states a market equilibrium P/E ratio should equal 20 minus the inflation rate. This rule would imply an equilibrium P/E ratio of 16-17 when the current 2011 P/E multiple implies a value slightly above 13 times earnings. The bears may claim victory if the earnings denominator collapses, but if earnings, on the contrary, continue coming in better than expected, then the sun might break through the clouds in the form of significant price appreciation.
Another change that has occurred since the days of Cabbage Patch dolls has been the opening floodgates of globalization. The technology revolution has accelerated the flattening of the globe, which has created numerous new opportunities and threats. Creating a company like Facebook with about 750 million users and an estimated value of $80 billion to $100 billion couldn’t happen 30 years ago, but on the flip side, our country is also competing with billions of motivated brains lurking in the far reaches of the world with a singular focus of sucking away our jobs, resources, and dollars. Winners recognize this threat and are currently adapting. Losers blind to this trend remain busy digging their own graves.
Future is Uncertain
As famous Jedi Master Yoda aptly identified, “Always in motion is the future.” The future is always uncertain, and if it wasn’t, I would be on my private island drinking umbrella drinks all day. With undecided debt ceiling negotiations occurring over the next few weeks, political rhetoric will be blaring and traders will be hyperventilating with defibrillator paddles close at hand. If history is a guide, stupid decisions may be made, but the almighty financial markets (and maybe a few Molotov cocktails at a local protest rally) will eventually slap politicians in the face to wake up to reality. Perhaps you recall the attention the markets earned from legislators when the Dow fell 777 points in a single September 2008 trading session. Blood on the streets forced Congress to approve the Troubled Asset Relief Program hot potato four days after the initial vote failed. And if that wasn’t a gentle enough reminder for Democrats and Republicans, then a few lessons can be learned from the interest rate sledgehammer that capital markets vigilantes have slammed on the Greeks (10-year Greek yields are hovering above 17%+).
Down but Not Out
The stories of debt collapse, hyperinflation, double-dip recessions, plunging dollar, secular bear markets, and government shutdowns are all plausible but remote scenarios. As Winston Churchill so eloquently stated, “You can always count on Americans to do the right thing – after they’ve tried everything else.” Voter moods are so venomous that if fiscal irresponsibility is not changed, politicians will be voted straight out of office – even hardcore, extremist elected officials understand this self-serving point.
Suffice it to say, as the political noise reaches a deafening pitch in the coming weeks and months, a quiet rubber band in the background keeps stretching. When the political noise dies down, you may just hear a noise snapping stock prices higher.
Wade W. Slome, CFA, CFP®
Plan. Invest. Prosper.
DISCLOSURE: Performance data from Morningstar.com. Sidoxia Capital Management (SCM) and some of its clients own certain exchange traded funds, GOOG, and FDX, but at the time of publishing SCM had no direct position in JPM, NKE, BBBY, Facebook, or any other security referenced in this article. No information accessed through the Investing Caffeine (IC) website constitutes investment, financial, legal, tax or other advice nor is to be relied on in making an investment or other decision. Please read disclosure language on IC “Contact” page.
Soft Patch Creating Hard-Landing Nightmares

Boo! Was that a ghost, or was that just some soft patch talk scaring you during a nightmare? The economic data hasn’t been exactly rosy over the last month, and as a result, investors have gotten spooked and have chosen to chainsaw their equity positions. Since late April, nervous investors had already yanked more than $15 billion from U.S. equity mutual funds and shoved nearly $29 billion toward bond funds (Barron’s). Jittery emotions are evidenced by the recently released June Consumer Confidence numbers (Conference Board), which came in at a dismal 58.5 level – significantly above the low of 25.3 in 2009, but a mile away from the pre-crisis high of 111.9 in 2007.
Economic Monsters under the Bed
Why are investors having such scary dreams? Look no further than the latest terror-filled headlines du Jour referencing one (if not all) of the following issues:
• Inevitable economic collapse of Greece.
• End of QE2 (Quantitative Easing Part II) monetary stimulus program.
• Excessive state deficits, debt, and pension obligations.
• Housing market remains in shambles.
• Slowing in economic growth – lethargic +1.9% GDP growth in Q1.
• Accelerating inflation.
• Anemic auto sales in part caused by Japanese supply chain disruptions post the nuclear disaster.
Surely with all this horrible news, the equity markets must have suffered some severe bloodletting? Wait a second, my crack research team has just discovered the S&P 500 is up +5.0% this year and its sister index the Dow Jones Industrial Average is up +7.2%. How can bad news plus more bad news equal an up market?
OK, I know the sarcasm is oozing from the page, but the fact of the matter is investing based on economic headlines can be hazardous for your investment portfolio health. The flow of horrendous headlines was actually much worse over the last 24 months, yet equity markets have approximately doubled in price. On the flip-side, in 2007 there was an abundant amount of economic sunshine (excluding housing), right before the economy drove off a cliff.
Balanced Viewpoints
Being purely Pollyannaish and ignoring objective soft patch data is certainly not advisable, but with the financial crisis of 2008-2009 close behind us in the rear-view mirror, it has become apparent to me that fair and balanced analysis of the facts by TV, newspaper, radio, and blogging venues is noticeably absent.
Given the fact that the stock market is up in 2011 in the face of dreadful news, are investors just whistling as they walk past the graveyard? Or are there some positive countervailing trends hidden amidst all the gloom?
I could probably provide some credible contrarian views to the current pessimistically accepted outlook, but rather than recreating the wheel, why not choose a more efficient method and leave it to a trusted voice of Scott Grannis at the Calafia Beach Report, where he resourcefully notes the market positives:
“Corporate profits are very strong; the economy has created over 2 million private sector jobs since the recession low; swap spreads are very low; the implied volatility of equity options is only moderately elevated; the yield curve is very steep (thus ruling out any monetary policy threat to growth); commodity prices are very strong (thus ruling out any material slowdown in global demand); the US Congress is debating how much to cut spending, rather than how much to increase spending; oil prices are down one-third from their 2008 recession-provoking highs; exports are growing at strong double-digit rates; the number of people collecting unemployment insurance has dropped by 5 million since early 2010; federal revenues are growing at a 10% annual rate; households’ net worth has risen by over $9 trillion in the past two years; and the level of swap and credit spreads shows no signs of being artificially depressed (thus virtually ruling out excessive optimism or Fed-induced asset price distortions). When you put the latest concerns about the potential fallout from a Greek default (which is virtually assured and has been known and expected for months) against the backdrop of these positive and powerful fundamentals, the world doesn’t look like a very scary place.”
Wow, that doesn’t sound half bad, but rock throwing Greek vandals, nude politicians Tweeting pictures, and anti-terrorist war campaigns happen to sell more newspapers.
It’s the Earnings Stupid
Grannis’s view on corporate profits supports what I recently wrote in It’s the Earnings, Stupid. What really drives stock prices over the long-term is earnings and cash flows (with a good dash of interest rates). Given the sour stock market sentiment, little attention has been placed on the record growth in corporate profits – up +47% in 2010 on an S&P 500 operating basis and estimated +17% growth in 2011. Few people realize that corporate profits have more than doubled over the last decade (see chart below) in light of the feeble stock market performance. Despite the much improved current profit outlook, cynical bears question the validity of this year’s profit forecasts as we approach the beginning of Q2 earnings reporting season. However, if recent results from the likes of Nike Inc. (NKE), FedEx Corp (FDX), Oracle Corp. (ORCL), Caterpillar Inc. (CAT), and Bed Bath & Beyond Inc. (BBBY) are indicators of what’s to come from the rest of corporate America, then profit estimates may actually get adjusted upwards…not downwards?

Source: Scott Grannis - Calafia Report
There is plenty to worry about and there is never a shortage of scary headlines (see Back to the Future magazine covers), but reacting to news with impulsive emotional trades will produce fewer sweet dreams and more investment nightmares.
Wade W. Slome, CFA, CFP®
Plan. Invest. Prosper.
DISCLOSURE: Performance data from Morningstar.com. Sidoxia Capital Management (SCM) and some of its clients own certain exchange traded funds and FDX, but at the time of publishing SCM had no direct position in NKE, CAT, ORCL, BBY or any other security referenced in this article. No information accessed through the Investing Caffeine (IC) website constitutes investment, financial, legal, tax or other advice nor is to be relied on in making an investment or other decision. Please read disclosure language on IC “Contact” page.


