Posts tagged ‘indexes’
The Great Rotation

There are many styles of investing, and many ways to make money in the stock market. Just like the styles of men’s ties or women’s dresses come in and out of fashion, so too do the styles of investing. Some stick around for a long time, while other fads flop in short order, leading consumers to rotate into new fashions. I’m still waiting for my Bermuda shorts and pleated pants to come back in style. At this year’s Olympics, the broad array of styles has been on full display.
Growth & Tech in Style
The stock market has been on a one-way freight train riding on the coattails of large capitalization growth stocks, primarily technology stocks, especially those associated with technology and artificial intelligence (AI). You can see the dominance of the Growth style over Value in the 30-year chart below.

Source: Yardeni.com
When the blue line is sloping upwards, that means Growth stocks are outperforming Value stocks, and when sloping downwards, Value stocks are outperforming Growth Stocks. For most of the 1990s, Growth was dominant, and ever since the aftermath of the 2008 Financial Crisis, Growth stocks have once again overshadowed Value stocks a majority of the time (2022 being a short-lived reprieve for Value stocks).
This mega-Growth trend reversed last month (at least temporarily), and investors decided to rotate out of large winners into the previously shunned areas of the market, including Small Cap and Value stocks. You can see in the chart below that Small Caps (S&P 600) have underperformed Large Caps (S&P 500) over the last six years.

Source: Yardeni.com
Is this rotation sustainable? At this point, I’d say it’s too early to tell, but during periods like these, when Wall Street darlings like NVIDIA Corp (NVDA) suffer a large hit (e.g., down -17% for NVDA since the June peak), diversification benefits are pushed to the forefront. The lesson of the year 2000 technology bubble bursting taught a generation of investors that getting overly concentrated in a single sector of technology stocks can be seriously dangerous to your wealth and financial well-being. By selecting a diversity of eggs in your basket, like Value and Small Cap stocks, you can protect your nest egg when there are substantial rotations like we experienced last month. Diversification is a core tenet of our investment philosophy at Sidoxia.
In order to place the recent rotation in perspective, let’s look at how a range of indexes performed last month. The Dow Jones Industrial Average increased a hefty +4.4%, while the S&P 500 finished up modestly +1.1%. As investors rotated out of technology (-3.3% – Technology Select Sector SPDR Fund / XLK), a good chunk of those sales rotated into small cap stocks (+10.3% – iShares Russell 2000 ETF / IWM) and value stocks (+5.1% – iShares Russell 1000 Value ETF / IWD).
Despite concerns over global geopolitics, political election madness, and a slowing economy, investors are more focused on the positive prospect of future interest rate cuts by the Federal Reserve, starting in September with a probability exceeding 90% (see chart below).

Source: CME Group
Some investors got caught up in the dizzying rotation last month, but timing these rotations is nearly impossible and one month does not make a long-term trend. Rather than getting caught up in a fool’s errand, make sure your investment portfolio is diversified and built to withstand volatile rotations.
Wade W. Slome, CFA, CFP®
Plan. Invest. Prosper.
This article is an excerpt from a previously released Sidoxia Capital Management complimentary newsletter (August 1, 2024). Subscribe Here to view all monthly articles.
DISCLOSURE: Sidoxia Capital Management (SCM) and some of its clients hold positions in individual stocks , certain exchange traded funds (ETFs), including NVDA, but at the time of publishing had no direct position in any other security referenced in this article. No information accessed through the Investing Caffeine (IC) website constitutes investment, financial, legal, tax or other advice nor is to be relied on in making an investment or other decision. Please read disclosure language on the IC Contact page.
Stocks Winning Olympic Gold

This article is an excerpt from a previously released Sidoxia Capital Management complimentary newsletter (August 1, 2016). Subscribe on the right side of the page for the complete text.
The XXXI Olympics in Rio, Brazil begin this week, but stocks in 2016 have already won a gold medal for their stellar performance. The S&P 500 index has already triumphantly sprinted to new, all-time record highs this month. A significant portion of the gains came in July (+3.6%), but if you also account for the positive results achieved in the first six months of 2016, stocks have advanced +6.3% for the year. If you judge the 2%+ annualized dividend yield, the total investment return earns an even higher score, coming closer to +8% for the year-to-date period.
No wonder the U.S. is standing on the top of the economic podium compared to some of the other international financial markets, which have sucked wind during 2016:
- China Shanghai Index: -15.8%
- Japan Nikkei Index: -12.9%
- French Paris CAC Index: -4.3%
- German Dax Index: -3.8%
- Europe MSCI Index: -3.5%
- Hong Kong Heng Sang Index: -0.1%
While there are some other down-and-out financial markets that have rebounded significantly this year (e.g., Brazil +61% & Russia +23%), the performance of the U.S. stock market has been impressive in light of all the fear, uncertainty, and doubt blanketing the media airwaves. Consider the fact that the record-breaking performance of the U.S. stock market in July occurred in the face of these scary headlines:
- Brexit referendum (British exit from the European Union)
- Declining oil prices
- Declining global interest rates
- More than -$11,000,000,000,000.00 (yes trillions) in negative interest rate bonds
- Global terrorist attacks
- Coup attempt in Turkey
- And oh yeah, a contentious domestic presidential election
With so many competitors struggling, and the investment conditions so challenging, then how has the U.S. prospered with a gold medal performance in this cutthroat environment? For many individuals, the answer can be confusing. However, for Sidoxia’s followers and clients, the strong pillars for a continued bull market have been evident for some time (described again below).
Bull Market Pillars
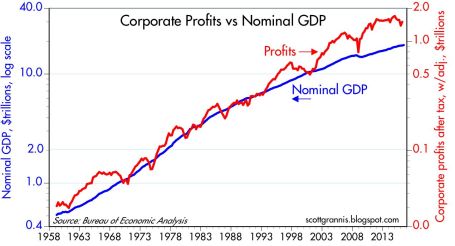
Surprising to some observers, stocks do not read pessimistic newspaper headlines or listen to gloomy news stories. In the short-run, stock prices can get injured by emotional news-driven traders and speculators, but over the long-run, stocks and financial markets are drawn like a magnet to several all-important metrics. What crucial metrics am I referring to? As I’ve reiterated in the past, the key drivers for future stock price appreciation are corporate profits, interest rates, valuations (i.e., price levels), and sentiment indicators (see also Don’t Be a Fool).
Stated more simply, money goes where it is treated best, and with many bonds and savings accounts earning negative or near 0% interest rates, investors are going elsewhere – for example, stocks. You can see from the chart below, economy/stocks are treated best by rising corporate profits, which are at/near record high levels. With the majority of stocks beating 2nd quarter earnings expectations, this shot of adrenaline has given the stock market an added near-term boost. A stabilizing U.S. dollar, better-than-expected banking results, and firming commodity prices have all contributed to the winning results.
Price Follows Earnings…and Recessions
What history shows us is stock prices follow the direction of earnings, which helps explain why stock prices generally go down during economic recessions. Weaker demand leads to weaker profits, and weaker profits lead to weaker stock prices. Fortunately for U.S. investors, there currently are no definitive signs of imminent recession clouds. Scott Grannis, the editor of Calafia Beach Pundit, sums up the relationship between recessions and the stock market here:
“Recessions typically follow periods of excesses—soaring home prices, rising inflation, widespread optimism—rather than periods dominated by risk aversion such as we have today. Risk aversion can still be found in abundance: just look at the extremely low level of Treasury yields, and the lack of business investment despite strong corporate profits.”
Similar to the Olympics, achieving success in investing can be very challenging, but if you want to win a medal, you must first compete. If you’re not investing, you’re not competing. And if you’re not investing, you have no chance of winning a financial gold medal. Just as in the Olympics, not everyone can win, and there are many ups and downs along the way to victory. Rather than focusing on the cheers and boos of the crowd, implementing a disciplined and diversified investment strategy that accounts for your time horizon, objectives, and risk tolerance is the championship approach that will increase your probability of landing on the Olympic medal podium.

Wade W. Slome, CFA, CFP®
Plan. Invest. Prosper.
DISCLOSURE: Sidoxia Capital Management (SCM) and some of its clients hold positions in certain exchange traded funds (ETFs), but at the time of publishing had no direct position in any other security referenced in this article. No information accessed through the Investing Caffeine (IC) website constitutes investment, financial, legal, tax or other advice nor is to be relied on in making an investment or other decision. Please read disclosure language on IC Contact page.
NASDAQ Redux

The NASDAQ Composite index once again crossed the psychologically, all-important 5,000 threshold this week for the first time since the infamous tech-bubble burst in the year 2000. Of course, naturally, the media jumped on a non-stop, multi-day offensive comparing and contrasting today’s NASDAQ vs. the NASDAQ twin of yesteryear. Rather than rehash the discussion once again, I have decided to post three articles I published in recent years on the topic covering the outperformance of the spotlighted, tech-heavy index.
NASDAQ 5,000 Irrational Exuberance Déjà Vu?

Investors love round numbers and with the Dow Jones Industrial index recently piercing 17,000 and the S&P 500 index having broken 2,000 , even novice investors have something to talk about around the office water cooler. While new all-time records are being set for the major indices during September, the unsung, tech-laden NASDAQ index has yet to surpass its all-time high of 5,132 achieved 14 and ½ years ago during March of 2000.
Click Here to Read the Rest of the Article
NASDAQ and the R&D Tech Revolution

It’s been a bumpy start for stocks so far in 2014, but the fact of the matter is the NASDAQ Composite Index is up this year and hit a 14-year high in the latest trading session (highest level since 2000). The same cannot be said for the Dow Jones Industrial and S&P 500 indices, which are both lagging and down for the year. Not only did the NASDAQ outperform the Dow by almost +12% in 2013, but the NASDAQ has also trounced the Dow by over +70% over the last five years.
Click Here to Read the Rest of the Article
NASDAQ: The Ugly Stepchild

All the recent media focus has been fixated on whether the Dow Jones Industrial Average index (“The Dow”) will close above the 13,000 level. In the whole scheme of things, this specific value doesn’t mean a whole lot, but it does make for a great topic of conversation at a cocktail party. Today, the Dow is trading at 12,983, a level not achieved in more than three and a half years. Not a bad accomplishment, given the historic financial crisis on our shores and the debacle going on overseas, but I’m still not so convinced a miniscule +0.1% move in the Dow means much. While the Dow and the S&P 500 indexes garner the hearts and minds of journalists and TV reporters, the ugly stepchild index, the NASDAQ, gets about as much respect as Rodney Dangerfield (see also No Respect in the Investment World).
Click Here to Read the Rest of the Article

Wade W. Slome, CFA, CFP®
Plan. Invest. Prosper.
DISCLOSURE: Sidoxia Capital Management (SCM) and some of its clients hold positions in certain exchange traded funds (ETFs) , but at the time of publishing, SCM had no direct position in any other security referenced in this article. No information accessed through the Investing Caffeine (IC) website constitutes investment, financial, legal, tax or other advice nor is to be relied on in making an investment or other decision. Please read disclosure language on IC Contact page.
NASDAQ 5,000…Irrational Exuberance Déjà Vu?
Investors love round numbers and with the Dow Jones Industrial index recently piercing 17,000 and the S&P 500 index having broken 2,000 , even novice investors have something to talk about around the office water cooler. While new all-time records are being set for the major indices during September, the unsung, tech-laden NASDAQ index has yet to surpass its all-time high of 5,132 achieved 14 and ½ years ago during March of 2000.
A lot has changed since then. Leading up to the pricking of the technology bubble, talks of an overhyped market started as early as December 5, 1996, when then Federal Reserve Chairman Alan Greenspan made his infamous “irrational exuberance” speech.
“But how do we know when irrational exuberance has unduly escalated asset values, which then become subject to unexpected and prolonged contractions as they have in Japan over the past decade?”-Alan Greenspan (Federal Reserve Chairman 1987 – 2006)
On that date, the NASDAQ closed at 1,300. A little over three years later, before values cratered by -78%, the index almost quadrupled higher to 5,132. Looked at from a slightly different lens, here is how the major indexes have fared since Greenspan’s widely referenced speech almost 18 years ago:

Despite the world’s most powerful banker calling stock prices irrational, the Dow & S&P have almost tripled in value (+164% & +167%, respectively) and the NASDAQ has almost quadrupled (+251%). The 80%+ outperformance (excluding dividends) is impressive, but reasonable if you consider this increase amounts to about a +7.2% compounded annual appreciation value. Investors have experienced a lot of heartburn over that long timeframe, but for any buy-and-holders, these returns would have trounced returns realized in alternative safe haven vehicles like CDs, savings accounts, or bonds.
Price: The Almighty Metric
There are many valuation metrics to evaluate but the most universal one is the Price/Earnings ratio (P/E). Just as in the process of assessing the value of a car, house, or stock, the price you pay is usually the most important factor of the purchase. The same principle applies to stock indexes. The cheaper the price paid, the greater probability of earning superior returns in the future. Unfortunately for investors in technology stocks, there was not much value in the NASDAQ index during late-1999, early-2000. Historical P/E data for the NASDAQ index is tough to come by, but some estimates pegged the index value at 200x’s its earnings at the peak of the 2000 technology mania. In other words, for every $1 in profit the average NASDAQ company earned, investors were willing to pay $200…yikes.
Today, the NASDAQ 100 index (the largest 100 non-financial companies in the NASDAQ index), which can serve as a proxy for the overll NASDAQ index, carries a reasonable P/E ratio of approximately 20x on a forward basis (24x on a trailing basis) – about 90% lower than the peak extremes of the NASDAQ index in the year 2000.
Although NASDAQ valuations are much lower today than during the bursting 2000 tech bubble, P/E ratios for the NASDAQ 100 still remain about +20% higher than the S&P 500, which begs the question, “Is the premium multiple deserved?”
As I wrote about in the NASDAQ Tech Revolution, you get what you pay for. If you pay a peanut multiple, many times you get a monkey stock. In the technology world, there is often acute obsolescence risk (remember Blackberry – BBRY?) that can lead to massive losses, but there also exists a winner-takes-all dynamic. Just think of the dominance of Google (GOOG/L) in search advertising, Microsoft (MSFT) in the PC, or Amazon (AMZN) in e-commerce. It’s a tricky game, but following the direction of cash, investments, and product innovation are key in my mind if you plan on finding the long-term winners. For example, the average revenue growth for the top 10 companies in the NASDAQ 100 averaged more than +100% annually from the end of 1999 to the end of 2013. Identifying the “Old Tech Guard” winners is not overly challenging, but discovering the “New Tech Guard” is a much more demanding proposition.
In the winner-takes-all hunt, one need not go any further than looking at the massive role technology plays in our daily lives. Twenty years ago, cell phones, GPS, DVRs (Digital Video Recorders), e-Readers, tablets, electric cars, iPods/MP3s, WiFi mobility, on-demand digital media, video-conferencing, and cloud storage either did not exist or were nowhere near mainstream. Many of these technologies manifest themselves into a whole host of different applications that we cannot live without. One can compile a list of these life-critical applications by thumbing through your smartphone or PC bookmarks. The list is ever-expanding, but companies like Twitter (TWTR), Facebook (FB), Amazon (AMZN), Uber, Netflix (NFLX), Priceline (PCLN), Yelp, Zillow (Z), and a bevy of other “New Tech Guard” companies have built multi-billion franchises that have become irreplaceable applications in our day-to-day lives.
Underlying all the arbitrary index value milestones (e.g., Dow 17,000 and S&P 2,000) since the 1990s has a persistent and unstoppable proliferation of technology adoption across virtually every aspect of our lives. NASDAQ 5,000 may not be here quite yet, but getting there over the next year or two may not be much of a stretch. Speculative tendencies could get us there sooner, and macro/geopolitical concerns could push the milestone out, but when we do get there the feeling of NASDAQ 5,000 déjà vu will have a much stronger foundation than the fleeting euphoric emotions felt when investors tackled the same level in year 2000.
Wade W. Slome, CFA, CFP®
Plan. Invest. Prosper.
DISCLOSURE: Sidoxia Capital Management (SCM) and some of its clients own AAPL, GOOG/L, AMZN, NFLX bonds (short the equity), FB (non-discretionary), MSFT (non-discretionary), PCLN (non-discretionary) and a range of positions in certain exchange traded fund positions, but at the time of publishing SCM had no direct position in TWTR, Uber, YELP, Z, or any other security referenced in this article. No information accessed through the Investing Caffeine (IC) website constitutes investment, financial, legal, tax or other advice nor is to be relied on in making an investment or other decision. Please read disclosure language on IC Contact page.
Lent: Giving Up the Gold Vice

Source: Photobucket
When it comes to Lent, most Christian denomination followers give up a vice, such as food, alcohol, or now in more modern times…Facebook (FB). Since Lent began on Ash Wednesday this year (February 22, 2012), investors have given up something else – gold (GLD). As a matter of fact, the shiny metal has declined by about -8% since Lent began. Stocks, on the other hand, as measured by the S&P 500, have outperformed gold by more than 10% over this period (the Lent period damage is even worse, if you look at the NASDAQ).
If you go back further in time, the underperformance is more extreme, once you account for dividends, which gold of course does not provide. For example, since the peak of the financial crisis panic in March of 2009, S&P 400, S&P 600, and NASDAQ stocks have outperformed gold by more than +40%. Yet, I am still waiting for the sign-spinning guy at the corner of First St. & Main St. to advertise stock trade-in opportunities. Contrarians may also get a kick out of the top investment CNBC survey too.

Source: Orlando Sentinel
Last Friday’s jobs data was nothing to write home about, so gold cheerleaders might wait for more fiat currency debasement to come in the form of QE3 (i.e., quantitative easing or printing press). But once again, while this potential added monetary stimulus may not be bad for gold, let’s not forget that stocks still outperformed gold under QE1 & QE2.
As I have always stated, I can’t disagree with the inflationary pressures that are brewing. Stimulative monetary and fiscal policies, coupled with emerging market expansion and undisciplined government spending don’t paint a pretty inflationary picture. So if that’s the case, why not focus on other commodities that provide real utility besides just shininess (e.g., agricultural goods, copper, aluminum, oil, and even silver).
The gold bugs may still have a little post-Lent party, until rates start going up and panic insurance premiums go down, but once the Fed’s easing policy stance changes (see Paul Volcker Fed Chairman era) and fiscal sanity eventually returns to Washington, investors may look to another vice to gorge on.
See also some other items to gorge on: CLICK HERE
Wade W. Slome, CFA, CFP®
Plan. Invest. Prosper.
DISCLOSURE: Sidoxia Capital Management (SCM) and some of its clients own certain exchange traded funds (including small cap ETFs, mid cap ETFs, energy ETFs, commodity ETFs) , but at the time of publishing SCM had no direct position in GLD, FB, or any other security referenced in this article. No information accessed through the Investing Caffeine (IC) website constitutes investment, financial, legal, tax or other advice nor is to be relied on in making an investment or other decision. Please read disclosure language on IC “Contact” page.
Happy Birthday Bull Market!

Birthdays are always fun, but they are always more fun when more people come to the party. The birthday of the current bull market started on March 9, 2009, and as many bears point out, volume has been low, with a relatively small number of investors joining the party with hats and horns. This skepticism is not unusual in typical bull markets because the psychological scars from the previous bear market are still fresh in investors’ minds. How can investors get excited about investing when we are surrounded by record deficits, political gridlock, a crumbling European Union, slowing China, and peak corporate margins?
Bears Receive Party Invite but Stay Home
Perma-bears like Peter Schiff, Nouriel Roubini, John Mauldin, Mohamed El-Erian, and David Rosenberg have been consistently wrong over the last three years with their advice, but in some instances can sound smart shoveling it out to unassuming investors.
While nervous investors and bears have missed the 125%+ rally (see table below) over the last three years (mitigated by upward but underperforming gold prices), what many observers have not realized is that the so-called “Lost Decade” (see also Can the Lost Decade Strike Twice?) has actually been pretty spectacular for shrewd investors. Even if you purchased small and mid cap stocks at the peak of the market in March 2000, that large swath of stocks is up over +100%…yes, that’s right, more than doubled over the last 12 years. If you consider dividends, the numbers look significantly better.
Doubters of the equity market rally also ignore the three-year +135% advance in the NASDAQ (see also Ugly Stepchild) in part because the 11-year highs being registered still lag the peak levels reached in March 2000. Even though the NASDAQ increased 9-fold in the 1990s, if you bought the NASDAQ index in the first half of 1999, you would have still outperformed the S&P 500 index through the 2012 year-to-date period. Irrespective of how anyone looks at the performance of the NASDAQ index, it still has outperformed the S&P 500 index by more than +200% over the last 25 years, even if you include the bursting of the 2000 technology bubble.

CLICK TO ENLARGE
The point of all these statistics is to show that if you didn’t buy technology stocks at the climax of late 1999 or early 2000 prices, then the amount and type of available opportunities have been plentiful. The table above does not include emerging markets like Brazil, Mexico, and India (to name a few) that have also about doubled in price from the 2000 timeframe to 2012.
Heartburn can Accompany Sweet Treats
Being Pollyannaish after a doubling in market prices is never a wise decision. After three years of massive appreciation, those participating in the bull market run have eaten a lot of tasty cake. Now the question becomes, will investors also get some ice cream and a gift bag to go before the party ends? With the sweetness of the cake still being digested, there are still plenty of scenarios that can create investor heartburn. Obviously, the sovereign debt pig still needs to work its way through the European snake, and that could still take some time. In addition, although macroeconomic data (including employment data) generally have been improving, the trajectory of corporate profits has been decelerating – due in part to near record profit margins getting pressured by rising input costs. Domestically, structural debt and deficit issues have not gone away, and perpetual neglect will only exacerbate the current problems. On the psychology front, even though investors remain skittish, those still in the game are getting more complacent as evidenced by the VIX index now falling to the teens (a negative contrarian indicator).
Despite some of these cautionary signals, the good news is that many of these issues have been known for some time and have been reflected in valuations of the overall large cap indexes. Moreover, trillions of dollars remain idle in low yielding strategies as investors wait on the sidelines. Once prices move higher and there is more comfort surrounding the sustainability of an economic recovery, then capital will come pouring back into equity markets. In other words, investors will have to pay a premium cherry price if they wait for a comforting consensus to coalesce.
Limited Options
The other advantage working in investors’ favor is the lack of other attractive investment alternatives. Where are you going to invest these days when 10-year Treasuries and short-term CDs are yielding next to nothing? How about investing in risky, leveraged, illiquid real estate, just as banks unload massive numbers of foreclosures and process millions of short sales? If those investments don’t tickle your fancy, then how about pricey insurance and annuity products that nobody can understand? Cash was comforting in 2008-2009 and during volatility in recent summers, but with spiking food, energy, leisure, and medical costs, when does that cash comfort turn to cash pain?
Easy money and low interest rate policies being advocated by Federal Reserve Chairman Ben Bernanke and other global central bankers have sucked up available investment opportunities and compelled investors to look more closely at riskier assets like equities. With the large run in equities, I have been trimming back my winners and redeploying proceeds into higher dividend paying stocks and underperforming sectors of the market. Skepticism still abounds, and we may be ripe for a short-term pullback in the equity markets. For those rare birthday party attendees who are called long-term investors, opportunities still remain despite the large run in equities. The cake has been sweet so far, but if you are patient, some ice cream and a gift bag may be coming your way as well.
Wade W. Slome, CFA, CFP®
Plan. Invest. Prosper.
DISCLOSURE: Sidoxia Capital Management (SCM) and some of its clients own certain exchange traded funds (including emerging market, international, and bond/treasury ETFs), but at the time of publishing SCM had no direct position in VXX, MXY, or any other security referenced in this article. No information accessed through the Investing Caffeine (IC) website constitutes investment, financial, legal, tax or other advice nor is to be relied on in making an investment or other decision. Please read disclosure language on IC “Contact” page.


