Posts tagged ‘ICI’
Stirring the Sentiment Tea Leaves Redux

Despite the Volatility Index (VIX) currently operating at the low end of historical ranges (9.36), the equity markets operate on a perpetual volatility rollercoaster. This period of relative calm has not stopped participants from searching for the Holy Grail of indicators in hopes of determining whether the next large move in the markets is upwards or downwards. Although markets may be efficient in the long-run (see Crisis Black Eye), in the short-run, financial markets are hostage to fear and greed, and these emotions have been on full display. Although the Dow Jones Industrial Average has almost catapulted almost +4,000 points since the period right before the 2016 Presidential Election, last June also produced a roughly -1,000 point decline in the Dow. With fresh fears over Russian intervention-collusion, global monetary policy uncertainty, and political risk in North Korea, investors are grasping for clues as they read the indicator tea leaves to better position their portfolios. Some of these contrarian sentiment indicators can be helpful to your portfolio, if used properly. However, in large part, interpreting many of the sentiment indicators is as useful as reading tea leaves for your winning lotto number picks.
The Art of Tea Leave Reading
The premise behind contrarian investing is fairly simple – if you follow the herd, you will be led to the slaughterhouse. There is a tendency for investors to succumb to short-termism and act on their emotions rather than reason. The pendulum of investment emotions continually swings back and forth between fear and greed, and many of these indicators are designed with the goal of capturing emotion extremes.
The concept of mass hysteria is nothing new. Back in 1841, Charles Mackay published a book entitled, Extraordinary Popular Delusions and the Madness of Crowds, in which Mackay explores the psychology of crowds and mass mania through centuries of history, including the infamous Dutch Tulip Mania of the early 1600s (see Soros Super Bubble).
Out of sympathy for your eyeballs, I will not conduct an in-depth review of all the contrarian indicators, but here is brief sampling:
Sentiment Surveys: The American Association of Individual Investors (AAII) releases weekly survey results from its membership. A different survey, conducted by Investors Intelligence, called the Advisors Sentiment Index, surveys authors of various stock advice newsletters. These data can provide some insights, but as you can probably gather, these surveys are also very subjective and often conflicting.
Put-Call Ratio: This is a widely used ratio that measures the trading volume of bearish put options to bullish call options and is used to gauge the overall mood of the market. When investors are fearful and believe prices will go lower, the ratio of puts to calls escalates. At historically high levels (see chart below), this ratio usually indicates a bottoming process in the market.
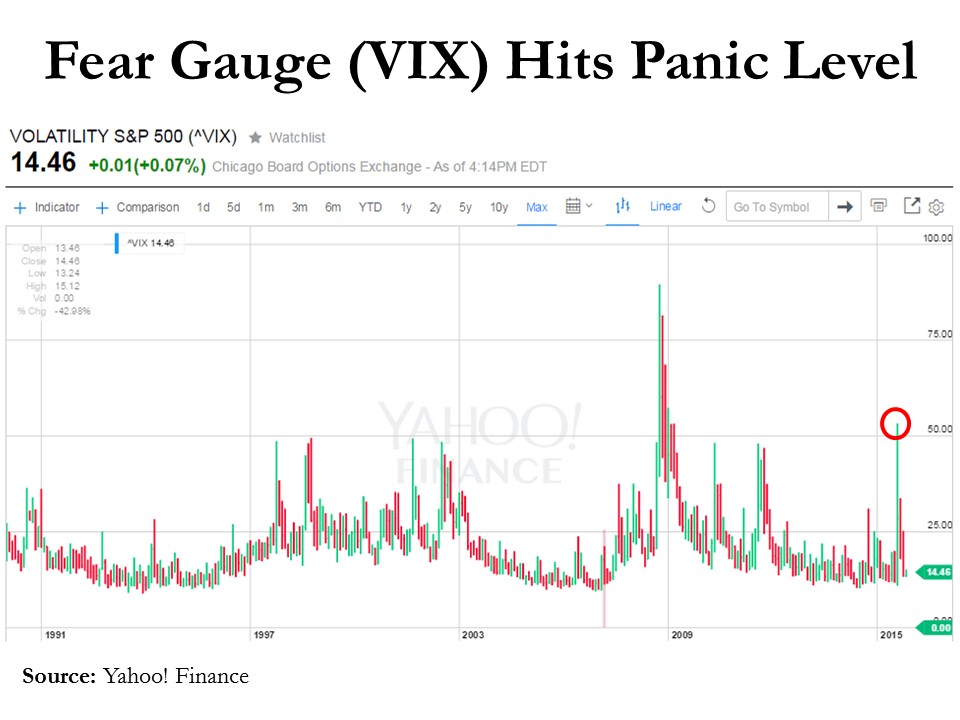
Volatility Index (VIX): The VIX indicator or “Fear Gauge” calculates inputs from various call and put options to create an approximation of the S&P 500 index implied volatility for the next 30 days. Put simply, when fear is high, the price of insurance catapults upwards and the VIX moves higher.
Strategist Sentiment: If you’re looking for a contrarian call to payoff, I wouldn’t hold your breath by waiting for bearish strategist sentiment to kick-in. Barry Ritholtz at the Big Picture got it right when he summarized Barron’s bullish strategist outlook by saying, “File this one under Duh!” Like most Wall Street and asset management firms, strategists have an inherent conflict of interest to provide a rosy outlook. More often than not, strategists’ opinions move like the wind in whatever direction stocks are currently moving.
Short Interest: The higher the amount of shares shorted, the larger the pent-up demand to buy shares becomes in the future. Extremely high levels of short interest tend to coincide with price bottoms because as prices begin to move higher, holders of short positions often feel “squeezed” to buy shares and push prices higher.
Fund Flow Data: The direction of investment dollars flowing in and out of mutual funds can provide some perspective on the psychology of the masses. This data can be found at the Investment Company Institute (ICI). Given the bloodletting of the 2008-2009 financial crisis, investors skepticism has made stocks about as popular as the approval ratings of Congress.
When it comes to sentiment indicators, I believe actions speak much louder than words. To the extent I actually do track some of these indicators, I pay much less attention to those indicators based on opinions, surveys, and technical analysis data (see Astrology or Lob Wedge). Most of my concentration is centered on those indicators explaining actual measurable investor behavior (i.e., Put-Call, VIX, Short Interest, Fund Flow, and other action-oriented trading metrics).
As we know from filtering through the avalanche of daily news data, the world can obviously can be a scary place (see Head Fakes Surprise). If you believe the world is on the cusp of ending and/or you do not believe investors are sufficiently bearish, I encourage you to build your own personal bunker and stuff it with gold or Bitcoin. If, however, you are looking to sharpen the returns on your portfolio and are thirsty for some emotional answers, pour yourself a cup of tea and pore over some sentiment indicators.

Wade W. Slome, CFA, CFP®
Plan. Invest. Prosper.
DISCLOSURE: Sidoxia Capital Management (SCM) and some of its clients own certain exchange traded funds, but at the time of publishing SCM had no direct position in any security referenced in this article. No information accessed through the Investing Caffeine (IC) website constitutes investment, financial, legal, tax or other advice nor is to be relied on in making an investment or other decision. Please read disclosure language on IC “Contact” page.
Out of the Woods?

In the middle of the 24/7 news cycle, many investors get distracted by the headline du jour, much like a baby gets distracted by a shiny new object. While investor moods have been swinging violently back and forth, October’s performance has bounced back like a flying tennis ball. So far, the reversal in the S&P 500 performance has more than erased the -9% correction occurring in August and September. Could we finally be out of the woods, or will geopolitics and economic factors scare investors through Halloween and year-end?
Given recent catapulting stock prices, investor amnesia has erased the shear horror experienced over the last few months – this is nothing new for emotional stock market participants. As I wrote in Controlling the Lizard Brain, human brains have evolved the almond-shaped tissue in our brains (amygdala) that controlled our ancestors’ urge to flee ferocious lions. Today the urge is to flee scary geopolitical and economic headlines.
I expanded on the idea here:
“When the brain in functioning properly, the prefrontal cortex (the front part of the brain in charge of reasoning) is actively communicating with the amygdala. Sadly, for many people, and investors, the emotional response from the amygdala dominates the rational reasoning portion of the prefrontal cortex. The best investors and traders have developed the ability of separating emotions from rational decision making, by keeping the amygdala in check.”
Evidence of lizard brains fear for flight happened just two months ago when the so-called “Fear Gauge” (VIX – Volatility Index) hit a stratospherically frightening level of 53 (see chart below), reached only once over the last few decades (2008-09 Financial Crisis).
Just as quickly as slowing China growth and a potential Fed interest rate hike caused investors to crawl underneath their desks during August (down –11% in four days), while biting their fingernails, investors have now sprung outside to the warm sunshine. The end result has been an impressive, mirror-like +11% increase in stock prices (S&P 500) over the last 18 trading days.
Has anything really changed over the last few weeks? Probably not. Economists, strategists, analysts, and other faux-soothsayers get paid millions of dollars in a fruitless attempt to explain day-to-day (or hour-by-hour) volatility in the stock markets. One Nobel Prize winner, Paul Samuelson, understood the random nature of stock prices when he observed, “The stock market has forecast nine of the last five recessions.” The pundits are no better at consistently forecasting stock prices.
As I have reiterated many times before, the vast majority of the pundits do not manage money professionally – the only people you should be paying attention to are successful long-term investors. Even listening to veteran professional investors can be dangerous because there is often such a wide dispersion of opinions based on varying time horizons, strategies, and risk tolerances.
Skepticism remains rampant regarding the sustainability of the bull market as demonstrated by the -$100 billion+ pulled out of domestic equity funds during 2015 (Source: ICI). The Volatility Index (VIX) shows us the low-hanging fruit of pessimism has been picked with the metric down -73% from August. With legislative debt ceiling and sequestration debates ahead in the coming weeks, we could hit some more choppy waters. Short-term volatility may resurrect itself, but the economy keeps chugging along, interest rates remain near all-time lows, and stock valuations, broadly speaking, remain reasonable. Investors may not be out of the woods yet, but one thing remains certain…an ever-changing stream of fearful headlines are likely to continue flooding in, which means we must all keep our lizard brains in check.
Wade W. Slome, CFA, CFP®
Plan. Invest. Prosper.
DISCLOSURE: Sidoxia Capital Management (SCM) and some of its clients hold positions in certain exchange traded funds (ETFs), but at the time of publishing, SCM had no direct position in any other security referenced in this article. No information accessed through the Investing Caffeine (IC) website constitutes investment, financial, legal, tax or other advice nor is to be relied on in making an investment or other decision. Please read disclosure language on IC Contact page.
2014: Here Comes the Dumb Money!

Before this year’s gigantic rally, I wrote about the unexpected risk of a Double Rip. At that time, all the talk and concern was over the likelihood of a “Double Dip” recession due to the sequestration, tax increases, Obamacare, and an endless list of other politically charged worries.
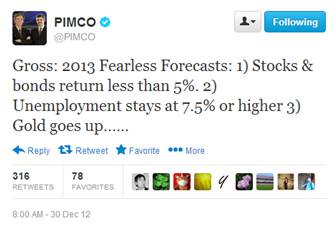
Perma-bear Nouriel Roubini has already incorrectly forecasted a double-dip in 2009, 2010, 2011, and 2012, and bond maven Bill Gross at PIMCO has fallen flat on his face with his “2013 Fearless Forecasts”: 1) Stocks & bonds return less than 5%. 2) Unemployment stays at 7.5% or higher 3) Gold goes up.
Well at least Bill was correct on 1 of his 4 predictions that bonds would suck wind, although achieving a 25% success rate would have earned him an “F” at Duke. The bears’ worst nightmares have come to reality in 2013 with the S&P up +25% and the NASDAQ climbing +33%, but there still are 11 trading days left in the year and a Hail Mary taper-driven collapse is in bears’ dreams.
Source: Scott Grannis
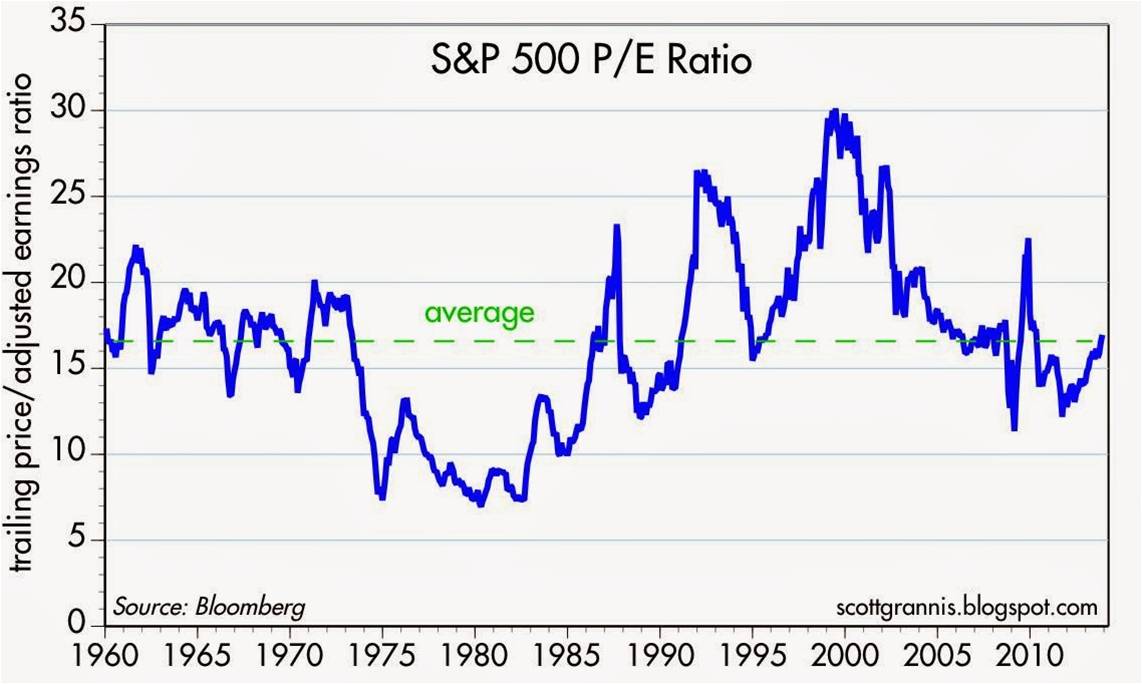
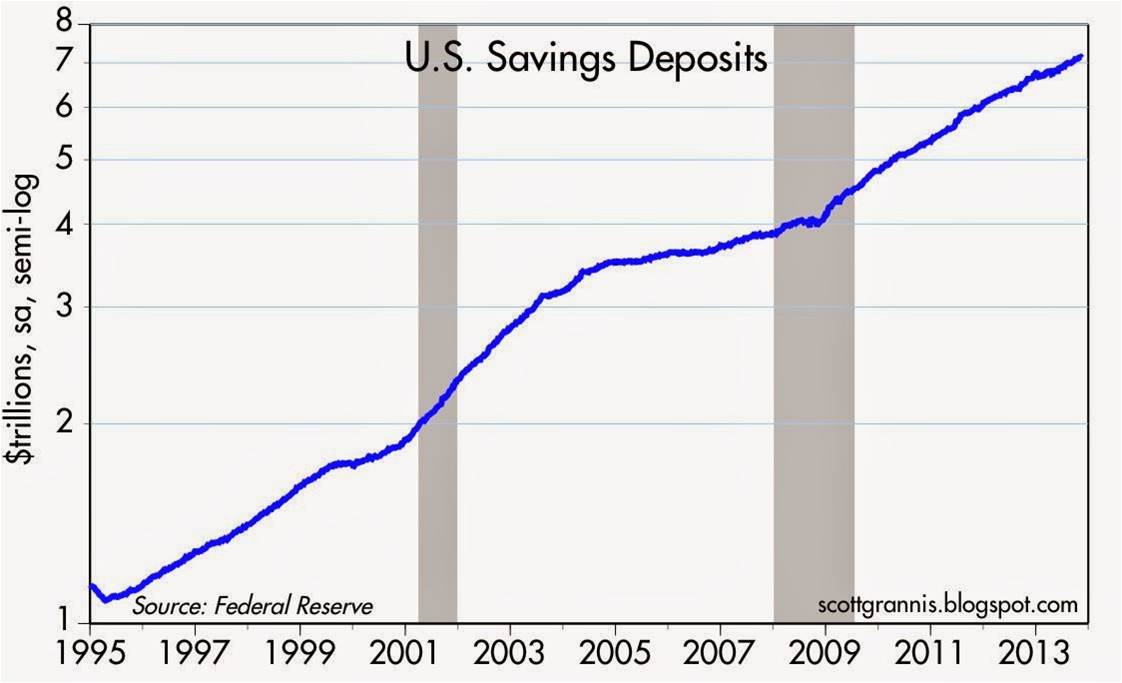
For bulls, the year has brought a double dosage of GDP and job expansion, topped with a cherry of multiple expansion on corporate profit growth. As we head into 2014, at historically reasonable price-earnings valuations (P/E of ~16x – see chart above), the new risk is no longer about Double-Dip/Rip, but rather the arrival of the “dumb money.” You know, the trillions of fear capital (see chart below) parked in low-yielding, inflation-losing accounts such as savings accounts, CDs, and Treasuries that has missed out on the more than doubling and tripling of the S&P and NASDAQ, respectively (from the 2009 lows).
Source: Scott Grannis
The fear money was emboldened in 2009-2012 because fixed income performed admirably under the umbrella of declining interest rates, albeit less robustly than stocks. The panic trade wasn’t rewarded in 2013, and the dumb money trade may prove challenging for the bears in 2014 as well.
Despite the call for the “great rotation” out of bonds into stocks earlier this year, the reality is it never happened. I will however concede, a “great toe-dip” did occur, as investor panic turned to merely investor skepticism. If you consider the domestic fund flows data from ICI (see chart below), the modest +$28 billion inflow this year is a drop in the bucket vis-à-vis the hemorrhaging of -$613 billion out of equities from 2007-2012.

Will I be talking about the multi-year great rotation finally coming to an end in 2018? Perhaps, but despite an impressive stock rally over the previous five years in the face of a wall of worry, I wonder what a half trillion dollar rotation out of bonds into stocks would mean for the major indexes? While a period of multi-year stock buying would likely be good for retirement portfolios, people always find it much easier to imagine potentially scary downside scenarios.
It’s true that once the taper begins, the economy gains more steam, and interest rates begin rising to a more sustainable level, the pace of this stock market recovery is likely to lose steam. The multiple expansion we’ve enjoyed over the last few years will eventually peak, and future market returns will be more reliant on the lifeblood of stock-price appreciation…earnings growth (a metric near and dear to my heart).
The smart money has enjoyed another year of strong returns, but the party may not quite be over in 2014 (see Missing the Pre-Party). Taper is the talk of the day, but investors might pull out the hats and horns this New Year, especially if the dumb money comes to join the fun.
Wade W. Slome, CFA, CFP®
Plan. Invest. Prosper.
DISCLOSURE: Sidoxia Capital Management (SCM) and some of its clients hold positions in certain exchange traded funds (ETFs), but at the time of publishing SCM had no direct position in any other security referenced in this article. No information accessed through the Investing Caffeine (IC) website constitutes investment, financial, legal, tax or other advice nor is to be relied on in making an investment or other decision. Please read disclosure language on IC Contact page.
Stirring the Sentiment Tea Leaves Redux
The equity markets have been on a volatility rollercoaster while participants continue to search for the Holy Grail of indicators – in hopes of determining whether the next large move in the markets is upwards or downwards. Although markets may be efficient in the long-run (see Crisis Black Eye), in the short-run, financial markets are hostage to fear and greed, and these emotions have been on full display. In the last two weeks alone, we have witnessed the Dow Jones Industrial Average catapult skyward over +1,200 points, while just a few weeks earlier the Dow cratered about -800 points in a five day period. With fresh fears of a European banking collapse, a global recession, and an uncertain election in the U.S. approaching, investors are grasping for clues as they read the indicator tea leaves to better position their portfolios. Some of these contrarian sentiment indicators can be helpful to your portfolio, if used properly, however interpreting many of the sentiment indicators is as useful as reading tea leaves is for picking winning lotto numbers.
The Art of Tea Leave Reading
The premise behind contrarian investing is fairly simple – if you follow the herd, you will be led to the slaughterhouse. There is a tendency for investors to succumb to short-termism and act on their emotions rather than reason. The pendulum of investment emotions continually swings back and forth between fear and greed, and many of these indicators are designed with the goal of capturing emotion extremes.
The concept of mass hysteria is nothing new. Back in 1841, Charles Mackay published a book entitled, Extraordinary Popular Delusions and the Madness of Crowds, in which Mackay explores the psychology of crowds and mass mania through centuries of history, including the infamous Dutch Tulip Mania of the early 1600s (see Soros Super Bubble).
Out of sympathy for your eyeballs, I will not conduct an in-depth review of all the contrarian indicators, but here is brief sampling:
Sentiment Surveys: The American Association of Individual Investors (AAII) releases weekly survey results from its membership. With the recent stock market bounce, bullish sentiment has escalated up near historic averages (39.8% bullish), yet the bears still remain skeptical – more than 6% higher than normal (36.4% bearish). A different survey, conducted by Investors Intelligence, called the Advisors Sentiment Index, surveys authors of various stock advice newsletters. The index showed bearish sentiment reaching 46.3%, the highest negative reading since the 2008-2009 bear market low. These data can provide some insights, but as you can probably gather, these surveys are also very subjective and often conflicting.
Put-Call Ratio: This is a widely used ratio that measures the trading volume of bearish put options to bullish call options and is used to gauge the overall mood of the market. When investors are fearful and believe prices will go lower, the ratio of puts to calls escalates. At historically high levels (see chart below), this ratio usually indicates a bottoming process in the market.
Volatility Index (VIX): The VIX indicator or “Fear Gauge” calculates inputs from various call and put options to create an approximation of the S&P 500 index implied volatility for the next 30 days. Put simply, when fear is high, the price of insurance catapults upwards and the VIX moves higher. Over the last 25 years a VIX reading of 44 or higher has only been reached nine times (source: Don Hays), so as you can see from the chart below, the recent market rally has coincided with the short-term peak in the VIX.

Source: Market-Harmonics.com
Strategist Sentiment: If you’re looking for a contrarian call to payoff, I wouldn’t hold your breath by waiting for bearish strategist sentiment to kick-in. Barry Ritholtz at the Big Picture got it right when he summarized Barron’s bullish strategist outlook by saying, “File this one under Duh!” Like most Wall Street and asset management firms, strategists have an inherent conflict of interest to provide a rosy outlook. For what it’s worth, the market is up slightly since the Barron’s strategist outlook was published last month.
Short Interest: The higher the amount of shares shorted, the larger the pent-up demand to buy shares becomes in the future. Extremely high levels of short interest tend to coincide with price bottoms because as prices begin to move higher, holders of short positions often feel “squeezed” to buy shares and push prices higher. According to SmartMoney.com, hedge fund managers own the lowest percentage of stocks (45%) since March 2009 market price bottom. Research from Data Explorer also suggests that sentiment is severely negative – the highest short interest level experienced since mid-2009.
Fund Flow Data: The direction of investment dollars flowing in and out of mutual funds can provide some perspective on the psychology of the masses. Recent data coming from the Investment Company Institute (ICI) shows that -$63.6 billion has flowed out of all equity funds in 2011, while +$81.7 billion has flowed into bond funds. Suffice it to say, investor nervousness has made stocks as about as popular as the approval ratings of Congress.
When it comes to sentiment indicators, I believe actions speak much louder than words. To the extent I actually do track some of these indicators, I pay much less attention to those indicators based on opinions, surveys, and technical analysis data (see Astrology or Lob Wedge). Most of my concentration is centered on those indicators explaining actual measurable investor behavior (i.e., Put-Call, VIX, Short Interest, Fund Flow, and other action-oriented trading metrics).
As we know from filtering through the avalanche of daily news data, the world can obviously become a much worse place (i.e., Greece, eurozone collapse, double-dip, inflation, banking collapse, muni defaults, widening CDS spreads, etc,). If you believe the world is on the cusp of ending and/or you do not believe investors are sufficiently bearish, I encourage you to build your bunker stuffed with gold, and/or join the nearest local Occupy Wall Street chapter. If, however, you are looking to sharpen the returns on your portfolio and are thirsty for some emotional answers, pour yourself a cup of tea and pore over some sentiment indicators.
Wade W. Slome, CFA, CFP®
Plan. Invest. Prosper.
DISCLOSURE: Sidoxia Capital Management (SCM) and some of its clients own certain exchange traded funds, but at the time of publishing SCM had no direct position in JPM, or any other security referenced in this article. No information accessed through the Investing Caffeine (IC) website constitutes investment, financial, legal, tax or other advice nor is to be relied on in making an investment or other decision. Please read disclosure language on IC “Contact” page.


