Posts tagged ‘housing’
Fed Ripping Off the Inflation Band-Aid

Inflation rates have been running near 40-year highs, and as a result, the Federal Reserve is doing everything in its power to rip off the Band-Aid of insidious high price levels in a swift manner. The Fed’s goal is to inflict quick, near-term pain on the economy in exchange for long-term price stability and future economic gains. How quickly has the Fed been hiking interest rates? The short answer is the rate of increases has been the fastest in decades (see chart below). Essentially, the Federal Reserve has pushed the targeted benchmark Federal Funds target rate from 0% at the beginning of this year to 3.25% today. Going forward, the goal is to lift rates to 4.4% by year-end, and then to 4.6% by next year (see Fed’s “dot plot” chart).
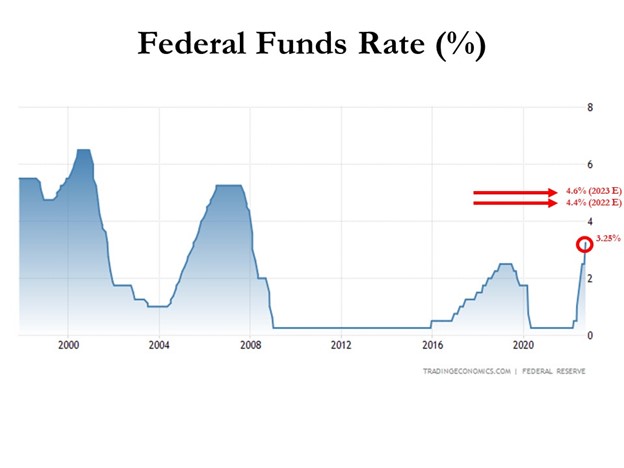
How should one interpret all of this? Well, if the Fed is right about their interest rate forecasts, the Band-Aid is being ripped off very quickly, and 95% of the pain should be felt by December. In other words, there should be a light at the end of the tunnel, soon.
The Good News on Inflation
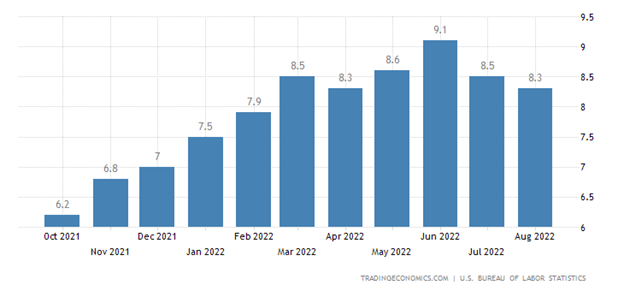
When it comes to inflation, the good news is that it appears to be peaking (see chart below), and many economists see the declining inflation trend continuing in the coming months. Why do pundits see inflation peaking? For starters, a broad list of commodity prices have declined significantly in recent months, including gasoline, crude oil, steel, copper, and gold, among many others.
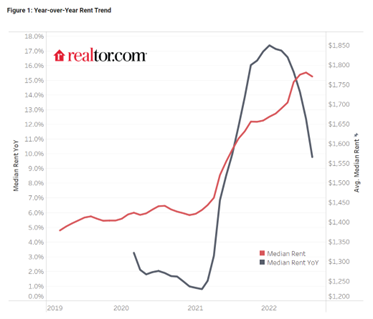
Outside of commodities, investors have seen prices drop in other areas of the economy as well, including housing prices, which recently experienced the fastest monthly price drop in 11 years, and rent prices as well (see chart below).
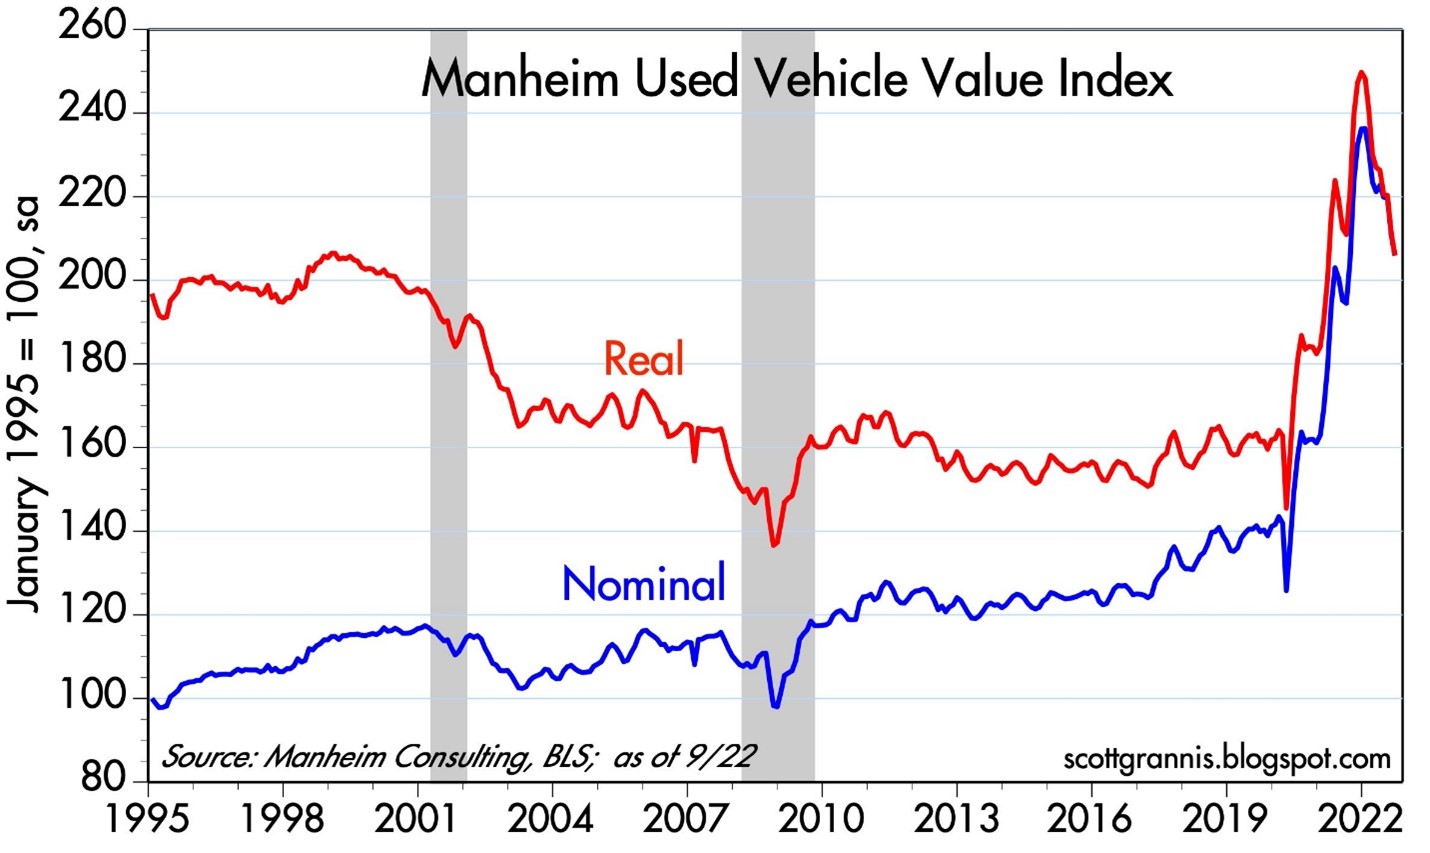
Anybody who was shopping for a car during the pandemic knows what happened to pricing – it exploded higher. But even in this area, we are seeing prices coming down (see chart below), and CarMax Inc. (KMX), the national used car retail chain confirmed the softening price trend last week.
Pain Spread Broadly
When interest rates increase at the fastest pace in 40 years, pain is felt across almost all asset classes. It’s not just U.S. stocks, which declined -9.3% last month (S&P 500), but it’s also housing -8.5% (XHB), real estate investment trusts -13.8% (VNQ), bonds -4.4% (BND), Bitcoin -3.1%, European stocks -10.1% (VGK), Chinese stocks -14.4% (FXI), and Agriculture -3.0% (DBA). The +17% increase in the value of the U.S. dollar this year against a basket of foreign currencies is substantially pressuring cross-border business for larger multi-national companies too – Microsoft Corp. (MSFT), for example, blamed U.S. dollar strength as the primary reason to cut earnings several months ago. Like Hurricane Ian, large interest rate increases have caused significant damage across a wide swath of areas.
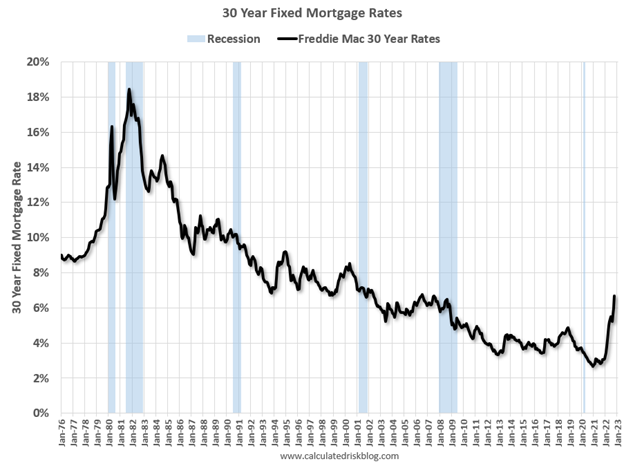
But for those following the communication of Federal Reserve Chairman, Jerome Powell, in recent months, they should not be surprised. Chairman Powell has signaled on numerous occasions, including last month at a key economic conference in Jackson Hole, Wyoming, that the Fed’s war path to curb inflation by increasing interest rates will inflict wide-ranging “pain” on Americans. Some of that pain can be seen in mortgage rates, which have more than doubled in 2022 and last week eclipsed 7.0% (see chart below), the highest level in 20 years.
Now is Not the Time to Panic
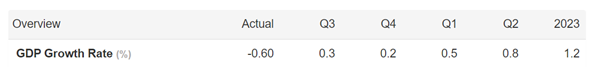
There is a lot of uncertainty out in the world currently (i.e., inflation, the Fed, Russia-Ukraine, strong dollar, elections, recession fears, etc.), but that is always the case. There is never a period when there is nothing to be concerned about. With the S&P 500 down more than -25% from its peak (and the NASDAQ down approximately -35%), now is not the right time to panic. Knee-jerk emotional decisions during stressful times are very rarely the right response. With these kind of drops, a mild-to-moderate recession is already baked into the cake, even though the economy is expected to grow for the next four quarters and for all of 2023 (see GDP forecasts below). Stated differently, it’s quite possible that even if the economy deteriorates into a recession, stock prices could rebound smartly higher because any potential future bad news has already been anticipated in the current price drops.
Worth noting, as I have pointed out previously, numerous data points are indicating inflation is peaking, if not already coming down. Inflation expectations have already dropped to about 2%, if you consider the spread between the yield on the 5-Year Note (4%) and the yield on the 5-Year TIP-Treasury Inflation Protected Note (2%). If the economy continues to slow down, and inflation has stabilized or declined, the Federal Reserve will likely pivot to decreasing interest rates, which should act like a tailwind for financial markets, unlike the headwind of rising rates this year.
Ripping off the Band-Aid can be painful in the short-run, but the long-term gains achieved during the healing process can be much more pleasurable.

Wade W. Slome, CFA, CFP®
Plan. Invest. Prosper.
DISCLOSURE: Sidoxia Capital Management (SCM) and some of its clients hold positions in MSFT, BND and certain exchange traded funds (ETFs), but at the time of publishing had no direct position in KMX, XHB, VNQ, VGK, FXI, DBA or any other security referenced in this article. No information accessed through the Investing Caffeine (IC) website constitutes investment, financial, legal, tax or other advice nor is to be relied on in making an investment or other decision. Please read disclosure language on IC Contact page.
Politics & COVID Tricks

Thanks to a global epidemic, trillions of dollars instantly disappeared during the first quarter of this year, and then, abracadabra…the losses turned into gains and magically reappeared in the subsequent two quarters. After a stabilization in the spread of the COVID-19 virus earlier this year, the stock market rebounded for five consecutive months, at one point rebounding +64% (from late March to early September) – see chart below. However, things became a little bit trickier for the recent full month as concerns heightened over the outcome of upcoming elections; uncertainty over a potential coronavirus-related stimulus package agreement; and fears over a fall resurgence in COVID-19 cases. Although the S&P 500 stock index fell -3.9% and the Dow Jones Industrial Average slipped -2.3% during September, the same indexes levitated +8.5% and +7.6% for the third quarter, respectively.
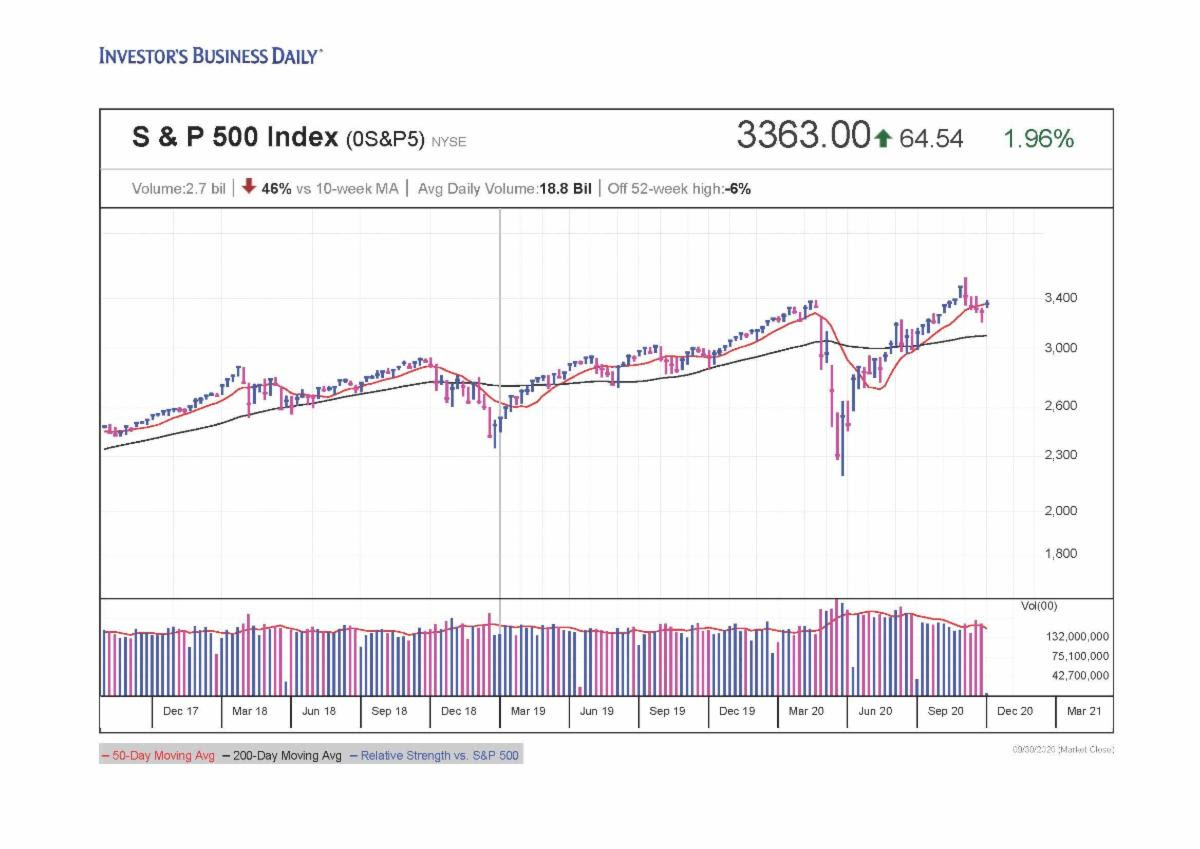
Source: Investors.com
Washington Worries
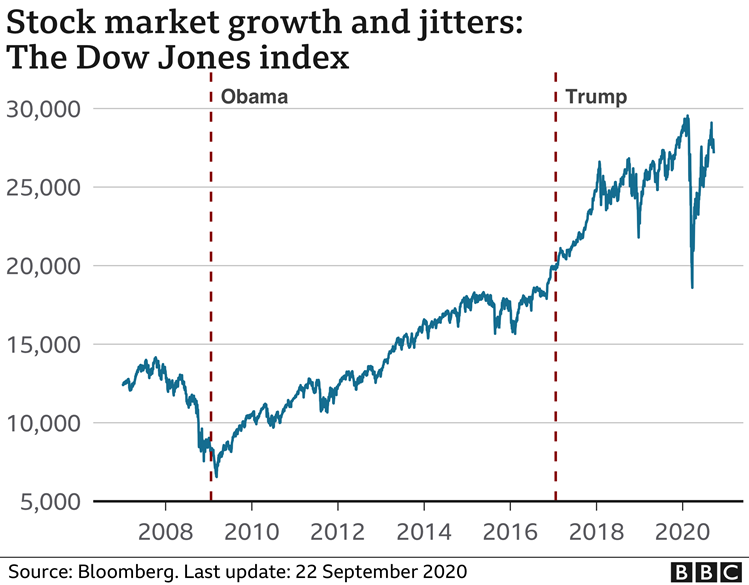
Anxiety over politics is nothing new, and as I’ve written extensively in my Investing Caffeine blog, history teaches us that politics have little to do with the long-term performance of the overall stock market (e.g., see Politics & Your Money). Nobody knows with certainty how the elections will impact the financial markets and economy (myself included). But what I do know is that many so-called experts said the stock market would decline if Barack Obama won the presidential election…in reality the stock market soared. I also know the so-called experts said the stock market would decline if Donald Trump won the presidential election… in reality the stock market soared. So, suffice it to say, I don’t place a lot of faith into what any of the so-called political experts say about the outcome of upcoming elections (see the chart below).
COVID Coming Back?
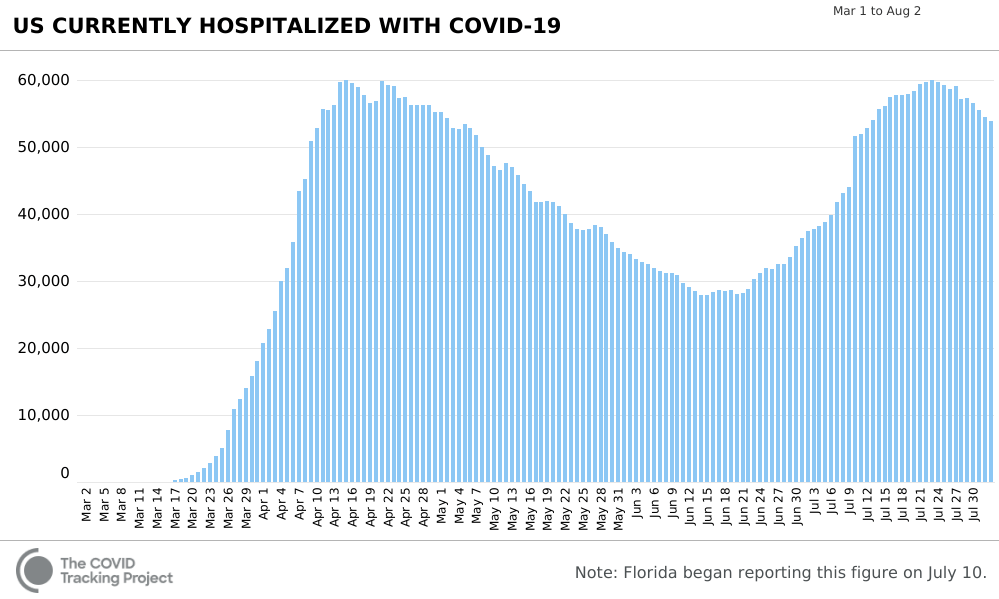
One of the reasons stock prices have risen more than 50%+ is due to a stabilization in COVID-19 virus trends. As you can see from the charts below, new tests, hospitalizations, and death rates are generally on good trajectories, according to the COVID Tracking Project. However, new COVID cases have bumped higher in recent weeks. This recent, troubling trend has raised the question of whether another wave of cases is building in front of a dangerous, seasonally-cooler fall flu season. Traditionally, it’s during this fall period in which contagious viruses normally spread faster.
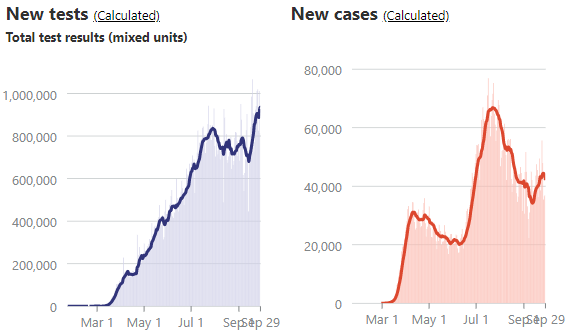
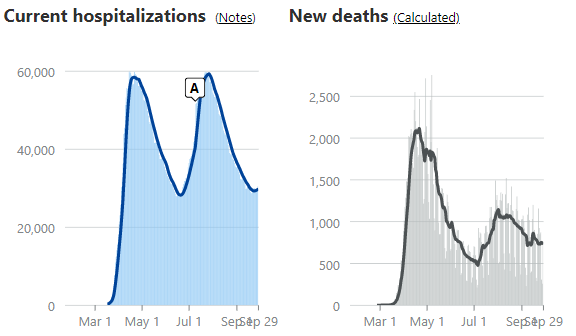
Source: The COVID Tracking Project
Regardless of the trendline in new cases, there is plenty of other promising COVID developments to help fight this pandemic, such as the pending approvals of numerous vaccines, along with improved therapies and treatments, such as therapeutics, steroids, blood thinners, ventilators, and monoclonal antibodies.
Business Bounce
From the 10,000-foot level, despite worries over various political outcomes, the economy is recovering relatively vigorously. As you can see from the chart below, the rebound in employment has been fairly swift. After peaking in April at 14.7%, the most recent unemployment rate has declined to 8.4%, and a closely tracked ADP National Employment Report was released yesterday showing a higher than expected increase in new private-sector monthly jobs (749,000 vs. 649,000 median estimate).
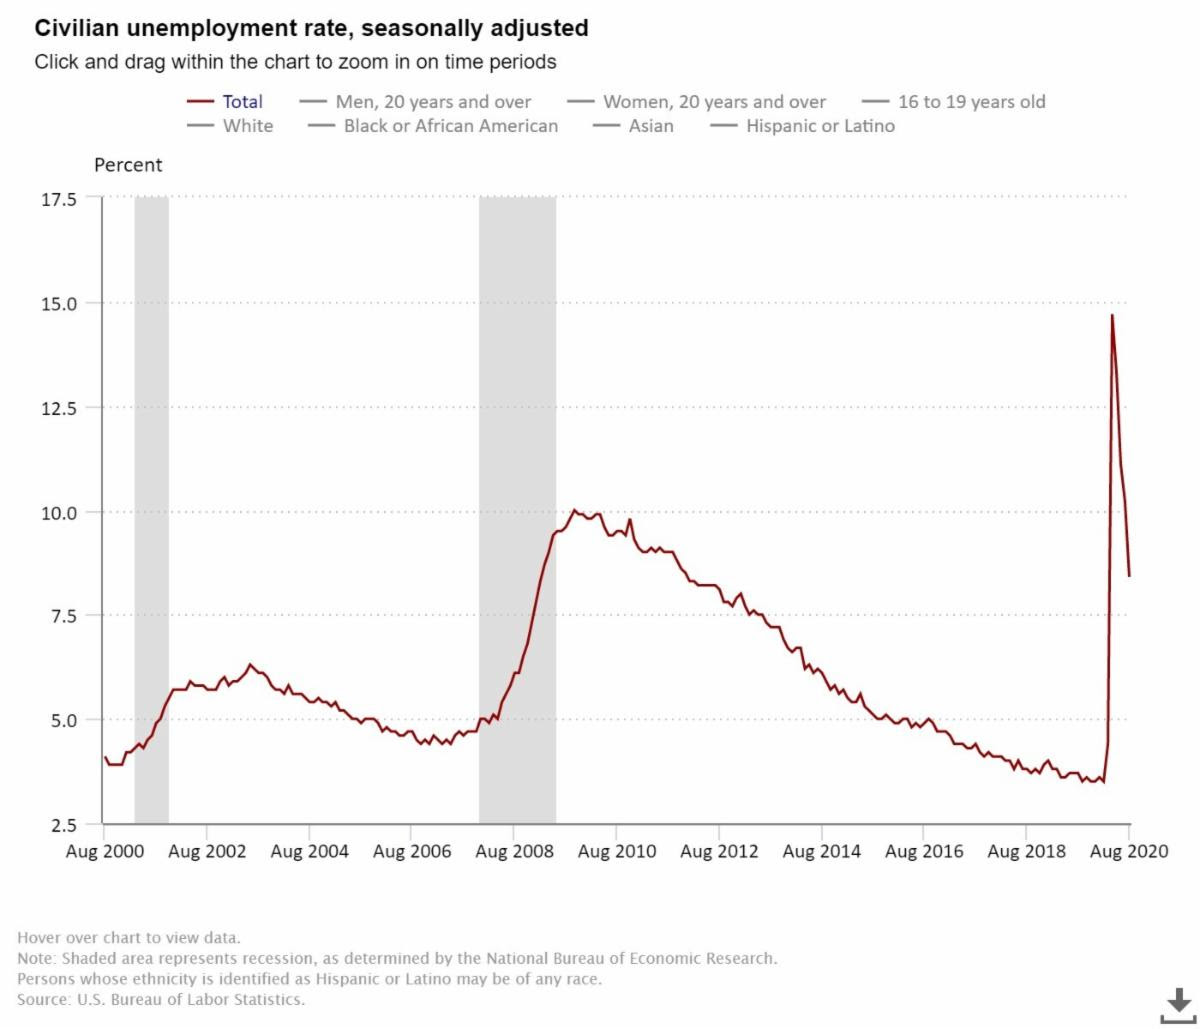
Source: U.S. Bureau of Labor Statistics
From a housing perspective, house sales have been on fire. Record-low interest rates, mortgage rates, and refinancing rates have been driving higher home purchases and rising prices. Urban flight to the suburbs has also been a big housing tailwind due to the desire for more socially distanced room, additional home office space, and expansive backyards. Adding fuel to the housing fire has been record low supply (i.e., home inventories). The robust demand is evident by the record Case-Shiller home prices (see chart below).
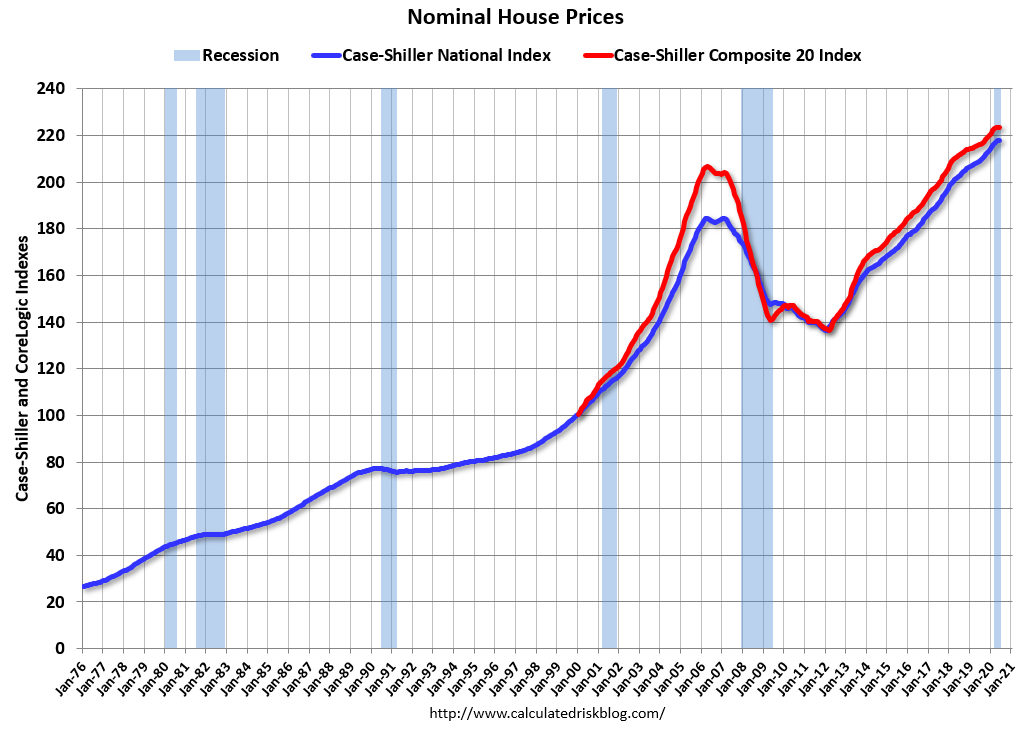
Source: Calculated Risk
There are plenty of industries hurting, including airlines, cruise lines, hotels, retailers, and restaurants but the economic rebound along with government stimulus (i.e., direct government checks and unemployment relief payments) have led to record retail sales (see chart below). Spending could cool if an additional coronavirus-related stimulus package agreement is not reached, but until the government checks stop flowing, consumers will keep spending.
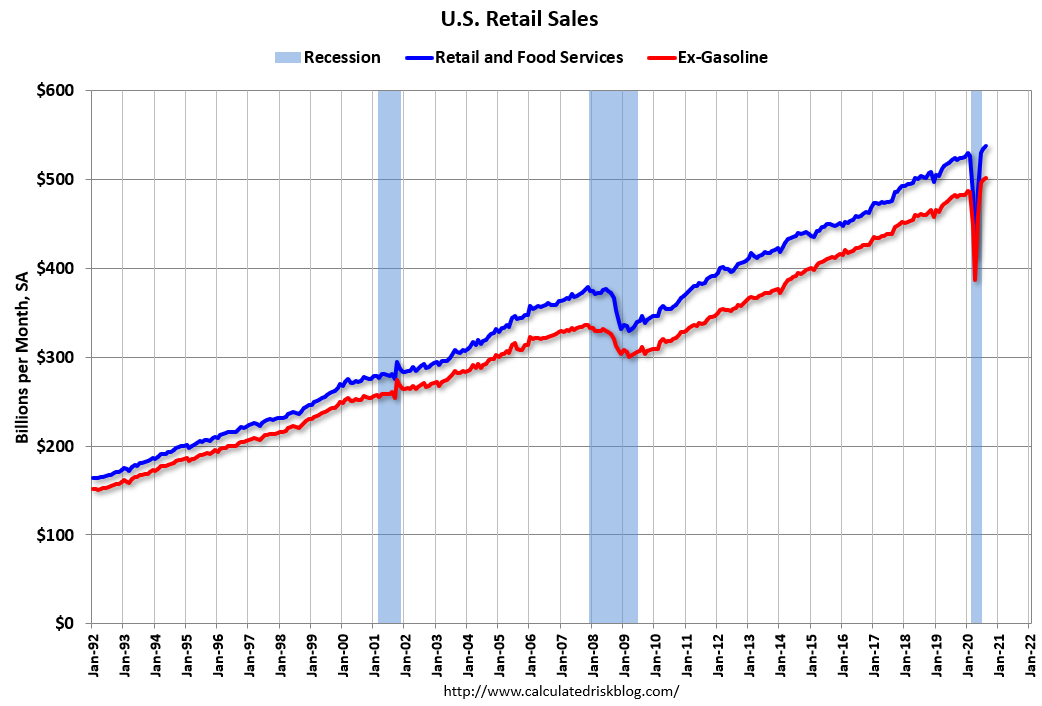
Source: Calculated Risk
Besides trillions of dollars in fiscal relief injected into the economy, the Federal Reserve has also provided trillions in unprecedented relief (see chart below) through its government and corporate bond buying programs, in addition to its Main Street Lending Program.
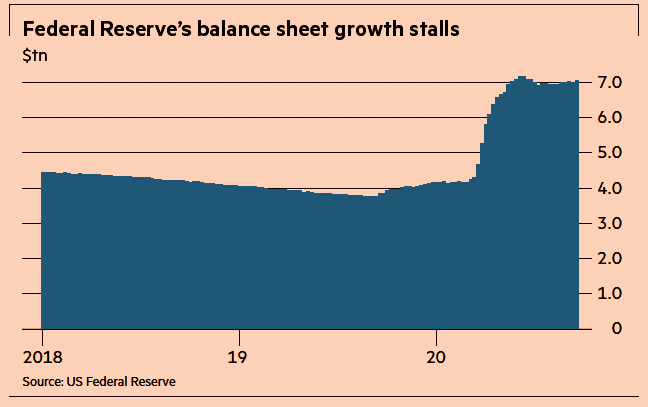
Source:The Financial Times
There has been a lot of political hocus pocus and COVID smoke & mirrors that have much of the population worried about their investments. In every presidential election, you have about half the population satisfied with the winner, and half the population disappointed in the winner…this election will be no different. The illusion of fear and chaos is bound to create some short-term financial market volatility over the next month, but behind the curtains there are numerous positive, contributing factors that are powering the economy and stock market forward. Do yourself a favor by focusing on your long-term financial future and don’t succumb to politics and COVID tricks.

Wade W. Slome, CFA, CFP®
Plan. Invest. Prosper.
This article is an excerpt from a previously released Sidoxia Capital Management complimentary newsletter (October 1, 2020). Subscribe on the right side of the page for the complete text.
DISCLOSURE: Sidoxia Capital Management (SCM) and some of its clients hold positions in certain exchange traded funds (ETFS), but at the time of publishing had no direct position in any other security referenced in this article. No information accessed through the Investing Caffeine (IC) website constitutes investment, financial, legal, tax or other advice nor is to be relied on in making an investment or other decision. Please read disclosure language on IC Contact page.
Bridge to Vaccine or Nowhere?

We are approximately eight months into a global pandemic that has infected an estimated 18 million people and taken almost 700,000 lives. Everyone is wrestling with the ripple through effects that COVID-19 has not only had on our personal lives, but also on the broader aspects of our economy, including science, politics, economics, education, mental health, food supply, and transportation. The 7.8 billion people on the planet, including investors, are waiting for a bridge to a COVID-19 vaccine cure to come as soon as possible, so people and the world can begin returning towards normalcy.
The bridge to a COVID cure is not complete yet, but investors are currently paying notice and giving researchers the benefit of the doubt. Last month, stocks continued their advance with the S&P 500 catapulting another 5.5%. Since the low in March this year, stock prices have appreciated an astounding +49%, and are actually in the black (i.e., positive) for the year despite unemployment climbing above 11% and a massive 2nd quarter economic contraction in GDP of -32.9%. Some stock enthusiasm can be attributed to forecasted 3rd quarter GDP growth of 16%. The stock market story is even brighter, if you consider the technology-heavy NASDAQ index rose +6.8% for the month, +62% from this year’s low, and +20% for 2020.
With the destruction of lives and economic activity so severe, how can stock prices be so lofty? In short, after the economy ground to a virtual halt in March, business has been slowly getting better. At the heart of this improvement, the learning curve in treating this deadly virus has slowed the bleeding of the COVID-19 disease. The progress in controlling the virus can be seen in the declining number of daily COVID-19 cases (see chart below).
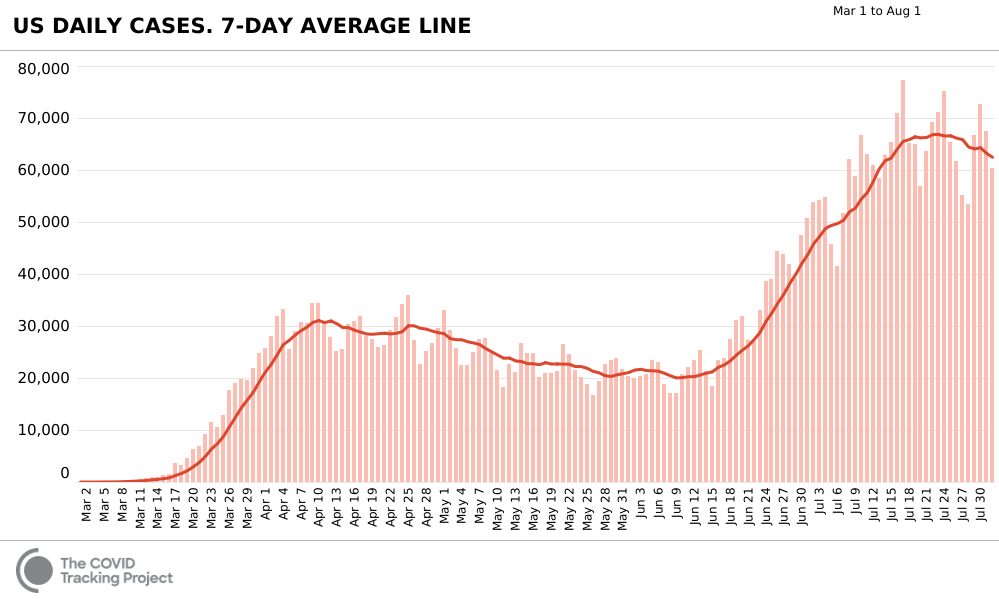
The stabilization and the beginning of a downward trend of cases can be explained with the successful application of therapeutics like remdesivir (manufactured by Gilead Sciences); generic steroids like dexamethasone; improved ventilator implementation in conjunction with blood thinners; and better compliance with social distancing/mask-wearing protocols.
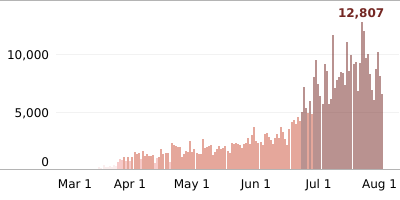
In California, we appear to be on the right path of the curve, as well. Daily infections peaked at 12,807 however, and as of August 1st, daily COVID-19 cases declined to 6,542 (see chart below).
The hospitalization picture tells a similar story (see chart below). Even though the number of daily cases more than doubled nationally to record highs, the number of people hospitalized plateaued because of better treatment and the concentration of newly infected cases in the younger demographic age level.
In addition to current trends mending, optimism for a COVID-19 vaccine cure is also building, as I alluded to earlier. Economist and blog writer Dr. Ed Yardeni summed up the research developments well.
“The Trump administration has launched “Operation Warp Speed” with the goal of delivering 300 million doses of a safe, effective vaccine for COVID-19 by January 2021, as part of a broader strategy to accelerate the development, manufacturing, and distribution of COVID-19 vaccines, therapeutics, and diagnostics. Congress has directed almost $10 billion to this effort through supplemental funding, including the CARES Act. More than 100 clinical trials of dozens of potential coronavirus treatments are already underway around the world.”
If these timelines are correct, the bridge to a cure is almost here.
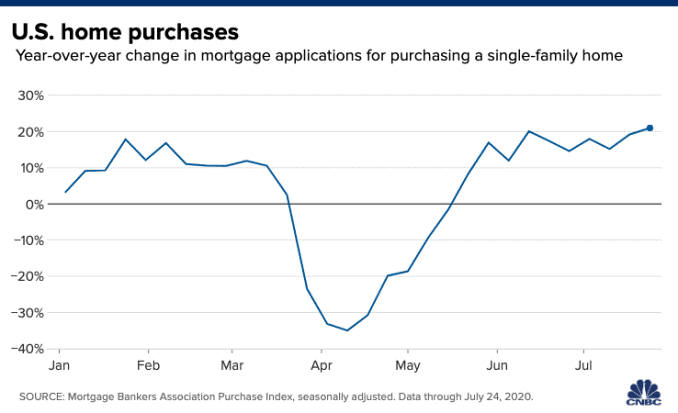
Housing Market on a Tear
One of the very positive byproducts of the pandemic has been the red-hot housing market (see chart below), which has been driven by record low interest rates and demand for COVID-friendly housing. People are migrating from tight urban quarters to the suburbs, where people can obtain a home office, a spacious backyard, and a swimming pool. This ravenous home demand is coinciding with generationally low interest rates, including a jaw-droppingly low 30-year fixed-rate mortgage hovering around 3%. All else equal, lower interest rates means consumers make lower monthly payments and can carry more debt, which improves home affordability.
Fears of a COVID Collapse
Although there have certainly been some tangible improvements since the depths of the pandemic, there are definite challenges ahead.
Consider the following challenges:
- Consequences to Unmitigated Government Spending: Congress is working to approve another $1 – $3 trillion dollar stimulus package to buttress our strained economy during the COVID-19 crisis. In the short-run, this money can provide relief to millions of people and businesses that have suffered through the global pandemic. However, in the longer term, spending cutbacks will likely be necessary. Just like somebody going on an endless credit card spending spree, eventually the money borrowed and spent needs to be paid back, or alternatively, a credit limit will ultimately be reached. Sooner or later, the trillions of dollars in spending will trigger collectors (investors) to come knocking. Under these possible scenarios, fiscal responsibility will force dramatic cuts to benefits and services like Social Security, Medicare, education, and military, among other areas.
- Rising China Tensions: It doesn’t take a genius to figure out our president’s view on China. All one needs to do is read his daily posts on Twitter. Our president’s commentary includes, but is not limited to, our massive trade deficits with China; political unrest in Hong Kong; Chinese consulate closure in Houston, Texas and American consulate closure in Chengdu, China; and blame regarding intellectual property theft and the spread of the “Wuhan” virus. These are only some of the factors contributing to the strained bilateral relationship between the United States and the #2 global economy, China.
- Presidential Election: The November 3rd presidential election date is just around the corner, and the outcome will likely create uncertainty regarding the trajectory of future U.S. tax rates and other policies.
- Burst in Tech Bubble? The top 1% of companies in the S&P 500 (Apple Inc., Microsoft Corp., Amazon.com, Alphabet Inc., Facebook Inc.) account for 22% of the value of the index, or more than $6 trillion in market value. Some observers explain this explosion in concentrated technology values by pointing a finger at the Federal Reserve’s zero-interest-rate policy and lack of government regulation, while others point to a behavioral shift in technology demand and usage.
- Potential Inflation: The inflation threat has been created by trillions of dollars in money printing policies by the Federal Reserve. But it’s not only the trillions of U.S. dollars being printed by the Fed, it’s also trillions in euros, Japanese yen, and Chinese yuan being printed by other global central banks. As a result, the danger of rampant inflation could become a reality.
The foundation may not be fully sturdy yet, but a clear bridge to a recovery is under construction, and the blueprint confirms we have the pieces needed for completion (i.e., a vaccine). As I pointed out in last month’s newsletter (Record Rebound), volatility has been a constant throughout the rebound. Given the pace and questionable sustainability of the bounce, active management is necessary. At Sidoxia Capital Management (www.Sidoxia.com), we continue to prudently manage our client portfolios with the purpose of meeting their customized objectives. Getting from here to achieving your financial goals is a serious challenge, and reaching your economic destination requires a well-designed bridge that won’t collapse.

Wade W. Slome, CFA, CFP®
Plan. Invest. Prosper.
This article is an excerpt from a previously released Sidoxia Capital Management complimentary newsletter (August 3, 2020). Subscribe on the right side of the page for the complete text.
DISCLOSURE: Sidoxia Capital Management (SCM) and some of its clients hold positions in GILD, AAPL, AMZN, GOOGL, FB, MSFT and certain exchange traded funds (ETFS), but at the time of publishing had no direct position in TWTR or any other security referenced in this article. No information accessed through the Investing Caffeine (IC) website constitutes investment, financial, legal, tax or other advice nor is to be relied on in making an investment or other decision. Please read disclosure language on IC Contact page.
Bargain Hunting for Doorbuster Discounts

This article is an excerpt from a previously released Sidoxia Capital Management complimentary newsletter (December 1, 2015). Subscribe on the right side of the page for the complete text.
It’s that time of year again when an estimated 135 million bargain shoppers set aside personal dignity and topple innocent children in the name of Black Friday holiday weekend, doorbuster discounts. Whether you are buying a new big screen television at Amazon for half-off or a new low-cost index fund, everyone appreciates a good value or bargain, which amplifies the importance of the price you pay. Even though consumers are estimated to have spent $83 billion over the post-turkey-coma, holiday weekend, this spending splurge only represents a fraction of the total 2015 holiday shopping season frenzy. When all is said and done, the average person is projected to dole out $805 for the full holiday shopping season (see chart below) – just slightly higher than the $802 spent over the same period last year.

While consumers have displayed guarded optimism in their spending plans, Americans have demonstrated the same cautiousness in their investing behavior, as evidenced by the muted 2015 stock market gains. More specifically, for the month of November, stock prices increased by +0.32% for the Dow Jones Industrial Average (17,720) and +0.05% for the S&P 500 index (2,080). For the first 11 months of the year, the stock market results do not look much different. The Dow has barely slipped by -0.58% and the S&P 500 has inched up by +1.01%.
Given all the negative headlines and geopolitical concerns swirling around, how have stock prices managed to stay afloat? In the face of significant uncertainty, here are some of the calming factors that have supported the U.S. financial markets:
- Jobs Piling Up: The slowly-but-surely expanding economy has created about 13 million new jobs since late 2009 and the unemployment rate has been chopped in half (from a peak of 10% to 5%).

Source: Calafia Beach Pundit
- Housing Recovery: New and existing home sales are recovering and home prices are approaching previous record levels, as the Case-Shiller price indices indicate below.

Source: Calculated Risk Blog
- Strong Consumer: Cars are flying off the shelves at a record annualized pace of 18 million units – a level not seen since 2000. Lower oil and gasoline prices have freed up cash for consumers to pay down debt and load up on durable goods, like some fresh new wheels.

Source: Calculated Risk Blog
Despite a number of positive factors supporting stock prices near all-time record highs and providing plenty of attractive opportunities, there are plenty of risks to consider. If you watch the alarming nightly news stories on TV or read the scary newspaper headlines, you’re more likely to think it’s Halloween season rather than Christmas season.
At the center of the recent angst are the recent coordinated terrorist attacks that took place in Paris, killing some 130 people. With ISIS (Islamic State of Iraq and Syria) claiming responsibility for the horrific acts, political and military resources have been concentrated on the ISIS occupied territories of Syria and Iraq. Although I do not want to diminish the effects of the appalling and destructive attacks in Paris, the events should be placed in proper context. This is not the first or last large terrorist attack – terrorism is here to stay. As I show in the chart below, there have been more than 200 terrorist attacks that have killed more than 10 people since the 9/11 attacks. Much of the Western military power has turned a blind eye towards these post-9/11 attacks because many of them have taken place off of U.S. or Western country soil. With the recent downing of the Russian airliner (killing all 224 passengers), coupled with the Paris terror attacks, ISIS has gained the full military attention of the French, Americans, and Russians. As a result, political willpower is gaining momentum to heighten military involvement.

Source: Wikipedia
Investor anxiety isn’t solely focused outside our borders. The never ending saga of when the Federal Reserve will initiate its first Federal Funds interest rate target increase could finally be coming to an end. According to the CME futures market, there currently is a 78% probability of a 0.25% interest rate increase on December 16th. As I have said many times before, interest rates are currently near generational lows, and the widely communicated position of Federal Reserve Chairwoman Yellen (i.e., shallow slope of future interest rate hike trajectory) means much of the initial rate increase pain has likely been anticipated already by market participants. After all, a shift in your credit card interest rate from 19.00% to 19.25% or an adjustment to your mortgage rate from 3.90% to 4.15% is unlikely to have a major effect on consumer spending. In fact, the initial rate hike may be considered a vote of confidence by Yellen to the sustainability of the current economic expansion.
Shopping Without My Rose Colored Glasses
Regardless of the state of the economic environment, proper investing should be instituted through an unemotional decision-making process, just as going shopping should be an unemotional endeavor. Price and value should be the key criteria used when buying a specific investment or holiday gift. Unfortunately for many, emotions such as greed, fear, impatience, and instant gratification overwhelm objective measurements such as price and value.
As I have noted on many occasions, over the long-run, money unemotionally moves to where it is treated best. From a long-term perspective, that has meant more capital has migrated to democratic and capitalistic countries with a strong rule of law. Closed, autocratic societies operating under corrupt regimes have been the big economic losers.
With all of that set aside, the last six years have created tremendous investment opportunities due to the extreme investor risk aversion created by the financial crisis – hence the more than tripling in U.S. stock prices since March 2009.
When comparing the yield (i.e., profit earned on an investment) between stocks and bonds, as shown in the chart below, you can see that stock investors are being treated significantly better than bond investors (6.1% vs. 4.0%). Not only are bond investors receiving a lower yield than stock investors, but bond investors also have no hope of achieving higher payouts in the future. Stocks, on the other hand, earn the opportunity of a double positive whammy. Not only are stocks currently receiving a higher yield, but stockholders could achieve a significantly higher yield in the future. For example, if S&P 500 earnings can grow at their historic rate of about 7%, then the current stock earnings yield of 6.1% would about double to 12.0% over the next decade at current prices. The inflated price and relative attractiveness of stocks looks that much better if you compare the 6.1% earnings yield to the paltry 2.2% 10-Year Treasury yield.

Source: Yardeni.com
This analysis doesn’t mean everyone should pile 100% of their portfolios into stocks, but it does show how expensively nervous investors are valuing bonds. Time horizon, risk tolerance, and diversification should always be pillars to a disciplined, systematic investment strategy, but as long as these disparities remain between the earnings yields on stocks and bonds, long-term investors should be able to shop for plenty of doorbuster discount bargain opportunities.

Wade W. Slome, CFA, CFP®
Plan. Invest. Prosper.
DISCLOSURE: Sidoxia Capital Management (SCM) and some of its clients hold positions in AMZN and certain exchange traded funds (ETFs), but at the time of publishing had no direct position in any other security referenced in this article. No information accessed through the Investing Caffeine (IC) website constitutes investment, financial, legal, tax or other advice nor is to be relied on in making an investment or other decision. Please read disclosure language on IC Contact page.
Marathon Market Gets a Cramp

This article is an excerpt from a previously released Sidoxia Capital Management complimentary newsletter (October 1, 2015). Subscribe on the right side of the page for the complete text.
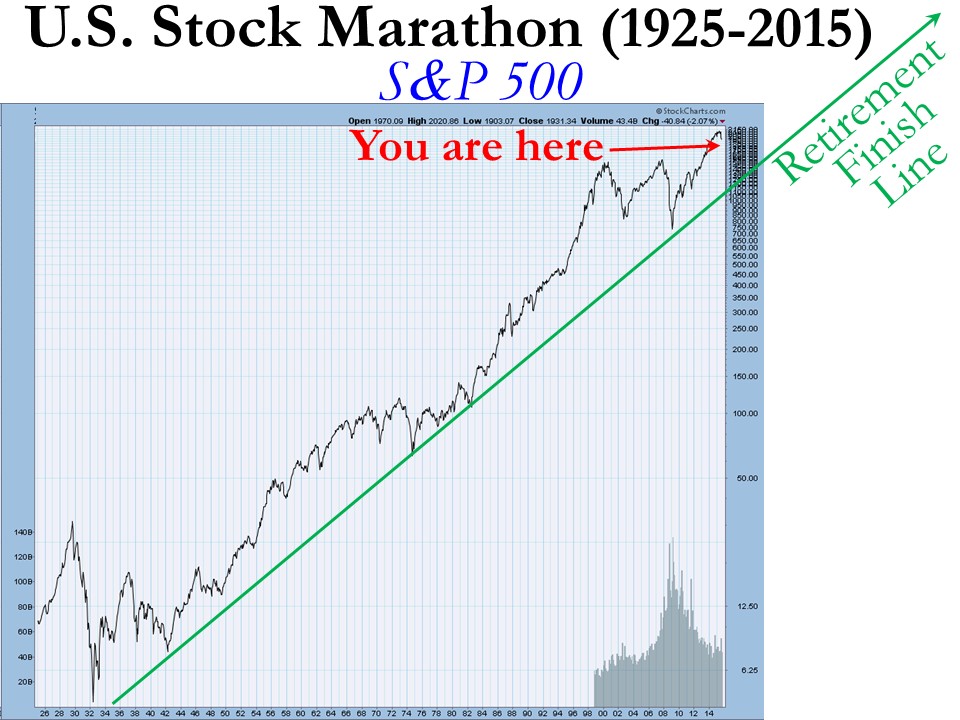
“Anyone can run a hundred meters, it’s the next forty-two thousand and two hundred that count.”
Investing is a lot like running a marathon…but it’s not a sprint to the retirement finish line. The satisfaction of achieving your long-term goal can be quite rewarding, but attaining ambitious objectives does not happen overnight. Along the hilly and winding course, there can be plenty of bumps and bruises mixed in with the elation of a runner’s high. While stocks have been running at a record pace in recent years, prices have cramped up recently as evidenced by the -2.6% decline of the S&P 500 stock index last month.
But the recent correction should be placed in the proper perspective as you approach and reach retirement. Since the end of the 2008 Financial Crisis the stock market has been racing ahead at a brisk rate, as you can see from the total return performance below (excluding 2015):
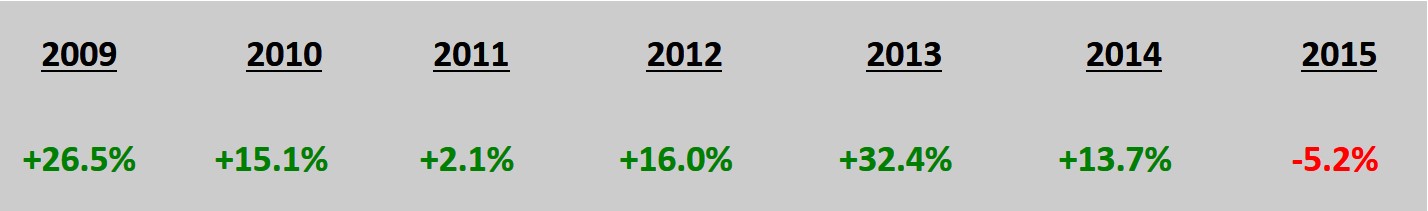
This performance is more indicative of a triumph than a catastrophe, but if you turned on the TV, listened to the radio, or surfed the web, you may come to a more frightening conclusion.
What’s behind the recent dip? These are some of the key concerns driving the recent price volatility:
- China: Slowing growth in China and collapse in Chinese stock market. China is suffering from a self-induced slowdown designed to mitigate corruption, prick the real estate bubble, and shift its export-driven economy to a more consumer-driven economy. These steps diminish short-term growth (albeit faster than U.S. growth), but nevertheless the measures should be constructive for longer-term growth.
- Interest Rates: Uncertainty surrounding the timing of a 0.25% target interest rate increase by the Federal Reserve. The move from 0% to 0.25% is like walking from the hardwood floor onto the rug…hardly noticeable. The inevitable move by the Fed has been widely communicated for months, and given where interest rates are today, the move will have a negligible impact on corporate borrowing costs. Like removing a Band-Aid, the initial action may cause some pain, but should be comfortably received shortly thereafter.
- Politics: Potential government shutdown / sequestration. The epic political saga will never end, however, as I highlighted in “Who Said Gridlock is Bad?,” political discourse in Washington has resulted in positive outcomes as it relates to our country’s fiscal situation (limited government spending and declining deficits). The government shutdown appears to have been averted for now, but it looks like we will be blanketed with brinkmanship nonsense again in a few months.
- Biotech/Pharmaceuticals: Politics over lofty drug prices and the potential impact of future regulation on the biotech sector. Given the current Congressional balance of power, any heavy-handed Democratic proposals is likely to face rigorous Republican opposition.
- Emerging Markets: Emerging market weakness, especially in Latin America (e.g., Brazil). These developments deserve close monitoring, but the growth in the three largest economic regions (U.S., Europe, and China) will have a much larger effect on the direction of global economic expansion.
- Middle East: Destabilized Middle East and Syria. Terrorist extremism and cultural animosity between various Middle East populations has existed for generations. There will be no silver bullet for a peaceful solution, so baby steps and containment are critical to maintain healthy global trade activity with minimal disruptions.
Worth noting, this current list of anxieties itemized above is completely different from six months ago (remember the Greece crisis?), and the list will change again six months into the future. Investing, like any competitive challenge, does not come easy…there is always something to worry about in the land of economics and geopolitics.
Here’s what the world’s top investor Warren Buffett said a few decades ago (1994) on the topic of politics and economics:
“We will continue to ignore political and economic forecasts which are an expensive distraction for investors and businessmen. Thirty years ago, no one could have foreseen the huge expansion of the Vietnam War, wage and price controls, two oil shocks, the resignation of a president, the dissolution of the Soviet Union, a one-day drop in the Dow of 508 points, or treasury bill yields fluctuating between 2.8% and 17.4%.”
In a world of 7.3 billion people and 196 countries there will never be a shortage of fear, uncertainty, and doubt (F.U.D.) – see events chart in The Bungee Market. In an ever-increasing, globally connected world, technology and the media continually amplify molehills into mountains, thereby making the next imagined Armageddon a simple click of a mouse or swipe of a smartphone away.
Today’s concerns are valid but in the vast majority of cases the issues are completely overblown, sensationalized and over-emphasized without context. Context is an integral part to investing, but unfortunately context usually cannot be explained in a short soundbite or headline. On the flip side, F.U.D. thrives in the realm of soundbites and headlines.
While investors may feel fatigued from a strong flow of headline headwinds, financial market race participants should take a break at the water stop to also replenish themselves with a steady tailwind of positive factors, including the following:
- Employment: The unemployment rate has been cut from a recession peak of 10.0% down to 5.1%, and the economy has been adding roughly +200,000 new monthly jobs on a fairly consistent basis. On top of that, there are a record 5.8 million job openings versus 3.7 million two years ago – a sign that the economy continues to hum along.
- Housing/Commercial Real Estate/Mortgage Rates: Housing prices have rebounded by about +30% from the 2012 lows; Housing starts have increased by +25% in the past year and 120% in the past four years; and 30-Year Fixed mortgage interest rates sit at 3.85% – a highly stimulative level within a spitting distance from record lows.
- Auto Sales: Surged to a post-recession record of 17.8 million units in August.
- Interest Rates: Massively stimulative and near generational lows, even if the Fed hikes its interest rate target by 0.25% in October, December or sometime in 2016.
- Capital Goods Orders: Up for three consecutive months.
- Rail Shipments/Truck Tonnage: Both these metrics are rising by about 3-4%.
- Retail Sales: Rising at a very respectable pace of 7% over the last six months.
- Low Energy & Commodity Prices: Inflation has remained largely in check thanks to plummeting commodity prices. Low oil and gas prices are benefiting consumers in numerous ways, including the contribution to car sales, home sales, and/or debt reduction.
While the -10% dip in stock prices from mid-August might feel like a torn knee ligament, long-term investors know -10% corrections historically occur about one-time per year, on average. So, even though you may be begging for a wheelchair, the best course of action is to take a deep breath, stick to your long-term investment plan, rebalance your portfolio if necessary, and continue staying on course towards your financial finish line.
Wade W. Slome, CFA, CFP®
Plan. Invest. Prosper.
DISCLOSURE: Sidoxia Capital Management (SCM) and some of its clients hold positions in certain exchange traded funds (ETFs) , but at the time of publishing, SCM had no direct position in any other security referenced in this article. No information accessed through the Investing Caffeine (IC) website constitutes investment, financial, legal, tax or other advice nor is to be relied on in making an investment or other decision. Please read disclosure language on IC Contact page.
Have Peripheral Colds Caused a U.S. Recession Flu?

At the trough of the recent correction, which was underscored by a brief but sharp -1,100 point drop in the Dow Jones Industrial Average, the Dow had temporarily corrected by -16.2% from its peak in May, earlier this year. Whether we retest or break below the 15,370 level again is debatable, but with the Dow almost reaching “bear market” (-20%) territory, it begs the question of whether the U.S. has caught a recessionary flu from the ill international markets’ colds?
Certainly, several factors have investors concerned about a potential recession, including the following: slowing growth and financial market instability in China; contraction of -0.4% in Japan’s Q2 GDP growth; and turmoil in emerging markets like Russia and Brazil. With stock prices down more than double digits, it appears investors factored in a significant chance of a recession occurring. Although the Tech Bubble of 2000 and generational Great Recession of 2008-2009 were no ordinary recessions, your more garden variety recessions like the 1980 and 1990 recessions resulted in peak to trough declines in the Dow Jones Industrial Average of -20.5% and -22.5%, respectively.
In other words, with the Dow recently down -16.2% in three months, investors were awfully close to factoring in a full blown U.S. recession. Should this be the case? In answering this question, one must certainly understand the stock market is a predicting or discounting mechanism. However, if we pull out our economic thermometers, right now there are no definitive indicators sending us to the recessionary doctor’s office. Here are a number of the indicators to review.
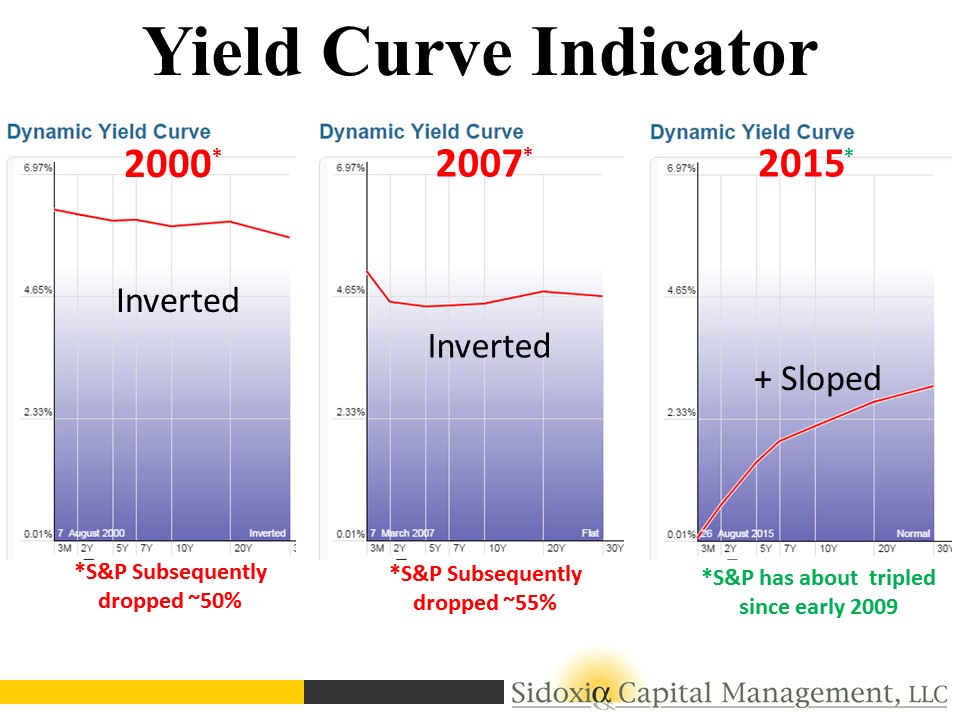
Yield Curve Indicator
For starters, let’s take a look at the yield curve. Traditionally, in a normally expanding economy, we would normally expect inflationary expectations and a term premium for holding longer maturity bonds to equate to a positively shaped yield curve (e.g., shorter term 2-Year Treasuries with interest rates lower than 30-Year Treasuries). Interestingly, historically an inverted yield curve (shorter term interest rates are higher than longer term rates) has been an excellent leading indicator and warning signal for unhealthy stock market conditions forthcoming.
As you can see in the charts below, before the two preceding recessions, in the years 2000 and 2007, we experienced an inverted yield curve that served as a tremendous warning signal in advance of significant downdrafts in stock prices. If you fast forward to today, the slope of the yield curve is fairly steeply sloped – nowhere close to inverted. When the yield curve flattens meaningfully, I will become much more cautious.
The Oil Price Indicator
There is substantial interest and focus on the recessionary conditions in the energy sector, and more specifically the high yield (junk bond) issuers that could suffer. It is true that high yield energy credit spreads have widened, but typically this sector’s pain has been the economy’s gain, and vice versa. The chart below shows that the gray shaded recessionary time periods have classically been preceded by spikes upward in oil prices. As you know, we currently are experiencing the opposite trend. Over the last 12 months, WTI oil prices have been chopped by more than half to $45 per barrel. This is effectively a massive tax for consumers, which should help support the economy.
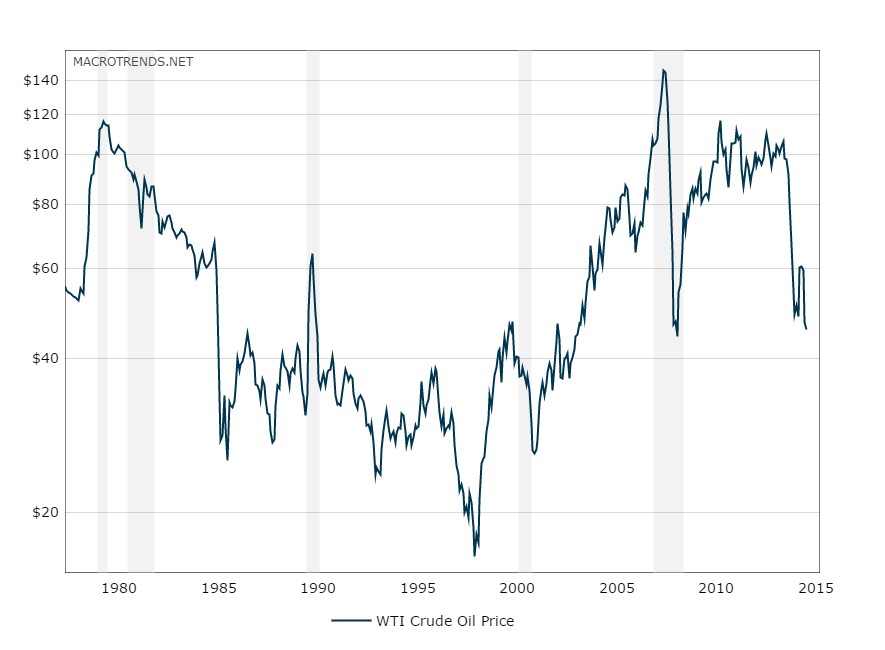
Source: MacroTrends.Net
Other Macro Statistics
Toward the top of any recession-causing, fear factor list right now is China. Slowing economic growth and an unstable Shanghai stock market has investors nervously biting their nails. Although China is the 2nd largest global economy behind the U.S., China still only accounts for about 15% of overall global economic activity, and U.S. exports to the region only account for about 0.7% of our GDP, according to veteran Value investor Bill Nygren. If on top of the China concern you layer a fairly strong U.S. labor market, an improving housing market (albeit slowly), and a recently revised higher GDP statistics, you could probably agree the economic dashboard is not signaling bright red flashing lights.
There is never a shortage of concerns to worry about, including most recently the slowing growth and stock market turbulence in China. While volatility may be implying sickness and international markets may be reaching for the Kleenex box, the yield curve, oil prices, and other macroeconomic indicators are signaling the outlook for U.S. stock remains relatively healthy.
Wade W. Slome, CFA, CFP®
Plan. Invest. Prosper.
DISCLOSURE: Sidoxia Capital Management (SCM) and some of its clients hold positions in certain exchange traded funds (ETFs) , but at the time of publishing, SCM had no direct position in any other security referenced in this article. No information accessed through the Investing Caffeine (IC) website constitutes investment, financial, legal, tax or other advice nor is to be relied on in making an investment or other decision. Please read disclosure language on IC Contact page.
Day Trading Your House

By several measures, this economic recovery has been the slowest, most-challenging expansion since World War II. Offsetting the painfully slow recovery has been a massive bull market in stocks, now hovering near all-time record highs, after about tripling in value since early 2009. Unfortunately, many investors have missed the boat (see Markets Soar – Investors Snore and Gallup Survey) with stock ownership near a 15-year low.
But it’s not too late for the “sideliners” to get in…is it? (see Get out of Stocks!*). Milfred and Buford are asking themselves that same question (see Investor Wake-Up Call). Milfred and Buford are like many other individuals searching for the American Dream and are looking for ways to pad their retirement nest egg. The seasoned couple has been around the block a few times and are somewhat familiar with one get-rich-quick strategy…day trading stocks. Thankfully, they learned that day trading stocks didn’t work out too well once the technology boom music ended in the late 1990s. Here’s what the SEC has to say about day trading on their government site:
Be prepared to suffer severe financial losses. Day traders typically suffer severe financial losses in their first months of trading, and many never graduate to profit-making status. Given these outcomes, it’s clear: day traders should only risk money they can afford to lose. They should never use money they will need for daily living expenses, retirement, take out a second mortgage, or use their student loan money for day trading.
Milfred & Buford Day Trade House
Milfred: “Now, Buford, I know we lost of our IRA retirement money day trading tech stocks, but if technical analysis works and all the financial news shows and talking babies on TV say it will make us a lot of cabbage, maybe we should try day trading our house?”
Buford: “Now I know why I married you 60 years ago – it’s that brilliant mind of yours that complements that sexy figure!”
Veteran readers of Investing Caffeine know I’ve been a skeptic of technical analysis (see Technical Analysis: Astrology or Lob Wedge), but a successful investor has to be open to new ideas, correct? So, if technical analysis works for stocks, then why not for houses? The recovery in housing prices hasn’t been nearly as robust as we’ve seen in stocks, so perhaps there’s more upside in housing. If I can get free stock charting technicals from my brokerage firm or online, there’s no reason I couldn’t access free charting technicals from Zillow (or Trulia) to make my fortunes. Case in point, I think I see a double-bottom and reverse head-and-shoulders pattern on the home price chart of Kim Kardashian’s house:
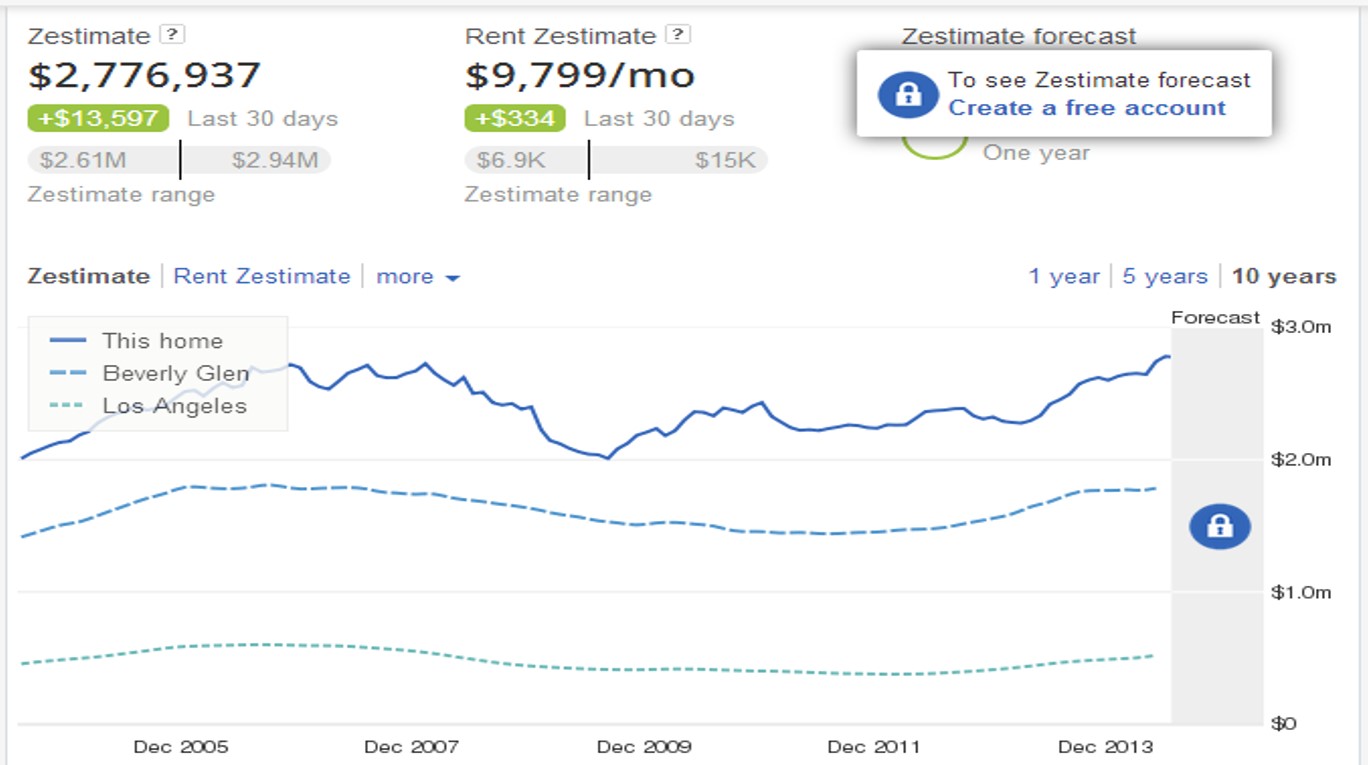
Source: Zillow
Of course, day trading isn’t solely dependent on random chart part patterns. Pundits, bloggers, and brokerage firms would also have you believe instant profits are attainable by trading based on the flow of news headlines. This is how Milfred and Buford would make their millions:
Milfred: “Snookums, it’s time for you to pack up all our stuff.”
Buford: “Huh? What are you talking about honey buns?”
Milfred: “Didn’t you see?! The University of Michigan consumer confidence index fell to a level of 81.3 vs. Wall street estimates of 83.0, bringing this measure to a new 4-month low.”
Buford: “I can’t believe I missed that. Nice catch ‘hun’. I’ll start packing, but where will we stay after we sell the house?”
Milfred: “We can hang out at the Motel 6, but it shouldn’t be long. I’m expecting the Philly Fed Manufacturing index to come in above 23 and I also expect a cease fire in Ukraine and Gaza. We can buy a new house then.”
I obviously frame this example very tongue-in-cheek, but buying and selling a house based on squiggly lines and ever-changing news headlines is as ridiculous as it sounds for trading stocks. The basis for any asset purchase or sale should be primarily based on the cash flow dynamics (e.g., rent, dividends, interest, etc., if there are any) of the asset, coupled with the appreciation/depreciation expectations based on a rigorous long-term analysis.
When Day Trading Works
Obviously there are some differences between real estate and stocks (see Stocks & Real Estate), including the practical utility of real estate and other subjective factors (i.e., proximity to family, schools, restaurants, beach, crime rates, etc.). Real estate is also a relatively illiquid and expensive asset to buy or sell compared to stocks. – However, that dynamic is rapidly changing. Like we witness in stocks, technology and the internet is making real estate cheaper and easier to match buyers and sellers.
Does day trading a stock ever work? Sure, even after excluding the factor of luck, having a fundamental information advantage can lead to immediate profits, but one must be careful how they capture the information. Raj Rajaratnam used this strategy but suffered the consequences of his insider trading conviction. Furthermore, the information advantage game can be expensive, as proven by Steven Cohen’s agreement to pay $1.2 billion to settle criminal charges. While I remain a day trading and technical analysis skeptic, I have noted a few instances when I use it.
Whatever your views are on the topics of day trading and technical analysis, do Milfred and Buford a favor by leading by example…invest for the long-term.
Wade W. Slome, CFA, CFP®
Plan. Invest. Prosper.
DISCLOSURE: Sidoxia Capital Management (SCM) and some of its clients hold long positions in certain exchange traded funds, but at the time of publishing SCM had no direct position in Z, TRLA, or any other security referenced in this article. No information accessed through the Investing Caffeine (IC) website constitutes investment, financial, legal, tax or other advice nor is to be relied on in making an investment or other decision. Please read disclosure language on IC Contact page.
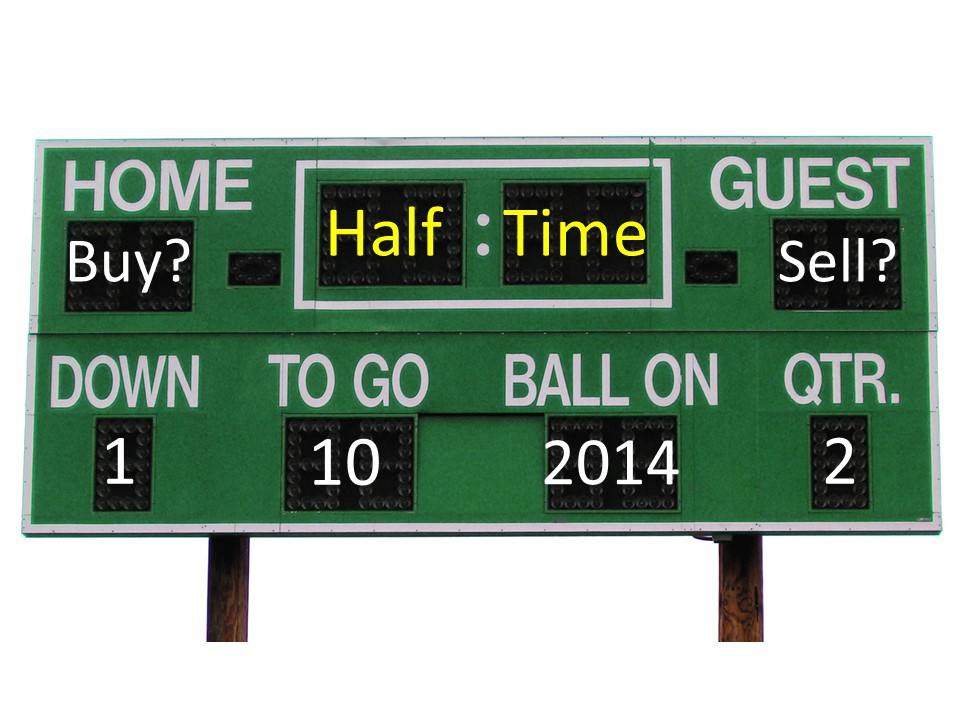
Winning via Halftime Adjustments
This article is an excerpt from a previously released Sidoxia Capital Management complementary newsletter (July 1, 2014). Subscribe on the right side of the page for the complete text.
In the game of sports and investing there are a lot of unanticipated dynamics that occur during the course of a game, season, or year. With the second quarter of 2014 now coming to a close, we have reached the half-way point of the year. Along the way, the coach (and investors) may need to make some strategic halftime adjustments. Reassessing or reflecting on the positioning of your investment portfolio once or twice per year in the context of your investment objectives, time horizon, and risk tolerance level is never a bad idea – especially when there are unforeseen events continually materializing during the game.
During the first half of the year, the financial markets have experienced numerous surprises:
- Declining Interest Rates: Under the auspices of a massive 2013 gain in stock prices, expectations were for an accelerating economy and rising interest rates in 2014. Instead, the 10-Year Treasury Note has seen its yield counterintuitively plunge from 3.03% to 2.52%.
- Geopolitical Tensions (Ukraine/Syria/Iraq): The stock market has ground higher this year in spite of geopolitical tensions in Ukraine, Syria, and now Iraq. These skirmishes make for great TV, radio, and blog content, but the reality is these conflicts will likely be forgotten/ignored in favor of other fresher clashes in the coming months and quarters.
- Unabated Tapering: It’s true the Federal Reserve signaled the reduction in its bond buying stimulus program last year, however the more surprising aspect has been the pace of the taper. From the beginning of the year, the $85 billion program has already been reduced to $35 billion and will likely be reduced to $0 by the fall.
- Polar Vortex/GDP: Weather is very unpredictable, and regardless of your views on global warming, the unseasonably cold weather on the eastern half of the country had a severely negative impact on first half GDP (Gross Domestic Product). In fact, first quarter GDP was revised lower to a contraction of -2.9%. The good news is expectations are for an improved second half of the year according to Merrill Lynch.
While it would be wonderful to live in Utopia, unfortunately for investors, there is always uncertainty and risk. These elements come with the investing territory. Of course, you can always compensate for that unwanted uncertainty by accepting low interest-paying options (e.g., stuffing your money under a mattress, in a CD, savings account, Treasury bonds, etc.).
Despite the unexpected first half events, the market continues to grind higher. During the first half of the year, the S&P 500 index rose 6.1% (+1.9% in June); the Dow Jones Industrials edged higher by +1.5% (+0.7% in June); and the Nasdaq climbed +5.5% (+3.9% in June). But stocks weren’t the only winning investment team in town – bonds tasted victory during the first half also, notching gains of +2.8% (AGG – Aggregate Bond), almost double the Dow’s performance.
Investor Psyche Pendulum Swinging in Positive Direction

As I have written in the past, investor psyches continually swing along an emotional pendulum (see also Sentiment Pendulum article) from a state of “Panic” to “Euphoria”. While the pendulum has clearly swung in a positive direction, away from the emotional states of “Panic & Fear,” we appear to now be between “Skepticism & Hope.” The timing of when we get to the latter stages of “Optimism & Euphoria” is dependent on the pace of the economic recovery, risk appetites of consumers/businesses, and the trajectory of risky assets like stocks. Just because the ride has been fun for the last five years, does not mean the ride is over. However, as the pendulum continues to swing to the left, long-term investors need to fight the tempting urge to increase risk appetite just as the allure of high stock returns appears more achievable.
During the second half of this economic cycle, before the next recession, investors need to be more cognizant of controlling risk (the probability of permanent losses) by paying closer attention to valuations, diversification, and rebalancing too heavily weighted equity portfolios.
Besides rising stock prices and the beginning of positive fund flows, investors’ increasing appetite for risk is evidenced by the yield chasing occurring in junk bonds, which has raised prices of the lowest quality bonds to lofty levels. The chart below shows this phenomenon happening with the yields narrowing between high yield (HY) bonds and investment grade (IG) corporate bonds.
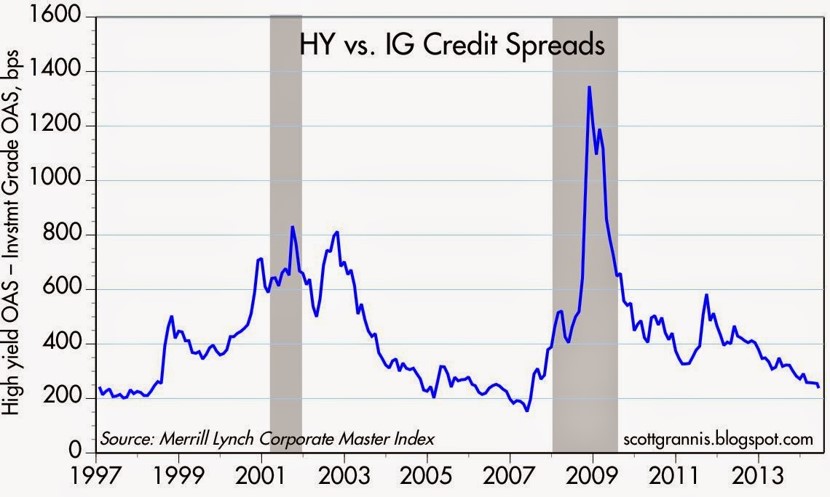
Source: Calafia Beach Pundit
Even though I pointed out a number of disconcerting surprises in the first half of the year, as you consider making halftime adjustments to your portfolios, do not forget some of the underlying positive currents that are leading to a winning halftime score.
Here are some of the constructive factors supporting stock prices, which have nearly tripled in value from the 2009 lows (S&P 500 – 666 to 1,960):
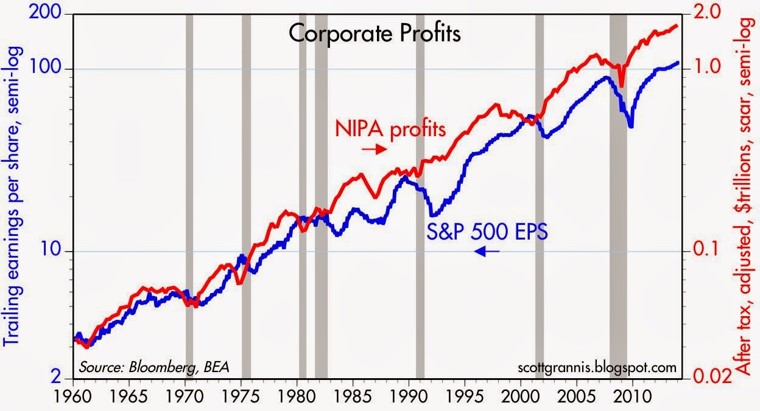
Record Corporate Profits: I constantly bump into skeptics who fail to realize the fundamental power of record profits driving stock prices higher (see chart below). As the late John Templeton stated, “In the long run, the stock market indexes fluctuate around the long-term upward trend of earnings per share.”
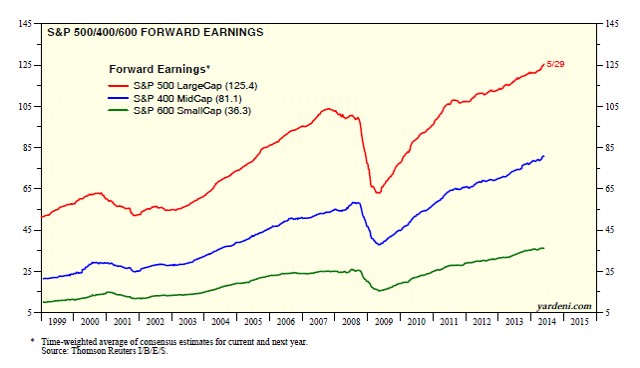
Source: Dr. Ed’s Blog
Improving Consumer Confidence: The University of Michigan consumer sentiment index increased to 82.5 for June from May. The confidence score came in above the consensus forecast of 82.0. Confidence has increased significantly from the 2009 lows but as the chart below shows, there is plenty of room for this metric to advance – consistent with the emotion pendulum discussed previously.
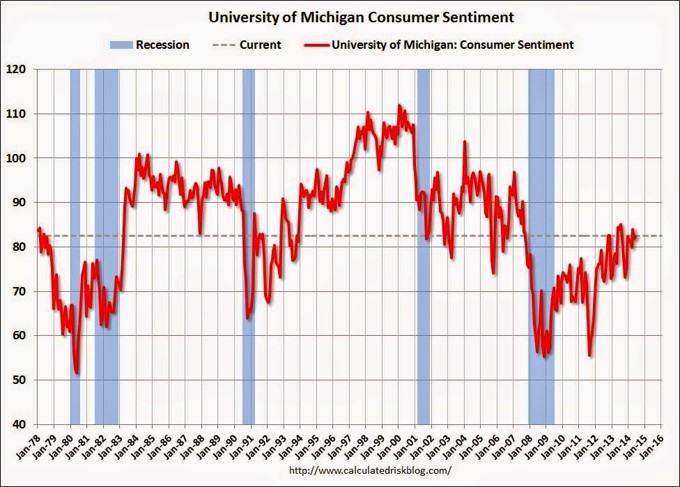
Source: Calculated Risk
Dividends & Share Buybacks Near Record Levels: A bird in the hand is worth two in the bush. Corporations have realized this investor desire and as a result companies are returning record levels of money (“capital”) to stock shareholders via increasing dividends and share buybacks (see chart below).
Source: Dr. Ed’s Blog
Housing on the Mend: The housing market has improved in fits and starts, but the most recent data point of new home sales shows significant improvement. More specifically, May’s new home sales were up +18.6% from the previous month (see chart below), the highest level seen since 2008. Although this data is encouraging, there is still plenty of room for improvement, as current sales remain more than 50% below 2005 peak levels.
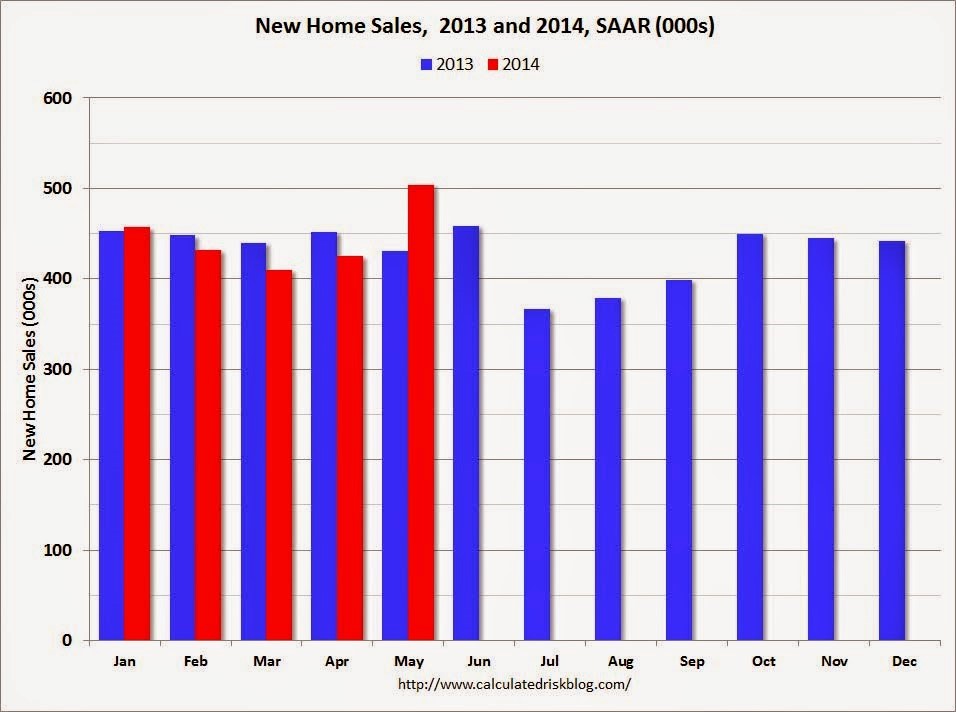
Source: Calculated Risk
Record Industrial Production: Adding support to the improving economic outlook are the industrial production figures, which also hit a record (see chart below). This data also adds credence to why the U.S. stock market has outperformed the European markets during the economic recovery from 2009.
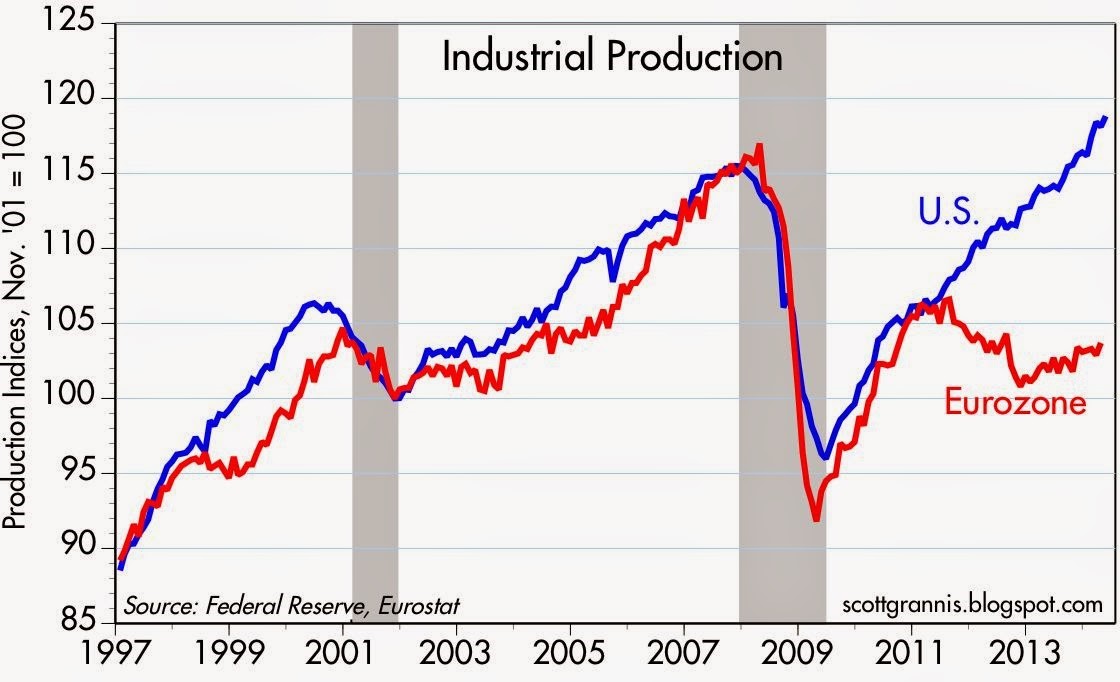
Source: Calafia Beach Pundit
Declining Federal Deficit: The federal deficit continues to narrow (i.e., tax revenues growing faster than government spending), so previous fiscally panicked screams have quieted down. We’re not out of the woods yet, but the trends are encouraging (see chart below):
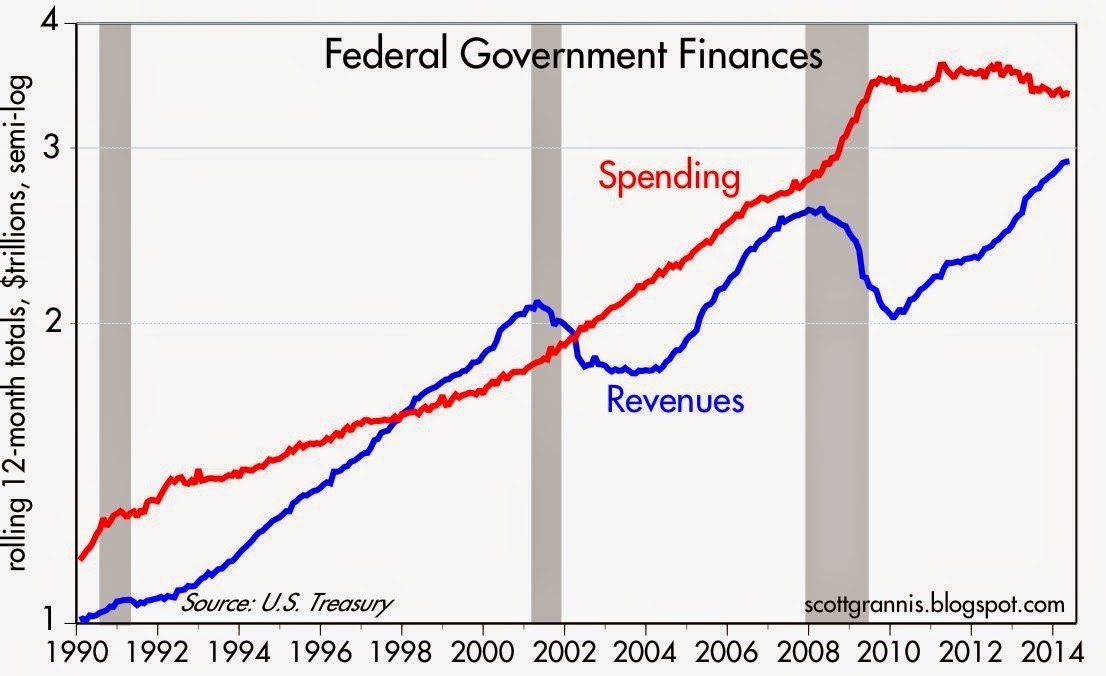
Source: Calafia Beach Pundit
There have been plenty of bombshells during the first half of 2014 (no pun intended), and there are bound to be plenty more during the second half of the year. By definition, nobody can be fully prepared for a surprise, or else it wouldn’t be called a “surprise”. For those skeptical investors sitting on the sidelines, the record breaking stock market performance has also been astonishing. Regardless of what happens over the next six months, periodically making adjustments to your financial plan is important, whether it’s during the pre-game, post-game, or halftime. And if you’re not interested or capable of making those adjustments yourself, find a professional advisor/coach to assist you.
Wade W. Slome, CFA, CFP®
Plan. Invest. Prosper.
DISCLOSURE: Sidoxia Capital Management (SCM) and some of its clients hold long positions in certain exchange traded funds and AGG, but at the time of publishing SCM had no direct position in any other security referenced in this article. No information accessed through the Investing Caffeine (IC) website constitutes investment, financial, legal, tax or other advice nor is to be relied on in making an investment or other decision. Please read disclosure language on IC Contact page.
The Treadmill Market – Jogging in Place

This article is an excerpt from a previously released Sidoxia Capital Management complementary newsletter (April 1, 2014). Subscribe on the right side of the page for the complete text.
After the stock market raced ahead to about a +30% gain last year, it became clear this meteoric trend was not sustainable into perpetuity. Correct investing should be treated more like a marathon than a sprint. After dashing ahead by more than +100% over the last handful of years, 2014 stock prices took a breather by spending the first quarter jogging in place. Like a runner on the treadmill, year-to-date returns equated to a -0.7% for the Dow Jones Industrial Average index, and +1.3% for the S&P index. Digesting the large gains from previous years, despite making no discernable forward progress this quarter, is a healthy exercise that builds long-term portfolio endurance. As far as I’m concerned, nothing in life worthwhile comes easy, and the first three months of the year have demonstrated this principle.
As I’ve written in the past (see Series of Unfortunate Events), there is never a shortage of issues to worry about. The first few months of 2014 have been no exception. Vladimir Putin’s strong armed military backed takeover of Crimea, coupled with the Federal Reserve’s unwinding $30 billion of the $85 billion of its “Quantitative Easing” bond buying program (i.e. tapering) have contributed to investors’ nervousness. When the “Fairy Godmother of the Bull Market,” Federal Reserve Chair Janet Yellen, hinted at potentially raising interest rates in about 12 months, the mood soured further.
The unseasonably cold winter back east (a.k.a., Polar Vortex) has caused some additional jitters due to the dampening effects on economic conditions. More specifically, economic growth as measured by GDP (Gross Domestic Product) is expected to come in around a meager +2.0% rate during the first quarter of 2014, before picking up later in the year.
And if that isn’t enough, best-selling author Michael Lewis, whose books include Money Ball, The Blind Side, and Liar’s Poker, just came out on national television and sparked a debate with his controversial statement that the “stock market is rigged.” (read and listen more here)
Runners High
But as always, not everything is gloom and doom. Offsetting the temporary price fatigue, resilient record corporate profits have supported the surprising market stamina. Like a runner’s high, corporations are feeling elated about historically elevated profit margins. As you can see from the chart below, the reason it’s prudent for most to have some U.S. equity exposure is due to the clear, upward multi-decade trend of U.S. corporate earnings.
Source: Calafia Beach Plundit (gray areas are recessions)
While the skeptics wait for these game-ending dynamics to take root, core economic fundamentals in areas like these remain strong:I didn’t invent the idea of profits impacting the stock market, but the concept is simple: stock prices generally follow earnings over long periods of time (see It’s the Earnings, Stupid). In other words, as profits accelerate, so do stock prices – and the opposite holds true (decelerating earnings leads to price declines). This direct relationship normally holds over the long-run as long as the following conditions are not in place: 1) valuations are stretched; 2) a recession is imminent; and/or 3) interest rates are spiking. Fortunately for long-term investors, there is no compelling evidence of these factors currently in place.
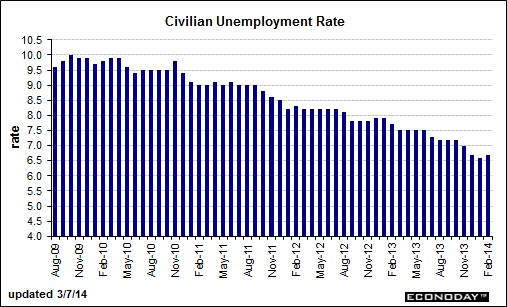
Employment Adrenaline
The employment outlook received a boost of adrenaline last month. Despite the slight upward nudge in the unemployment rate to 6.7%, total nonfarm payroll jobs increased by +175,000 in February versus a +129,000 gain in January and an +84,000 gain in December. Not only was last month’s increase better than expectations, but the net figures calculated over the previous two months were also revised higher by +25,000 jobs. As you can see below, the improvement since 2009 has been fairly steady, but as the current rate flirts with the Fed’s 6.5% target, Chair Yellen has decided to remove the quantitative objective. The rising number of discouraged workers (i.e., voluntarily opt-out of job searching) and part-timers has distorted the numbers, rendering arbitrary numeric targets less useful.
Source: Barron’s Online
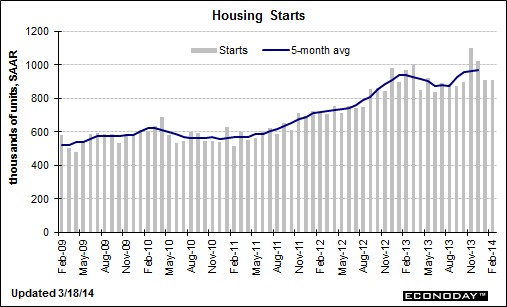
Housing Holding Strong
In the face of the severe winter weather, the feisty housing market remains near multi-year highs as shown in the 5-month moving average housing start figure below. With the spring selling season upon us, we should be able to better gauge the impact of cold weather and higher mortgage rates on the housing market.
Source: Barron’s Online
Even though stock market investors found themselves jogging in place during the first quarter of the year, long-term investors are building up endurance as corporate profits and the economy continue to consistently grow in the background. Successful investors must realize stock prices cannot sustainably sprint for long periods of time without eventually hitting a wall and collapsing. Those who recognize investing as a marathon sport, rather than a mad dash, will be able to jump off the treadmill and ultimately reach their financial finish line.
Wade W. Slome, CFA, CFP®
Plan. Invest. Prosper.
DISCLOSURE: Sidoxia Capital Management (SCM) and some of its clients hold long positions in certain exchange traded funds (ETFs), but at the time of publishing SCM had no direct position in any other security referenced in this article. No information accessed through the Investing Caffeine (IC) website constitutes investment, financial, legal, tax or other advice nor is to be relied on in making an investment or other decision. Please read disclosure language on IC Contact page.
Investing, Housing, and Speculating

We all know there was a lot of speculation going on in the housing market during 2005-2007 as risk-loving adventurists loaded up on NINJA loans (No Income, No Job, and No Assets) and subprime CDS (Credit Default Swap) securities. But there is a different kind of speculation going on now, and it isn’t tied directly to housing. Instead of buying a house with no down payment and a no interest loan, speculators are leaping into other hazardous areas of danger. Like a frog jumping from lily pad to lily pad, speculators are now hopping around onto money-chasing industries, including biotech, social media, Bitcoin, and alternative energy.
As French novelist Jean-Baptise Alphonse Karr noted, “The more things change, the more they stay the same.” Irrespective of the painful consequences of the bubble-bursting aftermaths, human behavior and psychology addictively succumb to the ever-seductive emotion of greed. Over the last 15 years, massive fortunes have been gained and lost while chasing frothy financial dreams in areas like technology, housing, and gold.
Most get-rich-quick dream chasers have no idea of how to invest in or value a stock, but they sure know a good story when they hear one. Chasing top performing stocks is lot like jumping off a bridge – anyone can do it, and it feels exhilarating until you hit the ground. However, there is a better way to create wealth. Despite rampant speculation, most individuals understand the principles behind buying a house, which if applied to stocks, can make you a superior investor, and assist you in avoiding dangerous, speculative investments.
Here are some valuable housing insights to improve your stock buying:
#1.) Price is the Almighty Variable: Successful real estate investors don’t make their fortunes by chasing properties that double or triple in value. Buying a rusty tool shed for $1 million makes about as much sense as Facebook paying $19 billion (1,000 x’s the estimated 2013 annual revenues) for a money-losing company, WhatsApp. Better to buy real estate when there is blood in the street. Like the stock market, housing is cyclical. Many traders believe that price patterns are more important than the actual price. If squiggly, technical price moving averages (see Technical Analysis article) make so much money for stock-renting speculators, then how come day traders haven’t used their same crossing-lines and Point & Figure software in the housing market? Yes, it’s true that the real estate transactions costs and illiquidity can be costly for real estate buyers, but 6% load fees, lockup periods, 20% hedge fund fees, and 9% margin rates haven’t stopped stock speculators either.
#2). Cash is King: It doesn’t take a genius to purchase a rental property – I know because practically half the people I know in Southern California own rental properties. For example, if I buy a rental property for $1 million cash, is it a good purchase? Well, it depends on how much after-tax cash I can collect by renting it out? If I can only net $3,000 per month (3.6% annualized return), and be responsible for replacing roofs, fixing toilets, and evicting tenants, then perhaps I would be better off by collecting 6.5% from a low-cost, tax-efficient exchange traded real estate fund, without having to suffer from all the headaches that physical real estate investing brings. Forecasting future asset price appreciation is tougher, but the point is, understanding the underlying cash flow dynamics of a company is just as important as it is for housing purchases.
#3). Debt/Leverage Cuts in Both Directions: Adding debt (or leverage) to a housing or stock investment can be fantastic if prices go up, and disastrous if prices go down. Putting a 20% down payment on a $1 million house works out wonderfully, if the price of the house increases to $1.2 million. My $200,000 down payment is now worth $400,000, or up +100%. The same math works in reverse. If the price of the home drops to $800,000, then my $200,000 down payment is now worth $0, or down -100% (ouch). Margin debt on an equity brokerage account works in a similar fashion, but usually a 50% down payment is needed (less risky than real estate). That’s why I always chuckle when many real estate investors tell me they steer clear of stocks because they are “too risky”.
#4). Growth Matters: If you buy a home for $1 million, is it likely to be worth more if you add a kitchen, tennis court, swimming pull, third floor, and putting green? In short, the answer is yes. The same principle applies to stocks. All else equal, if a company based in Los Angeles, establishes new offices in New York, London, Beijing, and Rio de Janeiro, and then acquires a profitable competitor at a discounted price, chances are the company will be much more valuable after the additions. The key concept here is that asset values are not static. Asset valuations are impacted in both directions, whether we are talking about positive growth opportunities or negative disruptions.
Overall, speculatively chasing performance is tempting, but if you don’t want your financial foundation to crumble, then build your successful investment future by sticking to the fundamentals and financial basics.
Wade W. Slome, CFA, CFP®
Plan. Invest. Prosper.
DISCLOSURE: Sidoxia Capital Management (SCM) and some of its clients hold long positions in certain exchange traded funds (ETFs), but at the time of publishing SCM had no direct discretionary position in FB, Bitcoin, or any other security referenced in this article. No information accessed through the Investing Caffeine (IC) website constitutes investment, financial, legal, tax or other advice nor is to be relied on in making an investment or other decision. Please read disclosure language on IC Contact page.


