Posts tagged ‘financial analysis’
Energizer Market… Keeps Going and Going

This article is an excerpt from a previously released Sidoxia Capital Management complimentary newsletter (May 2, 2016). Subscribe on the right side of the page for the complete text.
Boom, boom, boom…it keeps going…and going…and going…
You’ve seen the commercials: A device operating on inferior batteries dies just as a drum-beating, battery operated Energizer bunny comes speeding and spiraling across the television screen. Onlookers waiting for the battery operated toy to run out of juice, instead gaze in amazement as they watch the energized bunny keep going and going. The same phenomenon is occurring in the stock market, as many observers eagerly await for stock prices to die. The obituary of the stock market has been written many times over the last eight years (see Series of Unfortunate Events). Mark Twain summed up this sentiment well, when after a premature obituary was written about him, he quipped, “The reports of my death are greatly exaggerated.”
With fears abound, stocks added to their annual gains by finishing their third consecutive positive month with the S&P 500 indexes and Dow Jones Industrial Average advancing +0.5% and +0.3%, respectively. Skeptics and worry-warts have been concerned about stocks plummeting ever since the Financial Crisis of 2008-2009. We experienced a 100 year flood then, and as a consequence, scarred investors now expect the 100 year flood to repeat every 100 days (see also 100 Year Flood). Given the damage created in the wake of the “Great Recession,” many individuals have become afraid of their own shadow. The shadows currently scaring investors include the following:
- Negative Interest Rates: The unknown consequences of negative interest rate policies by central banks (see chart below).
- U.S. Monetary Policy: The potential continuation of the Federal Reserve hiking interest rates.
- Sluggish Economic Growth: With a GDP growth figure up only +0.5% during the first quarter many people are worried about the vulnerability of slipping into recession.
- Brexit Fears: Risk of Britain exiting the European Union (a.k.a. “Brexit”) will blanket the airwaves as the referendum approaches next month
For these reasons, and others, the U.S. central bank is likely to remain accommodative in its stance (i.e., Fed Chairwoman Janet Yellen is expected to be slow in hitting the economic brakes via interest rate hikes).
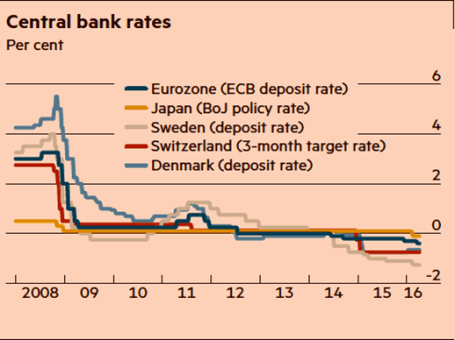
Source: Financial Times. Central banks continue with attempts to stimulate with zero/negative rates.
Climbing the Wall of Worry
Despite all these concerns, stock prices continue climbing the proverbial “wall of worry” while approaching record levels. As famed investor Sir John Templeton stated on multiple occasions, “Bull markets are born on pessimism, and they grow on skepticism, mature on optimism, and die on euphoria.” It’s obvious to me there currently is no euphoria in the overall market, if you consider investors have withdrawn $2 trillion in stock investments since 2007. The phenomenon of stocks moving higher in the face of bad news is nothing new. A recent study conducted by the Financial Times newspaper shows the current buoyant bull market entering the second longest advancing period since World War II (see chart below).
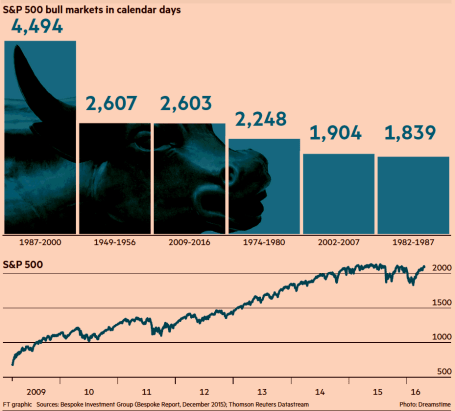
Source: Financial Times
There will never be a shortage of concerns or bad things occurring in a world of 7.4 billion people, but the Energizer bunny U.S. economy has proven resilient. Our economy is entering its seventh consecutive year of expansion, and as I recently pointed out the job market keeps plodding along in the right direction – unemployment claims are at a 43-year low (see Spring Has Sprung). Over the last few years, these job gains have come despite corporate profits being challenged by the headwinds of a stronger U.S. dollar (hurts our country’s exports) and tumbling energy profits. Fortunately, the negative factors of the dollar and oil prices have stabilized lately, and these dynamics are in the process of shifting into tailwinds for company earnings. The -5.7% year-to-date decline in the Dollar Index coupled with the recent rebound in oil prices are proof that the economic laws of supply-demand eventually respond to large currency and commodity swings. With the number of rigs drilling for oil down by approximately -80% over the last two years, it comes as no surprise to me that a drop in oil supply has steadied prices.
The volatility in oil prices has been amazing. Energy companies have been reeling as oil prices dropped -76% from a 2014-high of $108 per barrel to a 2016-low of $26 per barrel. Since then, the picture has improved significantly. Crude oil prices are now hovering around $46 per barrel, up +76%.
Energy Bankruptcy & Recessionary Fears Abate
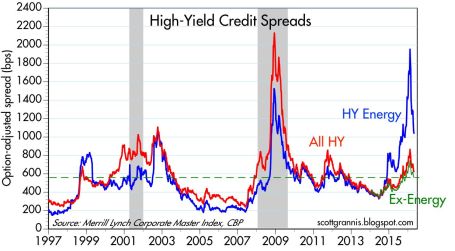
If you take a look at the borrowing costs of high-yield companies in the chart below (Calafia Beach Pundit), you can see that prior spikes in the red line (all high-yield borrowing costs) were correlated with recessions – represented by the gray periods occurring in 2001 and 2008-09. During 2016, you can see from the soaring blue line, investors were factoring in a recession for high-yield energy companies (until the oil price recovery), but the non-energy companies (red-green lines) were not anticipating a recession for the other sectors of the economy. Bottom-line, this chart is telling you the knee-jerk panic of recessionary fears during the January-February period of this year has quickly abated, which helps explain the sharp rebound in stock prices.
After a jittery start to 2016 when economic expectations were for a dying halt, investors have watched stocks recharge their batteries in March and April. There are bound to be more fits and starts in the future, as there always are, but for the time being this Energizer bunny stock market and economy keeps going…and going…and going…

Wade W. Slome, CFA, CFP®
Plan. Invest. Prosper.
DISCLOSURE: Sidoxia Capital Management (SCM) and some of its clients hold positions in certain exchange traded funds (ETFs), but at the time of publishing had no direct position in any other security referenced in this article. No information accessed through the Investing Caffeine (IC) website constitutes investment, financial, legal, tax or other advice nor is to be relied on in making an investment or other decision. Please read disclosure language on IC Contact page.
Cash Flow Statement: Game of Cat & Mouse

Much like a game of a cat chasing a mouse, analyzing financial statements can be an endless effort of hunting down a company’s true underlying fundamentals. Publicly traded companies have a built in incentive to outmaneuver its investors by maximizing profits (or minimizing expenses). With the help of flexible GAAP (Generally Accepted Accounting Principles) system and loose estimation capabilities, company executives have a fair amount of discretion in reporting financial results in a favorable light. Through the appropriate examination of the cash flow statement, the cat can slow down the clever mouse, or the investor can do a better job in pinning down corporate executives in securing the truth.
Going back to 15th century Italy, users of financial statements have relied upon the balance sheet and income statement*. Subsequently, the almighty cash flow statement was introduced to help investors cut through a lot of the statement shortcomings – especially the oft flimsy income statement.
Beware of the Income Statement Cheaters
Did you ever play the game of Monopoly with that sneaky friend who seemed to win every time he controlled the money as the game’s banker? Well effectively, that’s what companies can do – they can adjust the rules of the game as they play. A few simple examples of how companies can potentially overstate earnings include the following:
- Extend Depreciation: Depreciation is an expense that is influenced by management’s useful life estimates. If a Chief Financial Officer doubles the useful life of an asset, the associated annual expense is cut in half, thereby possibly inflating earnings.
- Capitalize Expenses: How convenient? Why not just make an expense disappear by shifting it to the balance sheet? Many companies employ that strategy by converting what many consider a normal expense into an asset, and then slowly recognizing a depreciation expense on the income statement.
- Stuffing the Channel: This is a technique that forces customers to accept unwanted orders, so the company selling the goods can recognize phantom sales and income. For example, I could theoretically sell a $1 million dollar rubber band to my brother and recognize $1 million in profits (less 1-2 cents for the cost of the rubber band), but no cash will ever be collected. Moreover, as the seller of the rubber band, I will eventually have to fess-up to a $1 million uncollectible expense (“write-off”) on my income statement.
There are plenty more examples of how financial managers implement liberal accounting practices, but there is an equalizer…the cash flow statement.
Cash Flow Statement to the Rescue
Most of the accounting shenanigans and gimmicks used on the income statement (including the ones mentioned above) often have no bearing on the stream of cash payments. In order to better comprehend the fundamental actions behind a business (excluding financial companies), I firmly believe the cash flow statement is the best place to go. One way to think about the cash flow statement is like a cash register (see related cash flow article). Any business evaluated will have cash collected into the register, and cash disbursed out of it. Specifically, the three main components of this statement are Cash Flow from Operations (CFO), Cash Flow from Investing (CFI), and Cash Flow from Financing (CFF). For instance, let us look at XYZ Corporation that sells widgets produced from its manufacturing plant. The cash collected from widget sales flows into CFO, the capital cost of building the plant into CFI, and the debt proceeds to build the plant into CFF. By scrutinizing these components of the cash flow statement, financial statement consumers will gain a much clearer perspective into the pressure points of a business and have an improved understanding of a company’s operations.
Financial Birth Certificate
As an analyst, hired to babysit a particular company, the importance of determining the maturity of the client company is critical. We may know the numerical age of a company in years, however establishing the maturity level is more important (i.e., start-up, emerging growth, established growth, mature phase, declining phase)*. Start-up companies generally have a voracious appetite for cash to kick-start operations, while at the other end of the spectrum, mature companies generally generate healthy amounts of free cash flow, available for disbursement to shareholders in the form of dividends and share buybacks. Of course, some industries reach a point of decline (automobiles come to mind) at which point losses pile up and capital preservation increases in priority as an objective. Clarifying the maturity level of a company can provide tremendous insight into the likely direction of price competition, capital allocation decisions, margin trends, acquisition strategies, and other important facets of a company (see Equity Life Cycle article).
The complex financial markets game can be a hairy game of cat and mouse. Through financial statement analysis – especially reviewing the cash flow statement – investors (like cats) can more slyly evaluate the financial path of target companies (mice). Rather than have a hissy fit, do yourself a favor and better acquaint yourself with the cash flow statement.
Wade W. Slome, CFA, CFP®
Plan. Invest. Prosper.
*DISCLOSURE: Sidoxia Capital Management (SCM) and some of its clients own certain exchange traded funds, but at the time of publishing had no direct positions in any security mentioned in this article. References to content in Financial Statement Analysis (Martin Fridson and Fernando Alvarez) was used also. No information accessed through the Investing Caffeine (IC) website constitutes investment, financial, legal, tax or other advice nor is to be relied on in making an investment or other decision. Please read disclosure language on IC “Contact” page.
Balance Sheet: The Foundation for Value

Let’s talk balance sheets… how exciting! Most people would rather hear nails scratching against a chalkboard or pour lemon juice on a fresh paper-cut, rather than slice and dice a balance sheet. However, the balance sheet plays a critical role in establishing the foundational value of a business. As part of my financial statement analysis series of articles, today we will explore the balance sheet in more detail.
It’s not just legendary value investors like Warren Buffett and Benjamin Graham who vitally rely on a page filled with assets and liabilities. Modern day masters like Bill Ackman (CEO of Pershing Square Capital Management LP – read more about Bill Ackman) and Eddie Lampert (CEO of Sears Holdings – SHLD) have in recent years relied crucially on the balance sheet, and specifically on real estate values, when it came to defining investments in Target Corporation (TGT) and Sears, respectively.
Balance Sheet Description
What is the balance sheet? For starters, it is one of the three major financial statements (in addition to the “Income Statement” and “Cash Flow Statement”), which provides a snapshot summary of a company’s assets, liabilities, and shareholders’ equity on a specific date. One of the main goals of the balance sheet is to provide an equity value of the corporation (also called “book value”).
Conceptually the balance sheet concept is no different than determining the value of your home. First, a homeowner must determine the price (asset value) of the house – usually as a function of the sales price (estimated or actual). Next, the mortgage value (debt) is subtracted from the home price to arrive at the value (equity) of the homeowner’s position. The same principle applies to valuing corporations, but as you can imagine, the complexity can increase dramatically once you account for the diverse and infinite number of potential assets and liabilities a company can hold.
Metrics
Many key financial analysis metrics are derived directly from the balance sheet, or as a result of using some of its components. Here are a few key examples:
- ROE (Return on Equity): Derived by dividing the income from the income statement by the average equity value on the balance sheet. This indicator measures the profitability of a business relative to shareholders’ investments. All else equal, a higher ROE is preferred.
- P/B (Price to Book): A ratio comparing the market capitalization (total market price of all shares outstanding) of a company to its book value (equity). All else equal, a lower P/B is preferred.
- Debt/Equity or Debt/Capitalization: These ratios explain the relation of debt to the capital structure, indicating the overall amount of financial leverage a company is assuming. All else equal, lower debt ratios are preferred, however some businesses and industries can afford higher levels of debt due to a company’s cash flow dynamics.
There are many different ratios to provide insight into a company, nonetheless, these indicators provide a flavor regarding a company’s financial positioning. In addition, these ratios serve a valuable purpose in comparing the financial status of one company relative to others (inside or outside a primary industry of operation).
Balance Sheet Shortcomings
The balance sheet is primarily built upon a historical cost basis due to defined accounting rules and guidelines, meaning the stated value of an asset or liability on a balance sheet is determined precisely when a transaction occurs in time. Over time, this accounting convention can serve to significantly understate or overstate the value of balance sheet items.
Here are a few examples of how balance sheet values can become distorted:
- Hidden Assets: Not all assets are visible on the balance sheet. Certain intangible assets have value, but cannot be touched and are not recognized by accounting rules on this particular financial statement. Examples include: human capital (employees), research & development, brands, trademarks, and patents. All these items can have substantial value, yet show up nowhere on the balance sheet.
- Lack of Comparability: Comparability of balance sheet data can become fuzzy when certain accounting rules and assumptions are exercised by one company and not another. For instance, if two different companies purchased the same property, plant, and equipment at the same time and price, the values on the balance sheets may vary significantly in the future due to the application of different depreciation schedules (e.g., 10 years versus 20 years). Share repurchase is another case in point that can alter the comparison of equity values – in some cases resulting in a negative equity value.
- Goodwill & Distorted M&A Values: Companies that are active with mergers and acquisitions are forced to reprice assets and liabilities upwards and downwards (inflation, or the lack thereof, can lead to large balance sheet adjustments). Goodwill (asset) is the excess value paid over fair market value in an acquisition. Goodwill can be quite substantial in certain transactions, especially when a high premium price is paid.
- Write-offs and Write-ups: In 2001, telecom component maker JDS Uniphase (JDSU) slashed the value of its goodwill by a massive $44.8 billion. This is an extreme illustration of how the accounting-based values on the financial statement can exhibit significant differences from a company’s market capitalization. Often, the market value (the cumulative value of all outstanding market-priced shares) is a better indicator of a company’s true value – conceptually considered the present value of all future cash flows.
Some balance sheets are built on shaky foundations. A risky, debt-laden balance sheet can resemble a shoddy home foundation built on sand, along an earthquake fault-line. In other words, a small shock can lead to financial collapse. In the credit-driven global bubble we are currently working through, many companies that were built on shaky foundations (i.e., a lot of debt) are struggling to survive. Survival may be dependent on a company restructuring, selling assets, paying down debt, merging, or other tactic with the aim of shoring up the balance sheet. Using the balance sheet value of a company in conjunction with the marketplace price of the same business can be a valuable approach in establishing a more reliable valuation. Before you make an investment or valuation conclusion about a company, do yourself a favor and dig into the balance sheet to verify the condition and soundness of a company’s financial foundation.
Wade W. Slome, CFA, CFP®
Plan. Invest. Prosper.
DISCLOSURE: Sidoxia Capital Management (SCM) and some of its clients own certain exchange traded funds, but at time of publishing had no direct positions in TGT, SHLD, or JDSU. No information accessed through the Investing Caffeine (IC) website constitutes investment, financial, legal, tax or other advice nor is to be relied on in making an investment or other decision. Please read disclosure language on IC “Contact” page.


