Posts tagged ‘financial advice’
The Bungee Market

This article is an excerpt from a previously released Sidoxia Capital Management complimentary newsletter (September 1, 2015). Subscribe on the right side of the page for the complete text.
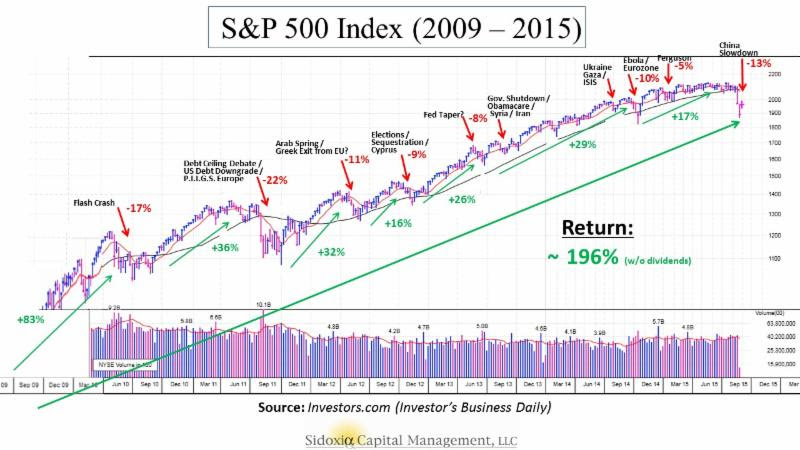
Are you an adrenaline junkie? You may be one and not even know it. If you are an investor in the stock market, you may have noticed a sinking feeling in your investment portfolio before a sharp bounce-back, much like a bungee jump. Before the recent drop of -6.6% in the Dow during August, some stock investors got lulled into a state of complacency, considering a tripling in stock prices over the last six years.
Almost any current or future news headline has the capability of potentially triggering a short-term bungee jump in stock prices. Now, worries over the health of the Chinese economy and financial markets, coupled with concerns of an impending rate hike by the Federal Reserve have created some tension for global financial markets. The slowdown in China should not be ignored, but as famed investor Bill Nygren pointed out, its impact should be placed in the proper context. China only represents 15% of global economic activity and U.S. exports to China only account for 0.7% of our GDP.
- 5% market corrections, 3 times per year on average (“correction” = price decline);
- 10% market corrections, 1 time per year on average; and
- 20% market corrections, 1 time every 3.5 years on average.
Welcome Back Volatility! Mini Flash Crash
- Economic growth revised higher (Q2 GDP raised to +3.7% from +2.3%)
- Unemployment rate continues to drop ( at 5.3%, a 7-year low)
- Interest rates near historic lows (3.95%, 30-year mortgage rate), which will remain massively stimulative even if the Fed modestly increases short-term rates
- U.S. corporate profits are near record highs (despite dampening effect of the strong U.S. dollar on exports)
- Reasonable valuations (improved after latest index price declines)
- Housing market on a steady recovery (existing home sales at multi-year highs and pricing up +6% vs. July of last year)
- Massively accommodative central banks around the globe (e.g., European Central Bank and People’s Bank of China)

Wade W. Slome, CFA, CFP®
Plan. Invest. Prosper.
Investors Take a Vacation

This article is an excerpt from a previously released Sidoxia Capital Management complimentary newsletter (August 3, 2015). Subscribe on the right side of the page for the complete text.
It’s summertime and the stock market has taken a vacation, and it’s unclear when prices will return from a seven month break. It may seem like a calm sunset walk along the beach now that Greek worries have temporarily subsided, but concerns have shifted to an impending Federal Reserve interest rate hike, declining commodity prices, and a Chinese stock market crash, which could lead to a painful sunburn.
If you think about it, stock investors have basically been on unpaid vacation since the beginning of the year, with the Dow Jones Industrial Index (17,690) down -0.7% for 2015 and the S&P 500 (2,104) up + 2.2% over the same time period (see chart below). Despite mixed results for the year, all three main stock indexes rebounded in July (including the tech-heavy NASDAQ +2.8% for the month) after posting negative returns in June. Overall for 2015, sector performance has been muddled. There has been plenty of sunshine on the Healthcare sector (+11.7%), but Energy stocks have been stuck in the doldrums (-13.4%), over the same timeframe.

Source: Yahoo! Finance
Chinese Investors Suffer Heat Stroke
Despite gains for U.S. stocks in July, the overheated Chinese stock marketcaused some heat stroke for global investors with the Shanghai Composite index posting its worst one month loss (-15%) in six years, wiping out about $4 trillion in market value. Before coming back down to earth, the Chinese stock market inflated by more than +150% from 2014.
Driving the speculative fervor were an unprecedented opening of 12 million monthly accounts during spring, according to Steven Rattner, a seasoned financier, investor, and a New York Times journalist. Margin accounts operate much like a credit card for individuals, which allowed these investors to aggressively gamble on the China market upswing, but during the downdraft investors were forced to sell stocks to generate proceeds for outstanding loan repayments. It’s estimated that 25% of these investors only have an elementary education and a significant number of them are illiterate. Further exacerbating the sell-off were Chinese regulators artificially intervening by halting trading in about 500 companies on the Shanghai and Shenzhen exchanges last Friday, equivalent to approximately 18% of all listings.
Although China, as the second largest economy on the globe, is much more economically important than a country like Greece, recent events should be placed into proper context. For starters, as you can see from the chart below, the Chinese stock market is no stranger to volatility. According to Fundstrat Global Advisors, the Shanghai composite index has experienced 10 bear markets over the last 25 years, and the recent downdraft doesn’t compare to the roughly -75% decline we saw in 2007-2008. Moreover, there is no strong correlation between the Chinese stock market. Only 15% of Chinese households own stocks, or measured differently, only 6% of household assets are held in stocks, says economic-consulting firm IHS Global Insight. More important than the question, “What will happen to the Chinese stock market?,” is the question, “What will happen to the Chinese stock economy?,” which has been on a perennial slowdown of late. Nevertheless, China has a 7%+ economic growth rate and the highest savings rate of any major country, both factors for which the U.S. economy would kill.

Source: Yardeni.com
Don’t Take a Financial Planning Vacation
While the financial markets continue to bounce around and interest rates oscillate based on guesswork of a Federal Reserve interest rate hike in September, many families are now returning from vacations, or squeezing one in before the back-to-school period. The sad but true fact is many Americans spend more time planning their family vacation than they do planning for their financial futures. Unfortunately, individuals cannot afford to take a vacation from their investment and financial planning. At the risk of stating the obvious, planning for retirement will have a much more profound impact on your future years than a well-planned trip to Hawaii or the Bahamas.
We live in an instant gratification society where “spend now, save later” is a mantra followed by many. There’s nothing wrong with splurging on a vacation, and to maintain sanity and family cohesion it is almost a necessity. However, this objective does not have to come at the expense of compromising financial responsibility – or in other words spending within your means. Investing is a lot like consistent dieting and exercising…it’s easy to understand, but difficult to sustainably execute. Vacations, on the other hand, are easy to understand, and easy to execute, especially if you have a credit card with an available balance.
It’s never too late to work on your financial planning muscle. As I discuss in a previous article (Getting to Your Number) , one of the first key steps is to calculate an annual budget relative to your income, so one can somewhat accurately determine how much money can be saved/invested for retirement. Circumstances always change, but having a base-case scenario will help determine whether your retirement goals are achievable. If expectations are overly optimistic, spending cuts, revenue enhancing adjustments, and/or retirement date changes can still be made.
When it comes to the stock market, there are never a shortage of concerns. Today, worries include a Greek eurozone exit (“Grexit”); decelerating China economic growth and a declining Chinese stock market; and the viability of Donald’s Trump’s presidential campaign (or lack thereof). While it may be true that stock prices are on a temporary vacation, your financial and investment planning strategies cannot afford to go on vacation.

Wade W. Slome, CFA, CFP®
Plan. Invest. Prosper.
DISCLOSURE: Sidoxia Capital Management (SCM) and some of its clients hold positions in certain exchange traded funds (ETFs), but at the time of publishing, SCM had no direct position in any other security referenced in this article. No information accessed through the Investing Caffeine (IC) website constitutes investment, financial, legal, tax or other advice nor is to be relied on in making an investment or other decision. Please read disclosure language on IC Contact page.
Digesting Stock Gains

This article is an excerpt from a previously released Sidoxia Capital Management complementary newsletter (June 1, 2015). Subscribe on the right side of the page for the complete text.
Despite calls for “Sell in May, and go away,” the stock market as measured by both the Dow Jones Industrial and S&P 500 indexes grinded out a +1% gain during the month of May. For the year, the picture looks much the same…the Dow is up around +1% and the S&P 500 +2%. After gorging on gains of +30% in 2013 and +11% in 2014, it comes as no surprise to me that the S&P 500 is taking time to digest the gains. After eating any large pleasurable meal, there’s always a chance for some indigestion – just like last month. More specifically, the month of May ended as it did the previous six months…with a loss on the last trading day (-115 points). Providing some extra heartburn over the last 30 days were four separate 100+ point decline days. Realized fears of a Greek exit from the eurozone would no doubt have short-term traders reaching for some Tums antacid. Nevertheless, veteran investors understand this is par for the course, especially considering the outsized profits devoured in recent years.
The profits have been sweet, but not everyone has been at the table gobbling up the gains. And with success, always comes the skeptics, many of whom have been calling for a decline for years. This begs the question, “Are we in a stock bubble?” I think not.
Bubble Bites
Most asset bubbles are characterized by extreme investor/speculator euphoria. There are certainly small pockets of excitement percolating up in the stock market, but nothing like we experienced in the most recent burstings of the 2000 technology and 2006-07 housing bubbles. Yes, housing has steadily improved post the housing crash, but does this look like a housing bubble? (see New Home Sales chart)

Source: Dr. Ed’s Blog
Another characteristic of a typical asset bubble is rabid buying. However, when it comes to the investor fund flows into the U.S. stock market, we are seeing the exact opposite…money is getting sucked out of stocks like a Hoover vacuum cleaner. Over the last eight or so years, there has been almost -$700 billion that has hemorrhaged out of domestic equity funds – actions tend to speak louder than words (see chart below):
 Source: Investment Company Institute (ICI)
The shift to Exchange Traded Funds (ETFs) offered by the likes of iShares and Vanguard doesn’t explain the exodus of cash because ETFs such as S&P 500 SPDR ETF (SPY) are suffering dramatically too. SPY has drained about -$17 billion alone over the last year and a half.
With money flooding out of these stock funds, how can stock prices move higher? Well, one short answer is that hundreds of billions of dollars in share buybacks and trillions in mergers and acquisitions activity (M&A) is contributing to the tide lifting all stock boats. Low interest rates and stimulative monetary policies by central banks around the globe are no doubt contributing to this positive trend. While the U.S. Federal Reserve has already begun reversing its loose monetary policies and has threatened to increase short-term interest rates, by any objective standard, interest rates should remain at very supportive levels relative to historical benchmarks.
Besides housing and fund flows data, there are other unbiased sentiment indicators that indicate investors have not become universally Pollyannaish. Take for example the weekly AAII Sentiment Survey, which shows 73% of investors are currently Bearish and/or Neutral – significantly higher than historical averages.
The Consumer Confidence dataset also shows that not everyone is wearing rose-colored glasses. Looking back over the last five decades, you can see the current readings are hovering around the historical averages – nowhere near the bubblicious 2000 peak (~50% below).

Source: Bespoke
Recession Reservations
Even if you’re convinced there is no imminent stock market bubble bursting, many of the same skeptics (and others) feel we’re on the verge of a recession – I’ve been writing about many of them since 2009. You could choke on an endless number of economic indicators, but on the common sense side of the economic equation, typically rising unemployment is a good barometer for any potentially looming recession. Here’s the unemployment rate we’re looking at now (with shaded periods indicating prior recessions):

As you can see, the recent 5.4% unemployment rate is still moving on a downward, positive trajectory. By most peoples’ estimation, because this has been the slowest recovery since World War II, there is still plenty of labor slack in the market to keep hiring going.
An even better leading indicator for future recessions has been the slope of the yield curve. A yield curve plots interest rate yields of similar bonds across a range of periods (e.g., three-month bill, six-month bill, one-year bill, two-year note, five-year note, 10-year note and 30-year bond). Traditionally, as short-term interest rates move higher, this phenomenon tends to flatten the yield curve, and eventually inverts the yield curve (i.e., short-term interest rates are higher than long-term interest rates). Over the last few decades, when the yield curve became inverted, it was an excellent leading indicator of a pending recession (click here and select “Animate” to see amazing interactive yield curve graph). Fortunately for the bulls, there is no sign of an inverted yield curve – 30-year rates remain significantly higher than short-term rates (see chart below).

Stock market skeptics continue to rationalize the record high stock prices by pointing to the artificially induced Federal Reserve money printing buying binge. It is true that the buffet of gains is not sustainable at the same pace as has been experienced over the last six years. As we continue to move closer to full employment in this economic cycle, the rapid accumulated wealth will need to be digested at a more responsible rate. An unexpected Greek exit from the EU or spike in interest rates could cause a short-term stomach ache, but until many of the previously mentioned indicators reach dangerous levels, please pass the gravy.
Wade W. Slome, CFA, CFP®
Plan. Invest. Prosper.
DISCLOSURE: Sidoxia Capital Management (SCM) and some of its clients hold positions in SPY and other certain exchange traded funds (ETFs), but at the time of publishing, SCM had no direct position in any other security referenced in this article. No information accessed through the Investing Caffeine (IC) website constitutes investment, financial, legal, tax or other advice nor is to be relied on in making an investment or other decision. Please read disclosure language on IC Contact page.
Ceasefires & Investor Quagmires

This article is an excerpt from a previously released Sidoxia Capital Management complementary newsletter (March 1, 2015). Subscribe on the right side of the page for the complete text.
Considering the following current event headlines, who would have guessed the stock market is trading near record, all-time highs and the NASDAQ index breaking 5,000 for the first time since the year 2000?
- Russia Lies Over Ukraine Ceasefire
- ISIS Beheadings and Jihadi John
- Strong Dollar, Weak Global Economy
- Fed’s Yellen: Rate Rise & Inflation
- Iranian Negotiations & Nuclear Weapons
- Grexit: The Likelihood of Greece’s Exit from the Euro
- The Chinese Bubble Pops
- Ebola and the Fear Epidemic
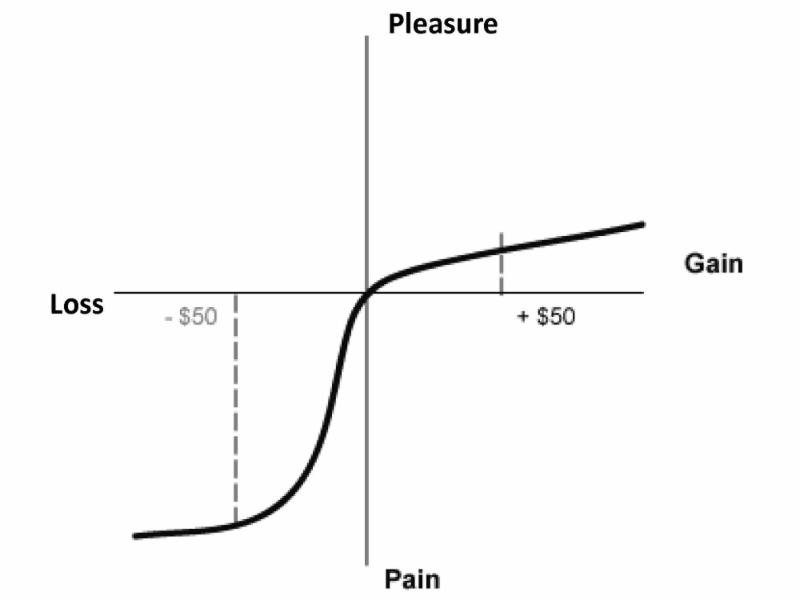
After reading all these depressing stories, I feel more like taking a Prozac pill than I do venturing into the investing world. Unfortunately, in the media world, the overarching motto driving the selection of published stories is, “If it bleeds, it leads!” Plainly and simply, bad news sells. The media outlets prey on our human behavioral shortcomings. Specifically, people feel the pain from losses at a rate more than double the feelings of pleasure (see Controlling the Lizard Brain and chart below).
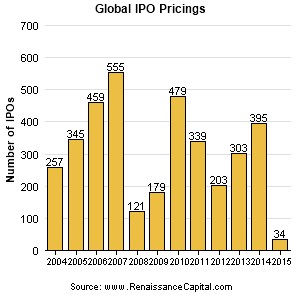
This phenomenon leaves Americans and the overall investing public choking on the daily doom and gloom headlines. Investor skepticism caused by the 2008-2009 financial crisis is evidenced by historically low stock ownership statistics and stagnant equity purchase flow data. Talk of another stock bubble has been introduced again now that the NASDAQ is approaching 5,000 again, but we are not seeing signs of this phenomenon in the IPO market (Initial Public Offering) – see chart below. IPOs are on the rise, but the number of filings is more than -50% below the peak of 845 IPOs seen in the late 1990s when former Federal Reserve Chairman Alan Greenspan made his famous “irrational exuberance” speech (see also Irrational Exuberance Deja Vu and chart below).
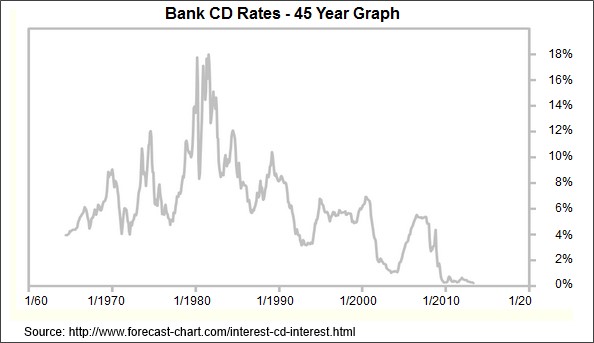
Uggh! 0.08% Really?
Compounding the never-ending pessimism problem is the near-0% interest rate environment. Times are long gone when you could earn 18% on a certificate of deposit (see chart below). Today, you can earn 0.08% on a minimum $10,000 investment in a Bank of America (BAC) Certificate of Deposit (CD). Invest at that rate for more than a decade and you will have almost accumulated a $100 (~1%) – probably enough for a single family meal…without tip. To put these paltry interest rates into perspective, the U.S. stock market as measured by the S&P 500 index was up a whopping +5.5% last month and the Dow Jones Industrials climbed +5.6% (+968 points to 18,133). Granted, last month’s S&P 500 percentage increase was the largest advance since 2011, but if I wanted to earn an equivalent +5.5% return by investing in that Bank of America CD, it would take me to age 100 years old before I earned that much!
Globally, the interest rate picture doesn’t look much prettier. In fact, the negative interest rate bonds offered in Switzerland and other neighboring countries, including France and Germany, have left investors in these bonds with guaranteed losses, if held to maturity (see also Draghi Beer Goggles).
Money Seeking Preferred Treatment
Investors and followers of mine have heard me repeatedly declare that “money goes where it is treated best.” When many investments are offering 0% (or negative yields), it comes as no surprise to me that dividend paying stocks have handily outperformed the overall bond market in recent years. Hard to blame someone investing in certain stocks offering between 2-6% in dividends when the alternative is offered at or near 0%.
While at Sidoxia we are still finding plenty of opportunities in the equity markets, I want to extend the reminder that not everyone can (or should) increase their equity allocation because of personal time horizon and risk tolerance constraints. Regardless, the current, restricting global financial markets are highlighting the scarcity of investment alternatives available.
As we will continue to be bombarded with more cease fires, quagmires and other bleeding headlines, investors will be better served by ignoring the irrelevant headlines and instead create a long-term financial plan with an asset allocation designed to meeting their personal goals. By following this strategy, you can let the dooms-dayers bleed while you succeed.

Wade W. Slome, CFA, CFP®
Plan. Invest. Prosper.
DISCLOSURE: Sidoxia Capital Management (SCM) and some of its clients hold positions in certain exchange traded funds (ETFs) and BAC, but at the time of publishing, SCM had no direct position in any other security referenced in this article. No information accessed through the Investing Caffeine (IC) website constitutes investment, financial, legal, tax or other advice nor is to be relied on in making an investment or other decision. Please read disclosure language on IC Contact page.
Inflating Dollars & Deflating Footballs

This article is an excerpt from a previously released Sidoxia Capital Management complementary newsletter (February 2, 2015). Subscribe on the right side of the page for the complete text.
In the weeks building up to Super Bowl XLIX (New England Patriots vs. Seattle Seahawks) much of the media hype was focused on the controversial alleged “Deflategate”, or the discovery of deflated Patriot footballs, which theoretically could have been used for an unfair advantage by New England’s quarterback Tom Brady. While Brady ended up winning his record-tying 4th Super Bowl ring for the Patriots by defeating the Seahawks 28-24, the stock market deflated during the first month of 2015 as well. Similar to last year, the stock market has temporarily declined last January before surging ahead +11.4% for the full year of 2014. It’s early in 2015, and investors chose to lock-in a small portion of the hefty, multi-year bull market gains. The S&P 500 was sacked for a loss of -3.1% and the Dow Jones Industrial index by -3.7%.
Despite some early performance headwinds, the U.S. economy kicked off the year with the wind behind its back in the form of deflating oil prices. Specifically, West Texas Intermediate (WTI) crude oil prices declined -9.4% last month to $48.24, and over -51.0% over the last six months. Like a fresh set of substitute legs coming off the bench to support the team, the oil price decline represents an effective $125 billion tax cut for consumers in the form of lower gasoline prices (average $2.03 per gallon nationally) – see chart below. The gasoline relief will allow consumers more discretionary spending money, so football fans, for example, can buy more hot dogs, beer, and souvenirs at the Super Bowl. The cause for the recent price bust? The primary reasons are three-fold: 1) Sluggish oil demand from developed markets like Europe and Japan coupled with slowing consumption growth in some emerging markets like China; 2) Growing supply in various U.S. fracking regions has created a temporary global oil glut; and 3) Uncertainty surrounding OPEC (Organization of Petroleum Exporting Countries) supply/production policies, which became even more unclear with the recent announced death of Saudi Arabia’s King Abdullah.
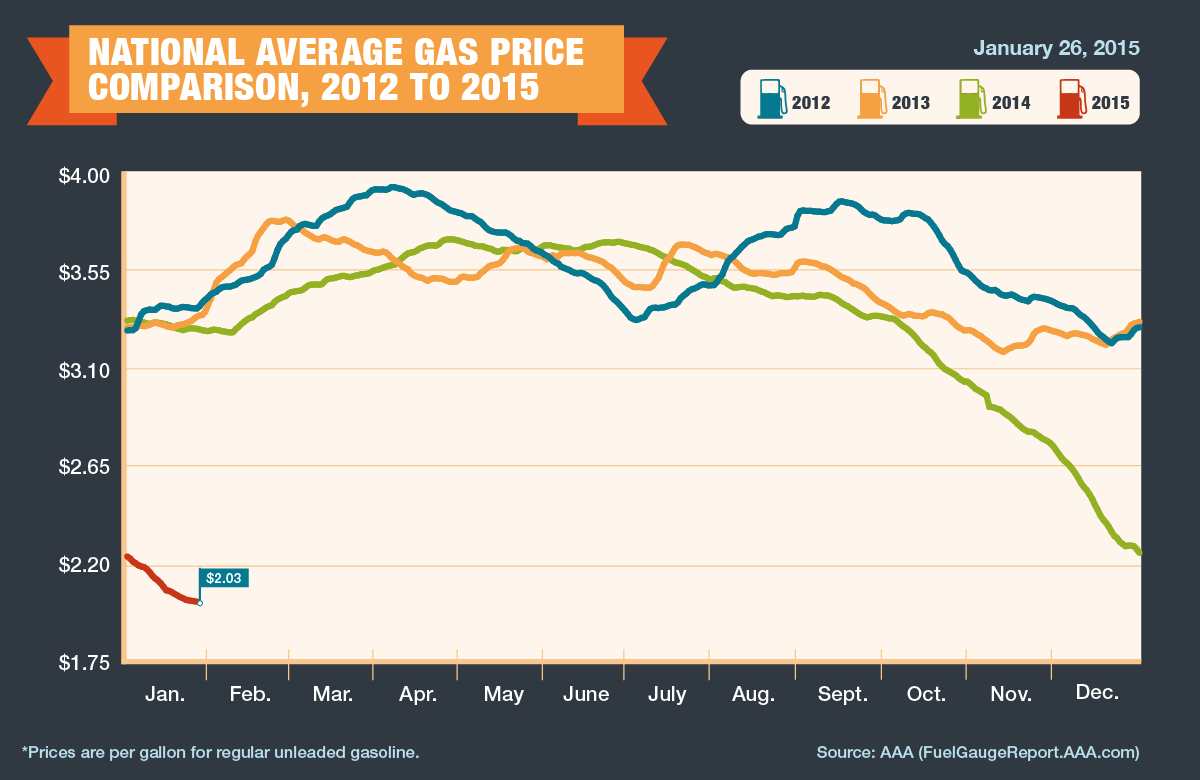
Source: AAA
More deflating than the NFL football’s “Deflategate” is the approximate -17% collapse in the value of the euro currency (see chart below). Euro currency matters were made worse in response to European Central Bank’s (ECB) President Mario Draghi’s announcement that the eurozone would commence its own $67 billion monthly Quantitative Easing (QE) program (very similar to the QE program that Federal Reserve Chairwoman Janet Yellen halted last year). In total, if carried out to its full design, the euro QE version should amount to about $1.3 trillion. The depreciating effect on the euro (and appreciating value of the euro) should help stimulate European exports, while lowering the cost of U.S. imports – you may now be able to afford that new Rolls-Royce purchase you’ve been putting off. What’s more, the rising dollar is beneficial for Americans who are planning to vacation abroad…Paris here we come!
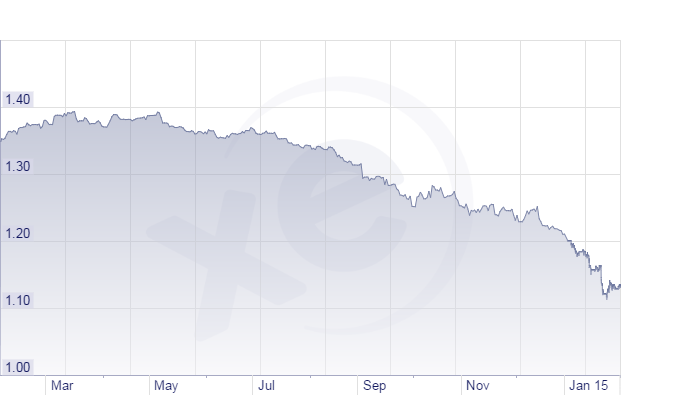
Source: XE.com
Another fumble suffered by the global currency markets was introduced with the unexpected announcement by the Swiss National Bank (SNB) that decided to remove its artificial currency peg to the euro. Effectively, the SNB had been purchased and accumulated a $490 billion war-chest reserve (Supply & Demand Lessons) to artificially depress the value of the Swiss franc, thereby allowing the country to sell more Swiss army knives and watches abroad. When the SNB could no longer afford to prop up the value of the franc, the currency value spiked +20% against the euro in a single day…ouch! In addition to making its exports more expensive for foreigners, the central bank’s move also pushed long-term Swiss Treasury bond yields negative. No, you don’t need to check your vision – investors are indeed paying Switzerland to hold investor money (i.e., interest rates are at an unprecedented negative level).
In addition to some of the previously mentioned setbacks, financial markets suffered another penalty flag. Last month, multiple deadly terrorist acts were carried out at a satirical magazine headquarters and a Jewish supermarket – both in Paris. Combined, there were 16 people who lost their lives in these senseless acts of violence. Unfortunately, we don’t live in a Utopian world, so with seven billion people in this world there will continue to be pointless incidences like these. However, the good news is the economic game always goes on in spite of terrorism.
As is always the case, there will always be concerns in the marketplace, whether it is worries about inflation, geopolitics, the economy, Federal Reserve policy, or other factors like a potential exit of Greece out of the eurozone. These concerns have remained in place over the last six years and the stock market has about tripled. The fact remains that interest rates are at a generational low (see also Stretching the High Yield Rubber Band), thereby supplying a scarcity of opportunities in the fixed income space. Diversification remains important, but regardless of your time horizon and risk tolerance, attractively valued equities, including high-quality, dividend-paying stocks should account for a certain portion of your portfolio. Any winning retirement playbook understands a low-cost, globally diversified portfolio, integrating a broad set of asset classes is the best way of preventing a “deflating” outcome in your long-term finances.
Wade W. Slome, CFA, CFP®
Plan. Invest. Prosper.
DISCLOSURE: Sidoxia Capital Management (SCM) and some of its clients hold positions in certain exchange traded funds (ETFs), but at the time of publishing SCM had no direct position in any other security referenced in this article. No information accessed through the Investing Caffeine (IC) website constitutes investment, financial, legal, tax or other advice nor is to be relied on in making an investment or other decision. Please read disclosure language on IC Contact page.
Don’t Be a Fool, Follow the Stool

It’s the holiday season and with another year coming to an end, it’s also time for a wide range of religious celebrations to take place. Investing is a lot like religion too. Just like there are a countless number of religions, there are also a countless number of investing styles, whether you are talking about Value investing, Growth, Quantitative, Technical, Momentum, Merger-Arbitrage, GARP (Growth At a Reasonable Price), or a multitude of other derivative types. But regardless of the style followed, most professional managers believe their style is the sole answer to lead followers to financial nirvana. While I may not share the same view (I believe there are many ways to skin the stock market cat), each investing discipline (or religion) will have its own unique core tenets that drive expectations for future returns (outcomes).
As it relates to my firm, Sidoxia Capital Management, our investment process is premised on four key tenets. Much like the four legs of a stool, the following principles provide the foundation for our beliefs and outlook on the mid-to-long-term direction of the stock market:
- Profits
- Interest Rates
- Sentiment
- Valuations
Why are these the key components that drive stock market returns? Let’s dig a little deeper to clarify the importance of these factors:
Profits: Over the long-run there is a very significant correlation between stock prices and profits (see also It’s the Earnings, Stupid). I’m not the only one preaching this religious belief, investment legends Peter Lynch and William O’Neil think the same. In answer to a question by Dell Computer’s CEO Michael Dell about its stock price, Lynch famously responded , “If your earnings are higher in five years, your stock will be higher.” The same idea works with the overall stock market. As I recently wrote (see Why Buy at Record Highs? Ask the Fat Turkey), with corporate profits at all-time record highs, it should come as no surprise that stock prices are near all-time record highs. Regardless of the absolute level of profits, it’s also very important to have a feel for whether earnings are accelerating or decelerating, because investors will pay a different price based on this dynamic.
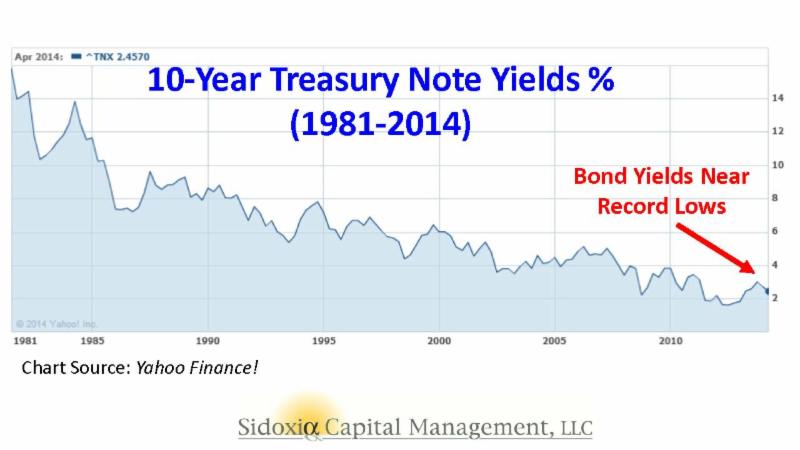
Interest Rates: When embarrassingly low CD interest rates of 0.08% are being offered on $10,000 deposits at Bank of America, do you think stocks look more or less attractive? It’s obviously a rhetorical question, because I can earn 20x more just by collecting the dividends from the S&P 500 index. Now in 1980 when the Federal Funds rate was set at 20.0% and investors could earn 16.0% on CDs, guess what? Stocks were logging their lowest valuation levels in decades (approximately 8x P/E ratio vs 17x today). The interest rate chart from Scott Grannis below highlights the near generational low interest rates we are currently experiencing.

Source: Calafia Beach Pundit
Sentiment: As I wrote in my Sentiment Indicators: Reading the Tea Leaves article, there are plenty of sentiment indicators (e.g., AAII Surveys, VIX Fear Gauge, Breadth Indicators, NYSE Bulls %, Put-Call Ratio, Volume), which traditionally are good contrarian indicators for the future direction of stock prices. When sentiment is too bullish (optimistic), it is often a good time to sell or trim, and when sentiment is too bearish (pessimistic), it is often good to buy. With that said, in addition to many of these short-term sentiment indicators, I realize that actions speak louder than words, therefore I like to also see the flows of funds into and out of stocks/bonds to gauge sentiment (see also Market Champagne Sits on Ice).
Valuations: As Fred Hickey, the lead editor of the High Tech Strategist noted, “Valuations do matter in the stock market, just as good pitching matters in baseball.” The most often quoted valuation metric is the Price/Earnings multiple or PE ratio. In other words, this ratio compares the price you would pay for an annual stream of profits. This can be tricky to determine because there are virtually an infinite number of factors that can impact the numerator and denominator. Currently P/E valuations are near historical averages (see below) – not nearly as cheap as 1980 and not nearly as expensive as 2000. If I only had one metric to choose, this would be a good place to start because the previous three legs of the stool feed into valuation calculations. In addition to P/E, at Sidoxia one of our other favorite metrics is Free-Cash-Flow Yield (annual cash generation after all expenses and expenditures divided by a company’s value). Earnings can be manipulated much easier than cold hard cash in our view.
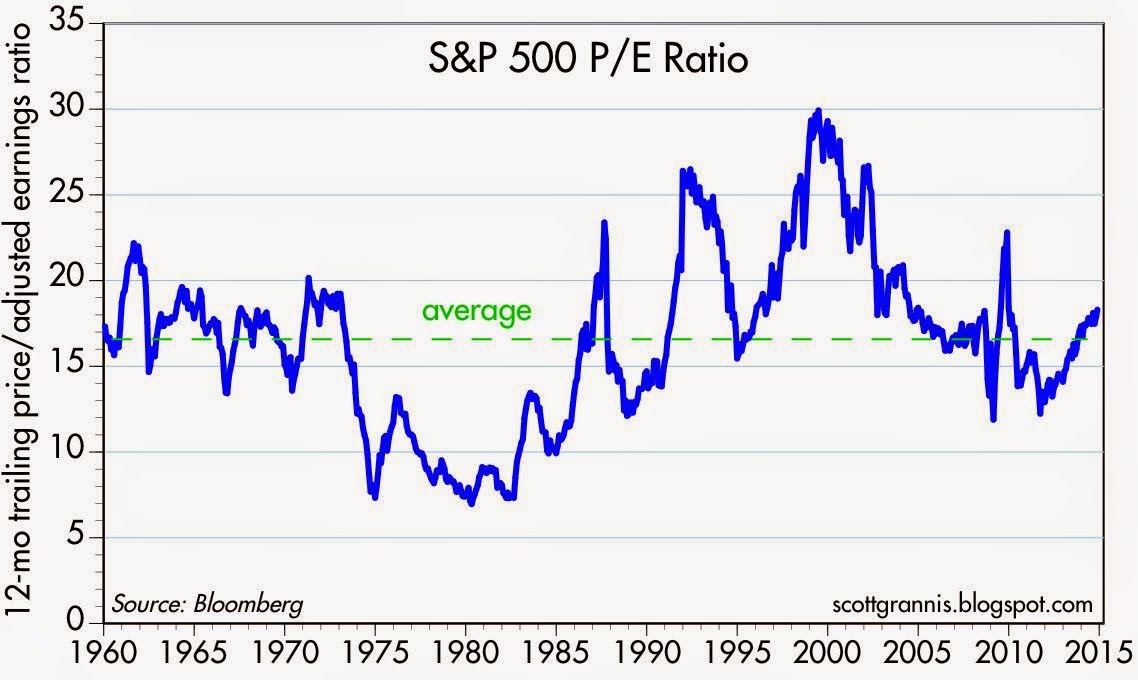
Source: Calafia Beach Pundit
Nobody, myself and Warren Buffett included, can consistently predict what the stock market will do in the short-run. Buffett freely admits it. However, investing is a game of probabilities, and if you use the four tenets of profits, interest rates, sentiment, and valuations to drive your long-term investing decisions, your chances for future financial success will increase dramatically. This framework is just as relevant today as it is when studying the 1929 Crash, the 1989 Japan Bubble, or the 2008-2009 Financial Crisis. If your goal is to not become an investing fool, I highly encourage you to follow the legs of the Sidoxia stool.
Wade W. Slome, CFA, CFP®
Plan. Invest. Prosper.
DISCLOSURE: Sidoxia Capital Management (SCM) and some of its clients own a range of positions, including BAC and certain exchange traded fund positions, but at the time of publishing SCM had no direct position in any other security referenced in this article. No information accessed through the Investing Caffeine (IC) website constitutes investment, financial, legal, tax or other advice nor is to be relied on in making an investment or other decision. Please read disclosure language on IC Contact page.
Psst…Do You Want to Join the Club?

 
#2. Don’t waste your time listening to the media.
Like dieting, the framework is simple to understand, but difficult to execute. Theoretically, if you follow Rule #1, you don’t have worry about Rule #2. Unfortunately, many people have no rules or discipline in place, and instead let their emotions drive all investing decisions. When it comes to following the media, Mark Twain stated it best:
“If you don’t read the newspaper, you are uninformed. If you do read the newspaper, you are misinformed.”
It’s fine to be informed, as long as the deluge of data doesn’t enslave you into bad, knee-jerk decision-making. You’ve seen those friends, family members and co-workers who are glued to their cell phones or TVs while insatiably devouring real-time data from CNBC, CNN, or their favorite internet blog. The grinding teeth and sweaty palms should be a dead giveaway that these habits are not healthy for investment account balances or blood pressure.
Thanks to the endless scary headlines and stream of geopolitical turmoil (fear sells), millions of investors have missed out on one of the most staggering bull market rallies in history. More specifically, the S&P 500 index (large capitalization companies) has almost tripled in value from early 2009 (666 to 1,931) and the S&P 600 index (small capitalization companies) almost quadrupled from 181 to 645.
The Challenge

Becoming a member of the Successful Investors Club (SIC) is no easy feat. As I’ve written in the past, the human brain has evolved dramatically over tens of thousands of years, but the troubling, emotionally-driven amygdala tissue mass at the end of the brain stem (a.k.a., “Lizard Brain“) still remains. The “Lizard Brain” automatically produces a genetic flight response to perceived worrisome stimuli surrounding us. In other words, our “Lizard Brain” often interprets excessively sensationalized current events as a threat to our financial security and well-being.
It’s no wonder amateur investors have trouble dealing with the incessantly changing headlines. Yesterday, investors were panicked over the P.I.I.G.S (Portugal, Italy, Ireland, Greece, Spain), the Arab Spring (Tunisia, Egypt, Iran, etc.), and Cyprus. Today, it’s Ukraine, Argentina, Israel, Gaza, Syria, and Iraq. Tomorrow…who knows? It’s bound to be another fiscally irresponsible country, terrorist group, or autocratic leader wreaking havoc upon their people or enemies.
During the pre-internet or pre-smartphone era, the average person couldn’t even find Ukraine, Syria, or the Gaza Strip on a map. Today, we are bombarded 24/7 with frightening stories over these remote regions that have dubious economic impact on the global economy.
Take the Ukraine for example, which if you think about it is a fiscal pimple on the global economy. Ukraine’s troubled $177 billion economy, represents a mere 0.29% of the $76 trillion global GDP. Could an extended or heightened conflict in the region hinder the energy supply to a much larger and significant European region? Certainly, however, Russian President Vladimir Putin doesn’t want the Ukrainian skirmish to blow up out of control. Russia has its own economic problems, and recent U.S. and European sanctions haven’t made Putin’s life any easier. The Russian leader has a vested economic interest to keep its power hungry European customers happy. If not, the U.S.’s new found resurgence in petroleum supplies from fracking will allow our country to happily create jobs and export excess reserves to a newly alienated EU energy buyer.
The Solution

 
Rather than be hostage to the roller coaster ride of rising and falling economic data points, it’s better to follow the sage advice of investing greats like Peter Lynch, who averaged a +29% return per year from 1977 – 1990.
Here’s what he had to say about news consumption:
“If you spend more than 13 minutes analyzing economic and market forecasts, you’ve wasted 10 minutes.”
 
“Far more money has been lost by investors preparing for corrections, or trying to anticipate corrections, than has been lost in corrections themselves.”
Rather than fret about the direction of the market, at Sidoxia Capital Management we are focused on identifying the best available opportunities, given any prevailing economic environment (positive or negative). We assume the market will go nowhere and invest our client assets (and personal assets) accordingly by focusing on those areas we see providing the most attractive risk-adjusted returns. Investors who try to time the market, fail miserably over the long-run. If timing the market were easy, you would see countless people’s names at the tops of the Forbes billionaire list – regrettably that simply is not the case.
Since “fear” sells in the media world, it’s always important to sift through the deluge of data to gain a balanced perspective. During panic periods, it’s important to find the silver linings. When everyone is euphoric, it’s vital to discover reasons for caution.
While a significant amount of geopolitical turmoil occurred last month, it’s essential to remember the underlying positive fundamentals propelling the stock market to record highs. The skeptics of the recovery and record stock market point to the Federal Reserve’s unprecedented, multi-trillion dollar money printing scheme (Quantitative Easing – QE) and the inferior quality of the jobs created. Regarding the former point, if QE has been so disastrous, I ask where is the run-away inflation (see chart below)? While the July jobs report may show some wage pressure, you can see we’re still a long ways away from the elevated pricing levels experienced during the 1970s-1980s.

Source: Calafia Beach Pundit
A final point worth contemplating as it relates to the unparalleled Fed Policy actions was highlighted by strategist Scott Grannis. If achieving real economic growth through money printing was so easy, how come Zimbabwe and Argentina haven’t become economic powerhouses? The naysayers also fail to acknowledge that the Fed has already reversed the majority of its stimulative $85 billion monthly bond buying program (currently at $25 billion per month). What’s more, the Federal Open Market Committee has already signaled a rate hike to 1.13% in 2015 and 2.50% in 2016 (see chart below).

Source: Financial Times
The rise in interest rates from generationally low levels, especially given the current status of our improving economy, as evidenced by the recent robust +4.0% Q2-GDP report, is inevitable. It’s not a matter of “if”, but rather a matter of “when”.
On the latter topic of job quality, previously mentioned, I can’t defend the part-time, underemployed nature of the employment picture, nor can I defend the weak job participation rate. In fact, this economic recovery has been the slowest since World War II. With that said, about 10 million private sector jobs have been added since the end of the Great Recession and the unemployment rate has dropped from 10% to 6.1%. However you choose to look at the situation, more paychecks mean more discretionary dollars in the wallets and purses of U.S. workers. This reality is important because consumer spending accounts for 70% of our country’s economic activity.
While there is a correlation between jobs, interest rates, and the stock market, less obvious to casual observers is the other major factor that drives stock prices…record corporate profits. That’s precisely what you see in the chart below. Not only are trailing earnings at record levels, but forecasted profits are also at record levels. Contrary to all the hyped QE Fed talk, the record profits have been bolstered by important factors such as record manufacturing, record exports, and soaring oil production …not QE.

Join the Club
Those who have been around the investing block a few times realize how challenging investing is. The deafening information noise instantaneously accessed via the internet has only made the endeavor of investing that much more challenging. But the cause is not completely lost. If you want to join the bull market and the SIC (Successful Investors Club), all you need to do is follow the two top secret rules. Creating a plan and sticking to it, while ignoring the mass media should be easy enough, otherwise find an experienced, independent investment advisor like Sidoxia Capital Management to help you join the club.
Wade W. Slome, CFA, CFP®
Plan. Invest. Prosper.
DISCLOSURE: Sidoxia Capital Management (SCM) and some of its clients hold long positions in certain exchange traded funds ans securities, but at the time of publishing SCM had no direct position in any other security referenced in this article. No information accessed through the Investing Caffeine (IC) website constitutes investment, financial, legal, tax or other advice nor is to be relied on in making an investment or other decision. Please read disclosure language on IC Contact page.
Sports & Investing: Why Strong Earnings Can Hurt Stock Prices

With the World Cup in full swing and rabid fans rooting for their home teams, one may notice the many similarities between investing in stocks and handicapping in sports betting. For example, investors (bettors) have opposing views on whether a particular stock (team) will go up or down (win or lose), and determine if the valuation (point spread) is reflective of the proper equilibrium (supply & demand). And just like the stock market, virtually anybody off the street can place a sports bet – assuming one is of legal age and in a legal betting jurisdiction.
Soon investors will be poring over data as part of the critical, quarterly earnings ritual. With some unsteady GDP data as of late, all eyes will be focused on this earnings reporting season to reassure market observers the bull advance can maintain its momentum. However, even positive reports may lead to unexpected investor reactions.
So how and why can market prices go down on good news? There are many reasons that short-term price trends can diverge from short-run fundamentals. One major reason for the price-fundamental gap is this key factor: “expectations”. With such a large run-up in the equity markets (up approx. +195% from March 2009) come loftier expectations for both the economy and individual companies. For instance, just because corporate earnings unveiled from companies like Google (GOOG/GOOGL), J.P. Morgan (JPM), and Intel (INTC) exceed Wall Street analyst forecasts does not mean stock prices automatically go up. In many cases a stock price correction occurs due to a large group of investors who expected even stronger profit results (i.e., “good results, but not good enough”). In sports betting lingo, the sports team may have won the game this week, but they did not win by enough points (“cover the spread”).
Some other reasons stock prices move lower on good news:
- Market Direction: Regardless of the underlying trends, if the market is moving lower, in many instances the market dip can overwhelm any positive, stock- specific factors.
- Profit Taking: Many times investors holding a long position will have price targets or levels, if achieved, that will trigger selling whether positive elements are in place or not.
- Interest Rates: Certain valuation techniques (e.g. Discounted Cash Flow and Dividend Discount Model) integrate interest rates into the value calculation. Therefore, a climb in interest rates has the potential of lowering stock prices – even if the dynamics surrounding a particular security are excellent.
- Quality of Earnings: Sometimes producing winning results is not enough (see also Tricks of the Trade article). On occasion, items such as one-time gains, aggressive revenue recognition, and lower than average tax rates assist a company in getting over a profit hurdle. Investors value quality in addition to quantity.
- Outlook: Even if current period results may be strong, on some occasions a company’s outlook regarding future prospects may be worse than expected. A dark or worsening outlook can pressure security prices.
- Politics & Taxes: These factors may prove especially important to the market this year, since this is a mid-term election year. Political and tax policy changes today may have negative impacts on future profits, thereby impacting stock prices.
- Other Exogenous Items: Natural disasters and security attacks are examples of negative shocks that could damage price values, irrespective of fundamentals.
Certainly these previously mentioned issues do not cover the full gamut of explanations for temporary price-fundamental gaps. Moreover, many of these factors could be used in reverse to explain market price increases in the face of weaker than anticipated results.
If you’re traveling to Las Vegas to place a wager on the World Cup, betting on winning favorites like Germany and Argentina may not be enough. If expectations are not met and the hot team wins by less than the point spread, don’t be surprised to see a decline in the value of your bet.
Wade W. Slome, CFA, CFP®
Plan. Invest. Prosper.
DISCLOSURE: Sidoxia Capital Management (SCM) and some of its clients own certain exchange traded funds, GOOG, and GOOGL, but at the time of publishing had no direct positions in JPM and INTC. No information accessed through the Investing Caffeine (IC) website constitutes investment, financial, legal, tax or other advice nor is to be relied on in making an investment or other decision. Please read disclosure language on IC “Contact” page.
Stocks Winning vs. Weak Competitors

This article is an excerpt from a previously released Sidoxia Capital Management complementary newsletter (June 2, 2014). Subscribe on the right side of the page for the complete text.
Winning at any sport is lot easier if you can compete without an opponent. Imagine an NBA basketball MVP LeBron James driving to the basket against no defender, or versus a weakling opponent like a 44-year-old investment manager. Under these circumstances, it would be pretty easy for James and his team, the Miami Heat, to victoriously dominate without even a trace of sweat.
Effectively, stocks have enjoyed similar domination in recent years, while steamrolling over the bond competition. To put the stock market’s winning streak into perspective, the S&P 500 index set a new all-time record high in May, with the S&P 500 advancing +2.1% to 1924 for the month, bringing the 2013-2014 total return to about +38%. Not too shabby results over 17 months, if you consider bank deposits and CDs are paying a paltry 0.0-1.0% annually, and investors are gobbling up bonds yielding a measly 2.5% (see chart below).
The point, once again, is that even if you are a skeptic or bear on the outlook for stocks, the stock market still offers the most attractive opportunities relative to other asset classes and investment options, including bonds. It’s true, the low hanging fruit in stocks has been picked, and portfolios can become too equity-heavy, but even retirees should have some exposure to equities.
As I wrote last month in Buy in May and Dance Away, why would investors voluntarily lock in inadequate yields at generational lows when the earnings yield on stocks are so much more appealing. The approximate P/E (Price-Earnings) ratio for the S&P 500 currently averages approximately +6.2% with a rising dividend yield of about +1.8% – not much lower than many bonds. Over the last five years, those investors willing to part ways with yield-less cash have voted aggressively with their wallets. Those with confidence in the equity markets have benefited massively from the approximate +200% gains garnered from the March 2009 S&P 500 index lows.
For the many who have painfully missed the mother of all stock rallies, the fallback response has been, “Well, sure the market has tripled, but it’s only because of unprecedented printing of money at the QE (Quantitative Easing) printing presses!” This argument has become increasingly difficult to defend ever since the Federal Reserve announced the initiation of the reduction in bond buying (a.k.a., “tapering”) six months ago (December 18th). Over that time period, the Dow Jones Industrial Average has increased over 800 points and the S&P 500 index has risen a healthy 8.0%.
As much as everyone would like to blame (give credit to) the Fed for the bull market, the fact is the Federal Reserve doesn’t control the world’s interest rates. Sure, the Fed has an influence on global interest rates, but countries like Japan may have something to do with their own 0.57% 10-year government bond yield. For example, the economic/political policies and demographics in play might be impacting Japan’s stock market (Nikkei), which has plummeted about -62% over the last 25 years (about 39,000 to 15,000). Almost as shocking as the lowly rates in Japan and the U.S. and Japan, are the astonishingly low interest rates in Europe. As the chart below shows, France and Germany have sub-2% 10-year government bond yields (1.76% and 1.36%, respectively) and even economic basket case countries like Italy and Spain have seen their yields pierce below the 3% level.
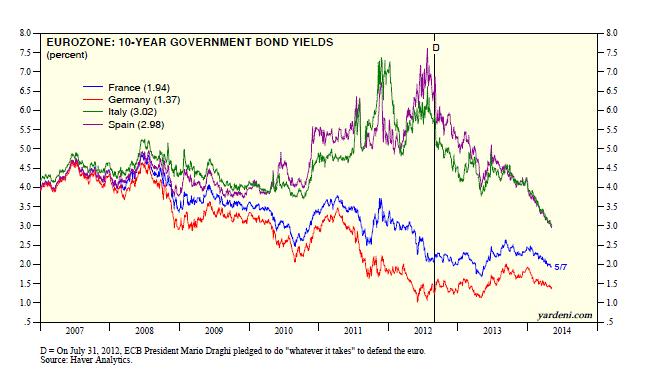 Source: Dr. Ed’s Blog
Suffice it to say, yield is not only difficult to find on our shores, but it is also challenging to find winning bond returns globally.
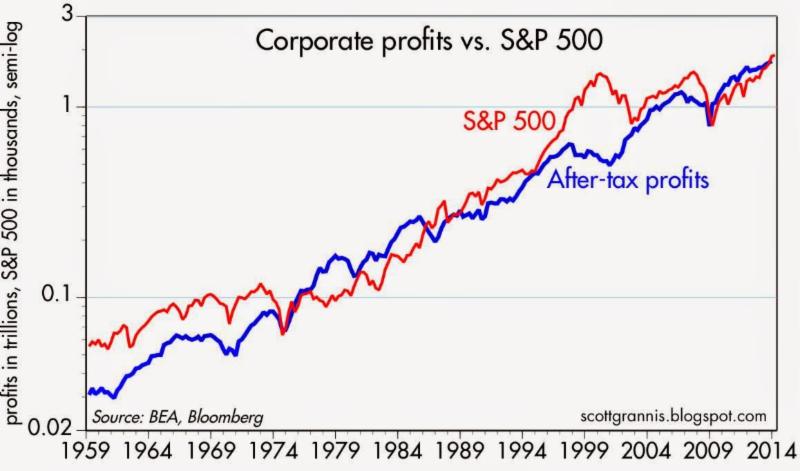
Well if low interest rates and the Federal Reserve aren’t the only reasons for a skyrocketing stock market, then how come this juggernaut performance has such long legs? The largest reason in my mind boils down to two words…record profits. Readers of mine know I follow the basic tenet that stock prices follow earnings over the long-term. Interest rates and Fed Policy will provide headwinds and tailwinds over different timeframes, but ultimately the almighty direction of profits determines long-run stock performance. You don’t have to be a brain surgeon or rocket scientist to appreciate this correlation. Scott Grannis (Calafia Beach Pundit) has beautifully documented this relationship in the chart below.
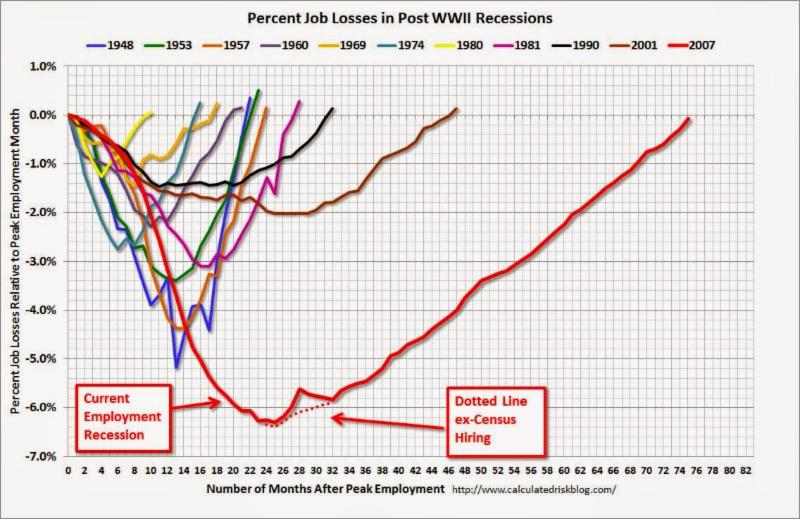
Supporting this concept, profits help support numerous value-enhancing shareholder activities we have seen on the rise over the last five years, which include rising dividends, share buybacks, and M&A (Mergers & Acquisitions) activity. Eventually the business cycle will run its course, and during the next recession, profits and stock prices will be expected to decline. A final contributing factor to the duration of this bull market is the abysmally slow pace of this economic recovery, which if measured in job creation terms has been the slowest since World War II. Said differently, the slower a recovery develops, the longer the recovery will last. Bill McBride at Calculated Risk captured this theme in the following chart:
Despite the massive gains and new records set, skeptics abound as evidenced by the nearly -$10 billion of withdrawn money out of U.S. stock funds over the last month (most recent data).
I’ve been labeled a perma-bull by some, but over my 20+ years of investing experience I understand the importance of defensive positioning along with the benefits of shorting expensive, leveraged stocks during bear markets, like the ones in 2000-2001 and 2008-2009. When will I reverse my views and become bearish (negative) on stocks? Here are a few factors I’m tracking:
- Inverted Yield Curve: This was a good precursor to the 2008-2009 crash, but there are no signs of this occurring yet.
- Overheated Fund Inflows: When everyone piles into stocks, I get nervous. In the last four weeks of domestic ICI fund flow data, we have seen the opposite…about -$9.5 billion outflows from stock funds.
- Peak Employment: When things can’t get much better is the time to become more worried. There is still plenty of room for improvement, especially if you consider the stunningly low employment participation rate.
- Fed Tightening / Rising Bond Yields: The Fed has made it clear, it will be a while before this will occur.
- When Housing Approaches Record Levels: Although Case-Shiller data has shown housing prices bouncing from the bottom, it’s clear that new home sales have stalled and have plenty of head room to go higher.
- Financial Crisis: Chances of experiencing another financial crisis of a generation is slim, but many people have fresh nightmares from the 2008-2009 financial crisis. It’s not every day that a 158 year-old institution (Lehman Brothers) or 85 year-old investment bank (Bear Stearns) disappear, but if the dominoes start falling again, then I guess it’s OK to become anxious again.
- Better Opportunities: The beauty about my practice at Sidoxia is that we can invest anywhere. So if we find more attractive opportunities in emerging market debt, convertible bonds, floating rate notes, private equity, or other asset classes, we have no allegiances and will sell stocks.
Every recession and bear market is different, and although the skies may be blue in the stock market now, clouds and gray skies are never too far away. Even with record prices, many fears remain, including the following:
- Ukraine: There is always geopolitical instability somewhere on the globe. In the past investors were worried about Egypt, Iran, and Syria, but for now, some uncertainty has been created around Ukraine.
- Weak GDP: Gross Domestic Product was revised lower to -1% during the first quarter, in large part due to an abnormally cold winter in many parts of the country. However, many economists are already talking about the possibility of a 3%+ rebound in the second quarter as weather improves.
- Low Volatility: The so-called “Fear Gauge” is near record low levels (VIX index), implying a reckless complacency among investors. While this is a measure I track, it is more confined to speculative traders compared to retail investors. In other words, my grandma isn’t buying put option insurance on the Nasdaq 100 index to protect her portfolio against the ramifications of the Thailand government military coup.
- Inflation/Deflation: Regardless of whether stocks are near a record top or bottom, financial media outlets in need of a topic can always fall back on the fear of inflation or deflation. Currently inflation remains in check. The Fed’s primary measure of inflation, the Core PCE, recently inched up +0.2% month-to-month, in line with forecasts.
- Fed Policy: When are investors not worried about the Federal Reserve’s next step? Like inflation, we’ll be hearing about this concern until we permanently enter our grave.
In the sport of stocks and investing, winning is never easy. However, with the global trend of declining interest rates and the scarcity of yields from bonds and other safe investments (cash/money market/CDs), it should come as no surprise to anyone that the winning streak in stocks is tied to the lack of competing investment alternatives. Based on the current dynamics in the market, if LeBron James is a stock, and I’m forced to guard him as a 10-year Treasury bond, I think I’ll just throw in the towel and go to Wall Street. At least that way my long-term portfolio has a chance of winning by placing a portion of my bets on stocks over bonds.
Wade W. Slome, CFA, CFP®
Plan. Invest. Prosper.
DISCLOSURE: Sidoxia Capital Management (SCM) and some of its clients hold positions in certain exchange traded funds (ETFs), but at the time of publishing SCM had no direct position in any other security referenced in this article. No information accessed through the Investing Caffeine (IC) website constitutes investment, financial, legal, tax or other advice nor is to be relied on in making an investment or other decision. Please read disclosure language on IC Contact page.


