Posts tagged ‘EPS’
Stocks Soar as Profits Roar

The Geopolitical Dilemma: Iran Gone Wrong
It has been a volatile and unsettling period in the Middle East. Following more than a month of continuous bombing in Iran, the United States reached a tenuous ceasefire. While the active conflict has paused, the U.S. continues to maintain a financially crippling blockade against the Iranian regime.
If that geopolitical stress isn’t enough, oil prices remain elevated at $105 per barrel (WTI), roughly 57% above levels seen before the bombings began. Furthermore, gasoline prices hovering around the $4.40 per gallon threshold are acting like a brake that is slowing down global economic activity.
On the surface, this negative narrative sounds like a disastrous backdrop for financial markets. Yet, last month’s stock market performance tells a completely different story:
· S&P 500: +10.4%
· NASDAQ: +15.3%
· Dow Jones Industrial Average: +7.1%
Why the Disconnect?
Followers of my firm, Sidoxia Capital Management, and my blog, Investing Caffeine, know that geopolitics are rarely the primary drivers of long-term stock performance. Instead, we look to the “four legs of the Sidoxia stool”: profits, interest rates, valuations, and sentiments. For a deeper dive, check out my article: Don’t Be a Fool, Follow the Stool. The vital leg supporting the recent move in stocks has been soaring profits. As illustrated by data from Yardeni.com, S&P 500 profits (red line) are accelerating at a much steeper pace than those of the S&P 400 MidCap (blue line) and S&P 600 SmallCap (green line).
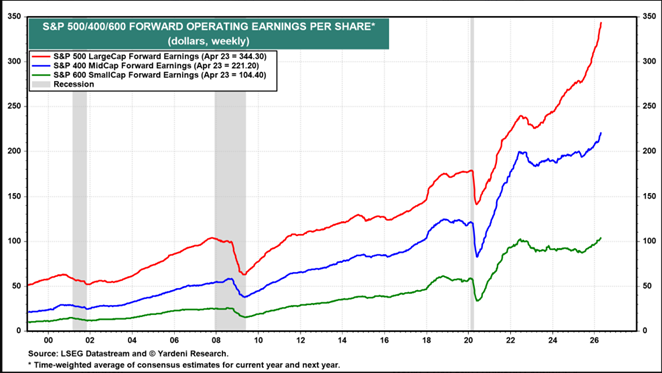
Source: Yardeni.com
A major contributor to this profit expansion is rising profit margins. Today, companies are earning a profit of approximately11 cents per dollar of sales, compared to just 5.5 cents during the 1970s and 1980s. The chart below highlights this phenomenon.
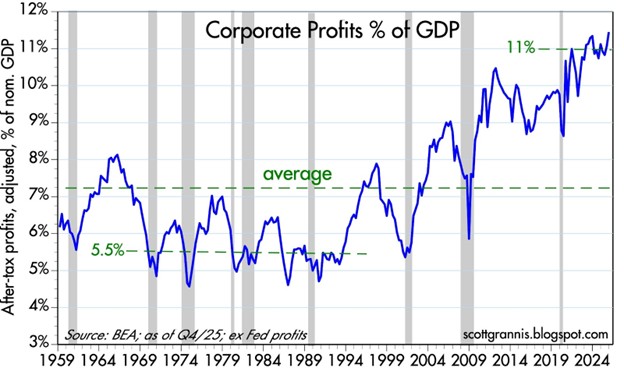
Source: Calafia Beach Pundit
The AI Productivity Revolution
What is driving much of this margin expansion? You guessed it: Artificial Intelligence.
We need to look no further than the mega-cap tech companies that reported Q1 financial results this week (Alphabet, Amazon, Microsoft, and Meta Platforms) to see how AI is helping companies cut costs and grow revenues:
- Combined, these four companies boast a revenue run-rate exceeding $1.7 trillion, with an accelerating growth rate above +22%.
- Meanwhile, headcount growth at these firms has remained virtually flat at < 2%. In fact, Meta and Microsoft recently announced a combined 20,000 in job cuts, raising concerns over an AI labor crisis.
These sales increases and expense reductions help explain last month’s surge in the performance of these stocks:
- Alphabet-Google (GOOGL): +33.9%
- Amazon.com Inc. (AMZN): +27.3%
- Microsoft Corp. (MSFT): +10.2%
- Meta Platforms Inc. (META): +6.8%
AI Driving the IPO Pipeline The AI boom is also creating massive value in the private markets. High-profile expected IPOs – including Elon Musk’s xAI, OpenAI (makers of ChatGPT), and Anthropic – are expected to exceed a combined $2 trillion in valuation. The graphic below shows the gargantuan size of these expected IPOs.
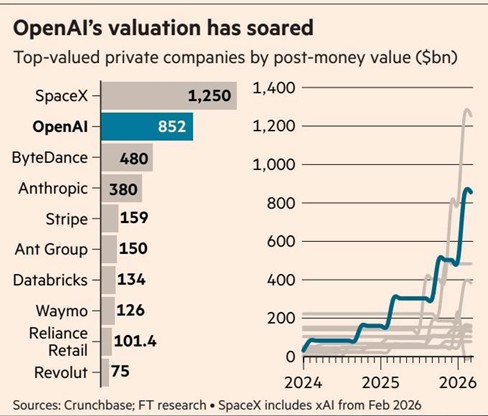
Source: Financial Times
The AI Train is Leaving the Station
AI is impacting every industry and every worker in some way, and this disruptive wave will undoubtedly displace some jobs. However, investors have the opportunity to jump on the train rather than be left behind.
As I noted in my recent article, The Saaspocalypse Has Arrived—or Has It?, if history repeats itself, the rollout of new technologies creates an influx of new industries and jobs that offset initial disruptions. If you work in an industry vulnerable to AI proliferation, taking advantage of the AI profit revolution can help offset potential financial disruption.
Of course, not everything is rainbows and unicorns. The Iranian conflict could still spiral out of control, which could quickly reverse recent stock market gains.
As I recapped for investors last month:
“History reminds us that while geopolitical shocks are terrifying in the moment, their impact on diversified portfolios is almost always temporary… In the world of investing, the best time to stay disciplined is exactly when everyone else is looking for the exit.”
Suffice it to say, geopolitics can and will impact short-term performance, but they rarely dictate long-term trends. When analyzing the market, it is crucial to remember a fundamental truth: When profits roar, stock prices often soar.
Wade W. Slome, CFA, CFP®
Plan. Invest. Prosper.
This article is an excerpt from a previously released Sidoxia Capital Management complimentary newsletter (May 1, 2026). Subscribe Here to view all monthly articles.
DISCLOSURE: Sidoxia Capital Management (SCM) and some of its clients hold positions in GOOGL, META, AMZN, MSFT, and certain exchange traded funds (ETFs), but at the time of publishing had no direct position in any other security referenced in this article. No information accessed through the Investing Caffeine (IC) website constitutes investment, financial, legal, tax or other advice nor is to be relied on in making an investment or other decision. Please read disclosure language on IC Contact page.
Investors Ponder Stimulus Size as Rates Rise

Stock prices rose again last month in part based on passage optimism of a government stimulus package (currently proposed at $1.9 trillion). But the rise happened before stock prices took a breather during the last couple of weeks, especially in hot growth sectors like the technology-heavy QQQ exchange traded fund, which fell modestly by -0.1% in February. As some blistering areas cooled off, investors decided to shift more dollars into the value segment of the stock market (e.g., the Russell 1000 Value index soared +6% last month). Over the same period, the S&P 500 and Dow Jones Industrial Average indexes climbed +2.6% and +3.2%, respectively.
What was the trigger for the late-month sell-off? Many so-called pundits point to a short-term rise in interest rates. While investor anxiety heightened significantly at the end of the month, the S&P 500 dropped a mere -3.5% from all-time record highs after a slingshot jump of +73.9% from the March 2020 lows.
Do Rising Interest Rates = Stock Price Declines?
Conventional wisdom dictates that as interest rates rise, stock prices must fall because higher rates are expected to pump the breaks on economic activity and higher yielding fixed income investments will serve as better alternatives to investing in stocks. Untrue. There are periods of time when stock prices move higher even though interest rates also move higher
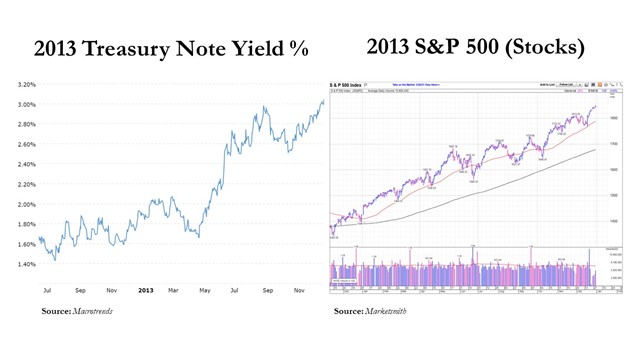
Take 2013 for example – the yield on the benchmark 10-Year Treasury Note climbed from +1.8% to 3.0%, while the S&P 500 index catapulted +29.6% higher (see charts below).
Similarly to now, during 1994 we were still in a multi-decade, down-trending interest rate environment. However, from the beginning of 1994 to the middle of 1995 the Federal Reserve hiked the Federal Funds interest rate target from 3% to 6% (and the 10-Year Treasury yield temporarily climbed from about 6% to 8%), yet stock prices still managed to ascend +17% over that 18-month period. The point being, although rising interest rates are generally bad for asset price appreciation, there are periods of time when stock prices can move higher in synchronization with interest rates.
What’s the Fuss about Stimulus?
One of the factors keeping the stock market afloat near record highs is the prospect of the federal government passing a COVID stimulus package to keep the economic recovery continuing. Even though there is a new administration in the White House, Democrats hold a very narrow majority of seats in Congress, leaving a razor thin margin to pass legislation. This means President Biden needs to keep moderate Democrats like Joe Manchin in check, and/or recruit some Republicans to jump on board to pass his $1.9 trillion COVID stimulus plan. If the bill is passed as proposed, “The relief plan would enhance and extend jobless benefits, provide $350 billion to state and local governments, send $1,400 to many Americans and fund vaccine distribution, among other measures,” according to the Wall Street Journal.
Valuable Vaccines
Fresh off the press, we just received additional good news on the COVID vaccine front. The U.S. Food and Drug Administration (FDA) approved the third vaccine for COVID-19 by Johnson & Johnson (JNJ). This J&J treatment is also the first single-dose vaccine to be distributed, unlike the other two vaccines manufactured by Pfizer Inc. (PFE) and Moderna Inc. (MRNA), which both require two shots. Johnson & Johnson expects to ship four million doses immediately and 20 million doses by the end of March.
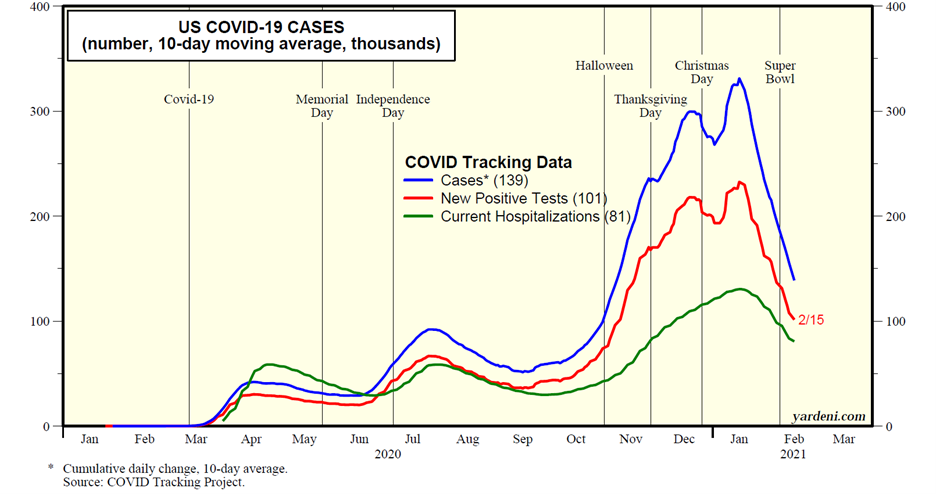
So far, over 50 million doses of the COVID vaccines have been administered, and the White House believes they can go from currently about 1.5 million injections per day to approximately 4 million people per day by the end of March. The combination of the vaccines, mitigation behavior, and a slow march towards herd immunity have resulted in encouraging COVID trends, as you can see from the chart below. However, the bad news is new COVID cases, hospitalizations, and deaths still remain above peak levels experienced last spring and summer.
Revived Recovery
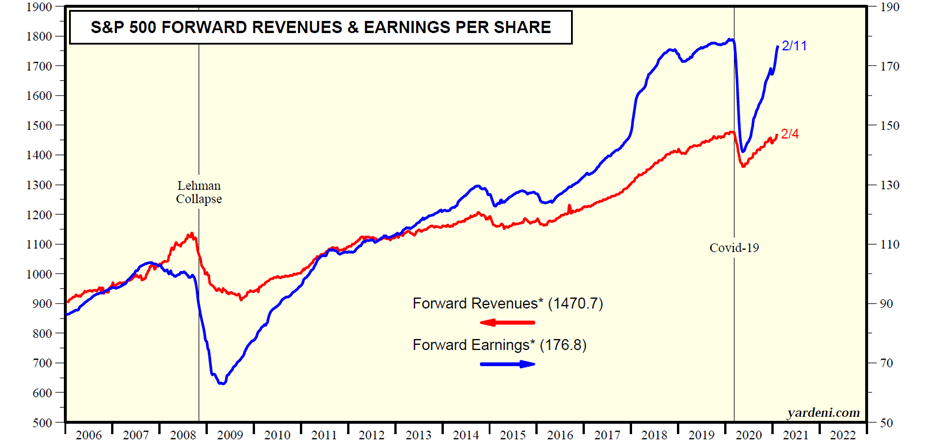
Thanks to the improving COVID trends, a continued economic recovery driven by reopenings, along with fiscal and monetary stimulus, business profits and revenues have effectively recovered all of the 2020 pandemic losses within a year (see chart below).
But with elevated stock prices have come elevated speculation, which we have seen bubble up in various forms. With the rising tide of new investors flooding onto new trading platforms like Robinhood, millions of individuals are placing speculative bets in areas like Bitcoin; new SPACs (Special Purpose Acquisition Companies); overpriced, money-losing cloud software companies; and social media recommended stocks found on Reddit’s WallStreetBets like GameStop (GME), which was up +150% alone last week. At Sidoxia Capital Management, we don’t spend a lot of time chasing the latest fad or stock market darling. Nevertheless, as long-term investors, we continue to find attractively valued investment opportunities that align with our clients’ objectives and constraints.
Overall, the outlook for the end of this pandemic looks promising as multiple COVID vaccines get administered, and the economic recovery gains steam with the help of reopenings and stimulus. If rising interest rates and potential inflation accelerate, these factors could slow the pace of the recovery and limit future stock market returns. However, if you follow a systematic, disciplined, long-term investment plan, like we implement at Sidoxia, you will be in a great position to prosper financially over the long-run.

Wade W. Slome, CFA, CFP®
Plan. Invest. Prosper.
This article is an excerpt from a previously released Sidoxia Capital Management complimentary newsletter (March 1, 2021). Subscribe on the right side of the page for the complete text.
DISCLOSURE: Sidoxia Capital Management (SCM) and some of its clients hold positions in MRNA, PFE, and certain exchange traded funds (ETFs), but at the time of publishing had no direct position in GME, JNJ, or any other security referenced in this article. No information accessed through the Investing Caffeine (IC) website constitutes investment, financial, legal, tax or other advice nor is to be relied on in making an investment or other decision. Please read disclosure language on IC Contact page.
Trade War Bark: Hold Tight or Nasty Bite?

In recent weeks, President Trump has come out viciously barking about potential trade wars, not only with China, but also with other allies, including key trade collaborators in Europe, Canada, and Mexico. What does this all mean? Should you brace for a nasty financial bite in your portfolio, or should you remain calm and hold tight?
Let’s take a closer look. Recent talks of trade wars and tit-for-tat retaliations have produced mixed results for the stock market. For the month, the S&P 500 index advanced +0.5% (+1.7% year-to-date), while the Dow Jones Industrial Average modestly retreated -0.6% (-1.8% YTD). Despite trade war concerns and anxiety over a responsibly cautious Federal Reserve increasing interest rates, the economy remains strong. Not only is unemployment at an impressively low level of 3.8% (tying the lowest rate seen since 1969), but corporate profits are at record levels, thanks to a healthy economy and stimulative tax cuts. Consumers are feeling quite well regarding their financial situation too. For instance, household net worth has surpassed $100 trillion dollars, while debt ratios are declining (see chart below).
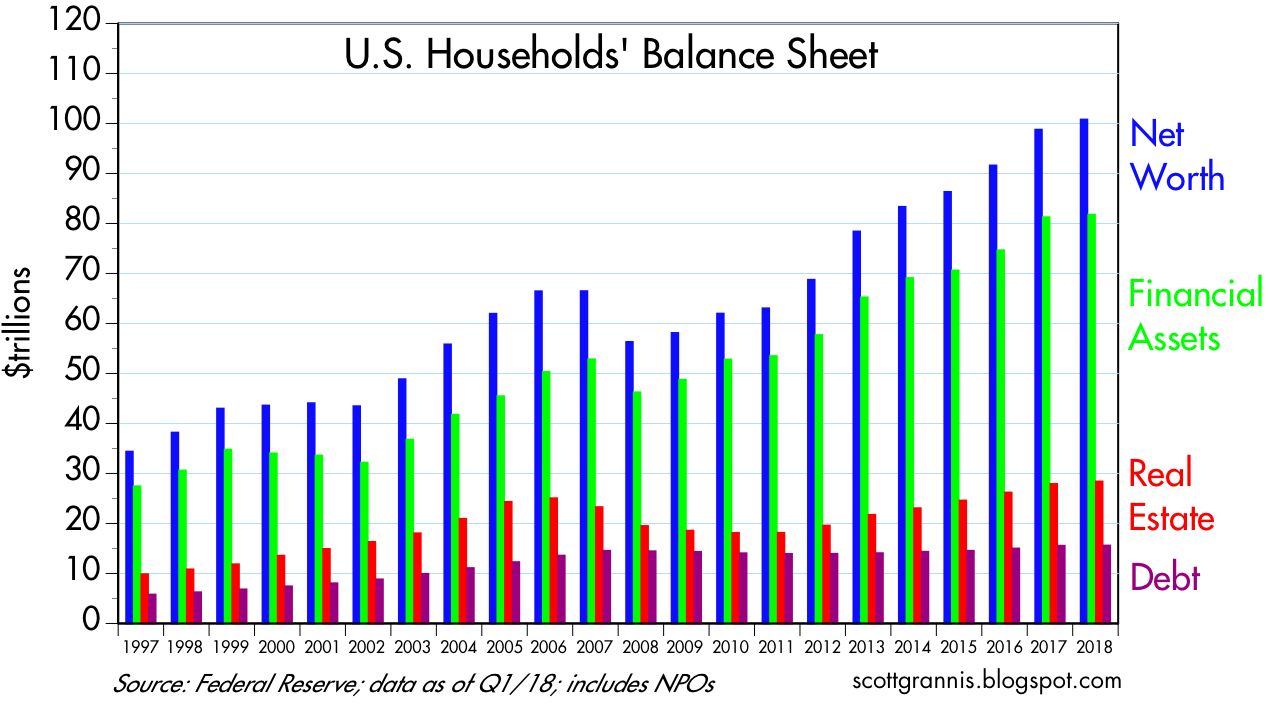
Source: Scott Grannis
Although trade is presently top-of-mind among many investors, a lot of the fiery rhetoric emanating from Washington should come as no surprise. The president heavily campaigned on the idea of reducing uniform unfair Chinese trade policies and leveling the trade playing field. It took about a year and a half before the president actually pulled out the tariff guns. The first $50 billion tariff salvo has been launched by the Trump administration against China, and an additional $200 billion in tariffs have been threatened. So far, Trump has enacted tariffs on imported steel, aluminum, solar panels, washing machines and other Chinese imports.
It’s important to understand, we are in the very early innings of tariff implementation and trade negotiations. Therefore, the scale and potential impact from tariffs and trade wars should be placed in the proper context relative to our $20 trillion U.S. economy (annual Gross Domestic Product) and the $16 trillion in annual global trade.
Stated differently, even if the president’s proposed $50 billion in Chinese tariffs quadruples in value to $200 billion, the impact on the overall economy will be minimal – less than 1% of the total. Even if you go further and consider our country’s $375 billion trade deficit with China for physical goods (see chart below), significant reductions in the Chinese trade deficit will still not dramatically change the trajectory of economic growth.
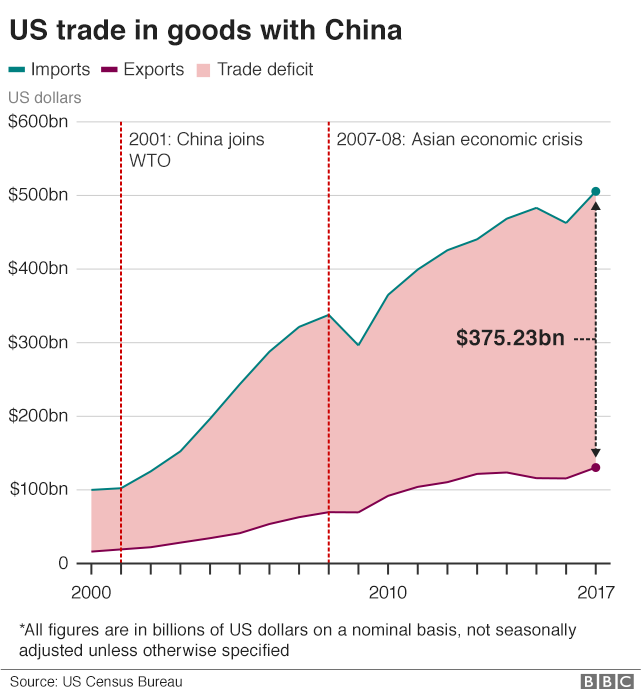
Source: BBC
The Tax Foundation adds support to the idea that current tariffs should have minimal influence:
“The tariffs enacted so far by the Trump administration would reduce long-run GDP by 0.06 percent ($15 billion) and wages by 0.04 percent and eliminate 48,585 full-time equivalent jobs.”
Of course, if the China trade skirmish explodes into an all-out global trade war into key regions like Europe, Mexico, Canada, and Japan, then all bets are off. Not only would inflationary pressures be a drag on the economy, but consumer and business confidence would dive and they would drastically cut back on spending and negatively pressure the economy.
Most investors, economists, and consumers recognize the significant benefits accrued from free trade in the form of lower-prices and a broadened selection. In the case of China, cheaper Chinese imports allow the American masses to buy bargain toys from Wal-Mart, big-screen televisions from Best Buy, and/or leading-edge iPhones from the Apple Store. Most reasonable people also understand these previously mentioned consumer benefits can be somewhat offset by the costs of intellectual property/trade secret theft and unfair business practices levied on current and future American businesses doing business in China.
Trump Playing Chicken
Right now, Trump is playing a game of chicken with our global trading partners, including our largest partner, China. If his threats of imposing stiffer tariffs and trade restrictions result in new and better bilateral trade agreements (see South Korean trade deal), then his tactics could prove beneficial. However, if the threat and imposition of new tariffs merely leads to retaliatory tariffs, higher prices (i.e., inflation), and no new deals, then this mutually destructive outcome will likely leave our economy worse off.
Critics of Trump’s tariff strategy point to the high profile announcement by Harley-Davidson to move manufacturing production from the United States to overseas plants. Harley made the decision because the tariffs are estimated to cost the company up to $100 million to move production overseas. As part of this strategy, Harley has also been forced to consider motorcycle price hikes of $2,200 each. On the other hand, proponents of Trump’s trade and economic policies (i.e., tariffs, reduced regulations, lower taxes) point to the recent announcement by Foxconn, China’s largest private employer. Foxconn works with technology companies like Apple, Amazon, and HP to help manufacture a wide array of products. Due to tax incentives, Foxconn is planning to build a $10 billion plant in Wisconsin that will create 13,000 – 15,000 high-paying jobs. Wherever you stand on the political or economic philosophy spectrum, ultimately Americans will vote for the candidates and policies that benefit their personal wallets/purses. So, if retaliatory measures by foreign countries introduces inflation and slowly grinds trade to a halt, voter backlash will likely result in politicians being voted out of office due to failed trade policies.
Source: Dr. Ed’s Blog
Time will tell whether the current trade policies and actions implemented by the current administration will lead to higher costs or greater benefits. Talk about China tariffs, NAFTA (North American Free Trade Agreement), TPP (Trans Pacific Partnership), and other reciprocal trade negotiations will persist, but these trading relationships are extremely complex and will take a long time to resolve. While I am explicitly against tariff policies in general, I am not an alarmist or doomsayer, at this point. Currently, the trade war bark is worse than the bite. If the situation worsens, the history of politics proves nothing is permanent. Circumstances and opinions are continually changing, which highlights why politics has a way of improving or changing policies through the power of the vote. While many news stories paint a picture of imminent, critical tariff pain, I believe it is way too early to come to that conclusion. The economy remains strong, corporate profits are at record levels (see chart above), interest rates remain low historically, and consumers overall are feeling better about their financial situation. It is by no means a certainty, but if improved trade agreements can be established with our key trading partners, fears of an undisciplined barking and biting trade dog could turn into a tame smooching puppy that loves trade.

Wade W. Slome, CFA, CFP®
Plan. Invest. Prosper.
This article is an excerpt from a previously released Sidoxia Capital Management complimentary newsletter (July 3, 2018). Subscribe on the right side of the page for the complete text.
DISCLOSURE: Sidoxia Capital Management (SCM) and some of its clients hold positions in AAPL, AMZN, and certain exchange traded funds (ETFs), but at the time of publishing had no direct position in WMT, HOG, HPQ, or any other security referenced in this article. No information accessed through the Investing Caffeine (IC) website constitutes investment, financial, legal, tax or other advice nor is to be relied on in making an investment or other decision. Please read disclosure language on IC Contact page.
The EPS House of Cards: Tricks of the Trade

As we enter the quarterly ritual of the tsunami of earnings reports, investors will be combing through the financial reports. Due to the flood of information, and increasingly shorter and shorter investment time horizons, much of investors’ focus will center on a few quarterly report metrics – primarily earnings per share (EPS), revenues, and forecasts/guidance (if provided).
Many lessons have been learned from the financial crisis over the last few years, and one of the major ones is to do your homework thoroughly. Relying on a AAA ratings from Moody’s (MCO) and S&P (when ratings should have been more appropriately graded D or F) or blindly following a “Buy” rating from a conflicted investment banking firm just does not make sense.
FINANCIAL SECTOR COLLAPSE
Given the severity of the losses, investors need to be more demanding and comprehensive in their earnings analysis. In many instances the reported earnings numbers resemble a deceptive house of cards on a weak foundation, merely overlooked by distracted investors. Case in point is the Financial sector, which before the financial collapse saw distorted multi-year growth, propelled by phantom earnings due to artificial asset inflation and excessive leverage. One need look no further than the weighting of Financial stocks, which ballooned from 5% of the total S&P 500 Index market capitalization in 1980 to a peak of 23% in 2007. Once the credit and real estate bubble burst, the sector subsequently imploded to around 9% of the index value around the March 2009 lows. Let’s be honest, and ask ourselves how much faith can we put in the Financial sector earnings figures that moved from +$22.79 in 2007 to a loss of -$21.24 in 2008? Since that time regulation and reform has put the sector on a more solid footing. Luckily, the opacity and black box nature of many of these Financials largely kept me out of the 2009 sector implosion.
WHAT TO WATCH FOR
But the Financial sector is not the only fuzzy areas of accounting manipulation. Thanks to our friends at the FASB (Financial Accounting Standards Board), company management teams have discretion in how they apply different GAAP (Generally Accepted Accounting Principles) rules. Saj Karsan, a contributing writer at Morningstar.com, also writes about the “Fallacy of Earnings Per Share.”
“EPS can fluctuate wildly from year to year. Writedowns, abnormal business conditions, asset sale gains/losses and other unusual factors find their way into EPS quite often. Investors are urged to average EPS over a business cycle, as stressed in Security Analysis Chapter 37, in order to get a true picture of a company’s earnings power.”
These gray areas of interpretation can lead to a range of distorted EPS outcomes. Here are a few ways companies can manipulate their EPS:
Distorted Expenses: If a $10 million manufacturing plant is expected to last 10 years, then the depreciation expense should be $1 million per year. If for some reason the Chief Financial Officer (CFO) suddenly decided the building would last 40 years rather than 10 years, then the expense would only be $250,000 per year. Voila, an instant $750,000 annual gain was created out of thin air due to management’s change in estimates.
Magical Revenues: Some companies have been known to do what’s called “stuffing the channel.” Or in other words, companies sometimes will ship product to a distributor or customer even if there is no immediate demand for that product. This practice can potentially increase the revenue of the reporting company, while providing the customer with more inventory on-hand. The major problem with the strategy is cash collection, which can be pushed way off in the future or become uncollectible.
Accounting Shifts: Under certain circumstances, specific expenses can be converted to an asset on the balance sheet, leading to inflated EPS numbers. A common example of this phenomenon occurs in the software industry, where software engineering expenses on the income statement get converted to capitalized software assets on the balance sheet. Again, like other schemes, this practice delays the negative expense effects on reported earnings.
Artificial Income: Not only did many of the trouble banks make imprudent loans to borrowers that were unlikely to repay, but the loans were made based on assumptions that asset prices would go up indefinitely and credit costs would remain freakishly low. Based on the overly optimistic repayment and loss assumptions, banks recognized massive amounts of gains which propelled even more imprudent loans. Needless to say, investors are now more tightly questioning these assumptions. That said, recent relaxation of mark-to-market accounting makes it even more difficult to estimate the true values of assets on the bank’s balance sheets.
Like dieting, there are no easy solutions. Tearing through the financial statements is tough work and requires a lot of diligence. My process of identifying winning stocks is heavily cash flow based (see my article on cash flow investing) analysis, which although lumpier and more volatile than basic EPS analysis, provides a deeper understanding of a company’s value-creating capabilities and true cash generation powers.
As earnings season kicks into full gear, do yourself a favor and not only take a more critical” eye towards company earnings, but follow the cash to a firmer conviction in your stock picks. Otherwise, those shaky EPS numbers may lead to a tumbling house of cards.
Read Saj Karsan’s Full Article
Wade W. Slome, CFA, CFP®
Plan. Invest. Prosper.
DISCLOSURE: Sidoxia Capital Management has no direct position in MCO or MHP at the time this article was originally posted. No information accessed through the Investing Caffeine (IC) website constitutes investment, financial, legal, tax or other advice nor is to be relied on in making an investment or other decision. Please read disclosure language on IC “Contact” page.
Operating Earnings: Half-Empty or Half-Full?

A continual debate goes on between bulls and bears about which earnings metric is more important: reported earnings based on GAAP (Generally Accepted Accounting Principles) or “operating earnings,” which exclude one-time charges and gains, along with non-cash charges, such as options expenses. Bulls generally prefer operating earnings (glass half-full) because they are typically higher than GAAP earnings (glass half-empty), and therefore operating earnings make valuation metrics more attractive. This disparity between earnings choice is even broader over the last few years due to the massive distortions created by the financial crisis – gigantic write-downs at the vast majority of financial institutions and enormous restructurings at non-financial companies.
Options Smoptions
The options expense issue can also become a religious argument, similar to the paradoxical question that asks if God can create a rock big enough that he himself cannot budge? Logic would dictate that operating earnings should adequately account for option issuance in the denominator of the earnings per share calculation (Net Income / Shares Outstanding). As far as I’m concerned, the GAAP method reducing the numerator of EPS (Earnings Per Share) with an expense, and increasing the denominator by increasing shares from option issuance is merely double counting the expense, thereby distorting reality. Reading through an annual report and/or proxy may not be a joyous experience, but the exercise will help you triangulate share issuance estimates to forecast the drag on future EPS.
On a trailing 12-month basis (Sep’09 – Sep’10), Standard & Poor’s calculated reported earnings with about a -9% differential from operating earnings, equating to approximately a 1.5 Price/Earnings multiple point differential (17.8x’s for reported earnings and 16.2 x’s for operating earnings). For the half-glass full bulls, the picture looks even prettier based on 2011 operating earnings forecasts – the S&P 500 index is priced at roughly 13.6x’s the 2011 index earnings value of $95.45.
Forward More Important Than Backwards
As I make the case in my P/E binoculars article, the market is like a game of chess – a good player doesn’t care nearly as much about an opponent’s last moves as he/she cares about the opponent’s future moves. Financial markets operate in the same fashion, future earnings are much more important than prior earnings. From a practical standpoint, GAAP earnings are relatively useless. Market purists can evangelize about the merits of GAAP earnings until they are blue in the face, but the fact of the matter is that investors are whipping prices all over the place based on Wall Street EPS forecasts – based on operating earnings (not GAAP). In many instances, especially throughout much of the financial crisis, operating earnings will more closely align with the cash flows of a company relative to GAAP earnings, but detailed fundamental analysis is needed.
As far as I’m concerned, much of this GAAP vs Non-GAAP earnings debate is moot because both reported earnings and operating earnings can both be manipulated and distorted. I prefer using cash flows (see Cash Flow Statement article) because cash register accounting – the analysis of money coming in and out of a company – limits the ability of bean counters to use smoke and mirror strategies traditionally saved for the income statement. In other words, you cannot compensate employees, do acquisitions, distribute dividends, or buyback stock with GAAP earnings…all these functions require cold, hard cash. The key metric, rather than EPS, should be free cash flow per share. Growth companies with high return prospects should be given some leeway, but if the projects don’t earn a return, eventually cash resources will dry up. When EPS is materially higher than free cash flow per share, yellow flags fly up and I do additional research to understand the dynamics causing the differential.
These earnings-based arguments will likely never get resolved, but if investors focus on bottom-up analysis on individual security cash flows, determining whether the glass is half-empty or half-full will become much easier.
Wade W. Slome, CFA, CFP®
Plan. Invest. Prosper.
DISCLOSURE: Sidoxia Capital Management (SCM) and some of its clients own certain exchange traded funds, but at the time of publishing SCM had no direct position in any security referenced in this article. The trailing 12 month data was calculated by S&P as of 1/19/2011. Forward 2011 operating earnings were calculated as of 1/18/2011. No information accessed through the Investing Caffeine (IC) website constitutes investment, financial, legal, tax or other advice nor is to be relied on in making an investment or other decision. Please read disclosure language on IC “Contact” page.
EPS House of Cards: Tricks of the Trade
As we enter the quarterly ritual of the tsunami of earnings reports, investors will be combing through the financial reports. Due to the flood of information, and increasingly shorter and shorter investment time horizons, much of investors’ focus will center on a few quarterly report metrics – primarily earnings per share (EPS), revenues, and forecasts/guidance (if provided).
Many lessons have been learned from the financial crisis over the last few years, and one of the major ones is to do your homework thoroughly. Relying on a AAA ratings from Moody’s (MCO) and S&P (when ratings should have been more appropriately graded D or F) or blindly following a “Buy” rating from a conflicted investment banking firm just does not make sense.
FINANCIAL SECTOR COLLAPSE
Given the severity of the losses, investors need to be more demanding and comprehensive in their earnings analysis. In many instances the reported earnings numbers resemble a deceptive house of cards on a weak foundation, merely overlooked by distracted investors. Case in point is the Financial sector, which before the financial collapse saw distorted multi-year growth, propelled by phantom earnings due to artificial asset inflation and excessive leverage. One need look no further than the weighting of Financial stocks, which ballooned from 5% of the total S&P 500 Index market capitalization in 1980 to a peak of 23% in 2007. Once the credit and real estate bubble burst, the sector subsequently imploded to around 9% of the index value around the March 2009 lows. Let’s be honest, and ask ourselves how much faith can we put in the Financial sector earnings figures that moved from +$22.79 in 2007 to a loss of -$21.24 in 2008? Current forecasts for the sector are looking for a rebound back up to +$11.91 in 2010. Luckily, the opacity and black box nature of many of these Financials largely kept me out of the 2009 sector implosion.
WHAT TO WATCH FOR
But the Financial sector is not the only fuzzy areas of accounting manipulation. Thanks to our friends at the FASB (Financial Accounting Standards Board), company management teams have discretion in how they apply different GAAP (Generally Accepted Accounting Principles) rules. Saj Karsan, a contributing writer at Morningstar.com, also writes about the “Fallacy of Earnings Per Share.”
“EPS can fluctuate wildly from year to year. Writedowns, abnormal business conditions, asset sale gains/losses and other unusual factors find their way into EPS quite often. Investors are urged to average EPS over a business cycle, as stressed in Security Analysis Chapter 37, in order to get a true picture of a company’s earnings power.”
These gray areas of interpretation can lead to a range of distorted EPS outcomes. Here are a few ways companies can manipulate their EPS:
Distorted Expenses: If a $10 million manufacturing plant is expected to last 10 years, then the depreciation expense should be $1 million per year. If for some reason the Chief Financial Officer (CFO) suddenly decided the building would last 40 years rather than 10 years, then the expense would only be $250,000 per year. Voila, an instant $750,000 annual gain was created out of thin air due to management’s change in estimates.
Magical Revenues: Some companies have been known to do what’s called “stuffing the channel.” Or in other words, companies sometimes will ship product to a distributor or customer even if there is no immediate demand for that product. This practice can potentially increase the revenue of the reporting company, while providing the customer with more inventory on-hand. The major problem with the strategy is cash collection, which can be pushed way off in the future or become uncollectible.
Accounting Shifts: Under certain circumstances, specific expenses can be converted to an asset on the balance sheet, leading to inflated EPS numbers. A common example of this phenomenon occurs in the software industry, where software engineering expenses on the income statement get converted to capitalized software assets on the balance sheet. Again, like other schemes, this practice delays the negative expense effects on reported earnings.
Artificial Income: Not only did many of the trouble banks make imprudent loans to borrowers that were unlikely to repay, but the loans were made based on assumptions that asset prices would go up indefinitely and credit costs would remain freakishly low. Based on the overly optimistic repayment and loss assumptions, banks recognized massive amounts of gains which propelled even more imprudent loans. Needless to say, investors are now more tightly questioning these assumptions. That said, recent relaxation of mark-to-market accounting makes it even more difficult to estimate the true values of assets on the bank’s balance sheets.
Like dieting, there are no easy solutions. Tearing through the financial statements is tough work and requires a lot of diligence. My process of identifying winning stocks is heavily cash flow based (see my article on cash flow investing) analysis, which although lumpier and more volatile than basic EPS analysis, provides a deeper understanding of a company’s value-creating capabilities and true cash generation powers.
As earnings season kicks into full gear, do yourself a favor and not only take a more critical” eye towards company earnings, but follow the cash to a firmer conviction in your stock picks. Otherwise, those shaky EPS numbers may lead to a tumbling house of cards.
Read Saj Karsan’s Full Article
Wade W. Slome, CFA, CFP®
Plan. Invest. Prosper.
DISCLOSURE: Sidoxia Capital Management has no direct position in MCO or MHP at the time this article was originally posted. No information accessed through the Investing Caffeine (IC) website constitutes investment, financial, legal, tax or other advice nor is to be relied on in making an investment or other decision. Please read disclosure language on IC “Contact” page.


