Posts tagged ‘earnings growth’
Glass Half Empty Becomes Record Glass Half Full

Oh my! What a difference a few months makes. Originally, what looked like an economic glass half empty in December has turned into a new record glass half full. What looked like Armageddon in December has turned into a v-shaped bed of roses to new all-time record stock market highs for the S&P 500 index (see chart below). For the recent month, the S&P 500 climbed another +3.9% to 2,945, bringing total 2019 gains to an impressive +17.5% advance. Before you get too excited, it’s worth noting stocks were down in value during 2018. When you combine 2018-2019, appreciation over the last 16 months equates to a more modest +10.2% expansion. Worth noting, since the end of 2017, profits have climbed by more than +20%, which means stocks are cheaper today as measured by Price-Earnings ratios (P/E) than two years ago (despite the historic, record levels). For any confused investors, we can revisit this topic for discussion in a future writing.

Source: Trading Economics
From Famine to Feast
As I noted in my “December to Remember” article, there were no shortage of concerns ranging from impeachment to Brexit. How do those concerns look now? Let’s take a look:
Government Shutdown: The longest government shutdown in history (35 days) ended on January 25, 2019 with minimal broad-based economic damage.
Global Trade (China): Rhetoric coming from President Trump and his administration regarding a trade deal resolution with China has been rather optimistic. In fact, a CNBC survey shows 77% of respondents believe that the U.S. and China will complete a trade deal.
Federal Reserve Interest Rate Policy: After consistently increasing interest rates nine times since the end of 2015 until late 2018, Federal Reserve Chairman Jerome Powell signaled he was effectively taking monetary policy off rate-hiking “autopilot” and would in turn become “patient” as it relates to increasing future interest rates. Interestingly, traders are now forecasting a 70% chance of a rate cut before January 29, 2020.
Mueller Investigation: Special counsel Robert Mueller released his widely anticipated report that investigated Russian collusion and obstruction allegations by the president and his administration. In Mueller’s 22-month report he could “not establish that members of the Trump Campaign conspired or coordinated with the Russian government in its election interference activities.” As it relates to obstruction, Mueller effectively stated the president attempted to obstruct justice but was not successful in achieving that goal. Regardless of your political views, uncertainty surrounding this issue has been mitigated.
New Balance of Power in Congress: Democrats took Congressional control of the House of Representatives and reintroduced gridlock. But followers of mine understand gridlock is not necessarily a bad thing.
Brexit Deal Uncertainty: After years of negotiations for Britain to exit the European Union (EU), the impending Brexit deadline of March 29th came and went. EU an UK leaders have now agreed to extend the deadline to October 31st, thereby delaying any potential negative impact from a hard UK exit from the EU.
Recession Fears: Fears of a fourth quarter global slowdown that would bleed to a recession on U.S. soil appear to have been laid to bed. The recently reported first quarter economic growth (Gross Domestic Product – GDP) figures came in at a healthy+3.2% annualized growth rate, up from fourth quarter growth of +2.2%, and above consensus forecasts of 2.0%.
Curve Concern
The other debate swirling around the investment community this month was the terrifying but wonky “inverted yield curve.” What is an inverted yield curve? This is a financial phenomenon, when interest rate yields on long-term bonds are lower than interest rate yields on short-term bonds. Essentially when these dynamics are in place, bond investors are predicting slower economic activity in the future (i.e., recession). The lower future rates effectively act as a way to stimulate prospective growth amid expected weak economic activity. Furthermore, lower future rates are a symptom of stronger demand for longer-term bonds. It’s counterintuitive for some, but higher long-term bond prices result in lower long-term bond interest rate yields. If this doesn’t make sense, please read this. Why is all this inverted yield curve stuff important? From World War II, history has informed us that whenever this phenomenon has occurred, it has been a great predictor for a looming recession.
As you can see from the chart below, whenever the yield curve (red line) inverts (goes below zero), you can see that a recession (gray vertical bar) occurs shortly thereafter. In other words, an inverted yield curve historically has been a great way to predict recessions, which normally is almost an impossible endeavor – even for economists, strategists, and investment professionals.

Source: Calafia Beach Pundit
Although the curve inverted recently (red line below 0), you can see from the chart, historically recessions (gray vertical bars) have occurred only when inflation-adjusted interest rates (blue line) have climbed above 2%. Well, the data clearly shows inflation-adjusted interest rates are still well below 1%, therefore an impending recession may not occur too soon. Time will tell if these historical relationships will hold, but rest assured this is a dynamic I will be following closely.
It has been a crazy 6-9 months in the stock market with price swings moving 20% in both directions (+/-), but it has become increasingly clear that a multitude of 2018 fears causing the glass to appear half empty have now abated. So long as economic growth continues at a healthy clip, corporate profits expand to (remain at) record levels, and the previously mentioned concerns don’t spiral out of control, then investors can credibly justify these record levels…as they peer into a glass half full.

Wade W. Slome, CFA, CFP®
Plan. Invest. Prosper.
This article is an excerpt from a previously released Sidoxia Capital Management complimentary newsletter (May 1, 2019). Subscribe on the right side of the page for the complete text.
DISCLOSURE: Sidoxia Capital Management (SCM) and some of its clients hold positions and certain exchange traded funds (ETFs), but at the time of publishing had no direct position in any other security referenced in this article. No information accessed through the Investing Caffeine (IC) website constitutes investment, financial, legal, tax or other advice nor is to be relied on in making an investment or other decision. Please read disclosure language on IC Contact page.
Stocks Take a Breather after Long Sprint

Like a sprinter running a long sprint, the stock market eventually needs to take a breather too, and that’s exactly what investors experienced this week as they witnessed the Dow Jones Industrial Average face its largest drop of 2013 (down -2.2%) – and also the largest weekly slump since 2012. Runners, like financial markets, sooner or later suffer fatigue, and that’s exactly what we’re seeing after a relatively unabated +27% upsurge over the last nine months. Does a -2% hit in one week feel pleasant? Certainly not, but before the next race, the markets need to catch their breath.
By now, investors should not be surprised that pitfalls and injuries are part of the investment racing game – something Olympian Mary Decker Slaney can attest to as a runner (see 1984 Olympic 3000m final against Zola Budd). As I have pointed out in previous articles (Most Hated Bull Market), the almost tripling in stock prices from the 2009 lows has not been a smooth, uninterrupted path-line, but rather investors have endured two corrections averaging -20% and two other drops approximating -10%. Instead of panicking by locking in damaging transaction costs, taxes, and losses, it is better to focus on earnings, cash flows, valuations, and the relative return available in alternative asset classes. With generationally low interest rates occurring over recent periods, the available subset of attractive investment opportunities has narrowed (see Confessions of a Bond Hater), leaving many investing racers to default to stocks.
Recent talk of potential Federal Reserve bond purchase “tapering” has led to a two-year low in bond prices and caused a mini spike in interest rates (10-year Treasury note currently yielding +2.83%). At the margin, this trend makes bonds more attractive (lower prices), but as you can see from the chart below, interest rates are still relatively close to historically low yields. For the time being, this still makes domestic equities an attractive asset class.
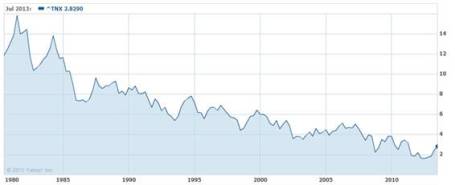
Source: Yahoo! Finance
Price Follows Earnings
The simple but true axiom that stock prices follow earnings over the long-run is just as true today as it was a century ago. Interest rates and price-earnings ratios can also impact stock prices. To illustrate my argument, let’s talk baseball. Wind, rain, and muscle (interest rates, PE ratios, political risk, etc.) are factors impacting the direction of a thrown baseball (stock prices), but gravity is the key factor influencing the ultimate destination of the baseball. Long-term earnings growth is the equivalent factor to gravity when talking about stock prices.
To buttress my point that stock prices following long-term earnings, consider the fact that S&P 500 annualized operating earnings bottomed in 2009 at $39.61. Since that point, annualized earnings through the second quarter of 2013 (~94% of companies reported results) have reached $99.30, up +151%. S&P 500 stock prices bottomed at 666 in 2009, and today the index sits at 1655, +148%. OK, so earnings are up +151% and stock prices are up +148%. Coincidence? Perhaps not.
If we take a closer look at earnings, the deceleration of earnings growth is unmistakable (see Financial Times chart below), yet the S&P 500 index is still up +16% this year, excluding dividends. In reality, predicting multiple expansion or contraction is nearly impossible. For example, earnings in the S&P 500 grew an incredible +15% in 2011, yet stock prices were anemically flat for that year, showing no price appreciation (+0.0%). Since the end of 2011, earnings have risen a meager +3%, however stock prices have catapulted +32%. Is this multiple expansion sustainable? Given stock P/E ratios remain in a reasonable 15-16x range, according to forward and trailing earnings, there is some room for expansion, but the low hanging fruit has been picked and further double-digit price appreciation will require additional earnings growth.
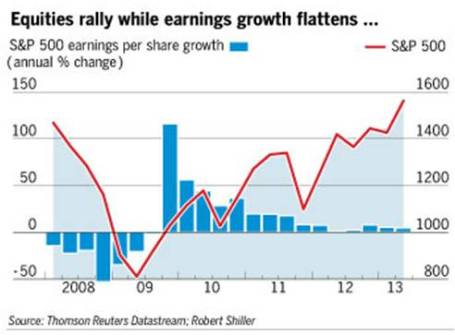
Source: Financial Times
But stocks should not be solely looked through a domestic lens…there is another 95% of the world’s population slowly embracing capitalism and democracy to fuel future dynamic earnings growth. At Sidoxia (www.Sidoxia.com), we are finding plenty of opportunities outside our U.S. borders, including alternative asset classes.
The investment race continues, and taking breathers is part of the competition, especially after long sprints. Rather than panic, enjoy the respite.
Wade W. Slome, CFA, CFP®
Plan. Invest. Prosper.
DISCLOSURE: Sidoxia Capital Management (SCM) and some of its clients hold positions in certain exchange traded funds (ETFs), but at the time of publishing, SCM had no direct position in any other security referenced in this article. No information accessed through the Investing Caffeine (IC) website constitutes investment, financial, legal, tax or other advice nor is to be relied on in making an investment or other decision. Please read disclosure language on IC Contact page.
Box Wine, Facebook and PEG Ratios

I’m no wine connoisseur, but I do know I would pay more for a bottle of Dom Pérignon champagne than I would pay for a container of Franzia box wine. In the world of stocks, the quality disparity is massive too. In order to navigate the virtually infinite number of stocks, we need to have an instrument in our toolbox that can assist us in accurately comparing stocks across the quality spectrum. Thank goodness we have the handy PEG ratio (Price/Earnings to Growth) that elegantly marries the price paid for a stock (as measured by the P/E ratio) with the relative quality of the stock (as measured by its future earnings growth rate).

Famed investor Peter Lynch (see Inside the Brain of an Investing Genius) understood the PEG concept all too well as he used this tool religiously in valuing and analyzing different companies. Given that Lynch earned a +29% annual return from 1977-1990, I’ll take his word for it that the PEG ratio is a useful tool. As highlighted by Lynch (and others), the key factor in using the PEG ratio is to identify companies that trade with a PEG ratio of less than 1. All else equal, the lower the ratio, the better potential for future price appreciation. Facebook Vs. Eastman Kodak
To illustrate the concept of how a PEG ratio can be used to compare stocks with two completely different profiles, let’s start by answering a few questions. Would a rational investor pay the same price (i.e., Price-Earnings [P/E] ratio) for a company with skyrocketing profits as they would for a company going into bankruptcy? Look no further than the lofty expected P/E multiple to be afforded to the shares of the widely anticipated Facebook (FB) initial public offering (IPO). That same rational investor is unlikely to pay the same P/E multiple for a money losing company like Eastman Kodak Co. (EKDKQ.PK) that faces product obsolescence. The contrasting values for these two companies are stark. Some pundits are projecting that Facebook shares could fetch upwards of a 100x P/E ratio, while not too long ago, Kodak was trading at a P/E ratio of 4x. Plenty of low priced stocks have outperformed expensive ones, but remember, just because a “value” stock may have a lower absolute P/E ratio in the recent past, does not mean it will be a better investment than a “growth” stock sporting a higher P/E ratio (see Fallacy of High P/Es).
Price, Earnings, and Dividends
As I’ve written in the past, a key determinant of future stock prices is future earnings growth (see It’s the Earnings Stupid). The higher the P/E multiple, the more important future earnings growth becomes. The lower the future growth, the more important valuation and dividends become.
We can look at various money-making scenarios that incorporate these factors. If my goal were to double my money in 5 years (i.e., earn a 100% return), there are numerous ways to skin the profit-making cat. Here are four examples:
1) Buy a non-dividend paying stock of a company that achieves earnings growth of 15%/year and maintains its current P/E ratio over time.
2) Buy a stock of a company that has a 5% dividend and achieves earnings growth of 11%/year and maintains its current P/E ratio over time.
3) Buy a value stock with a 5% dividend that achieves earnings growth of 5%/year and increase its P/E ratio by 10% each year.
4) Buy a non-dividend paying growth stock that achieves earnings growth of 20%/year and decreases its P/E ratio by about 5% each year.
I think you get the idea, but as you can see, in addition to earnings growth, dividends and valuation do play a significant role in how an investor can earn excess returns.
Lynch’s Adjusted PEG
Peter Lynch added a slight twist to the traditional PEG analysis by accounting for the role of dividends in the denominator of the PEG equation:
PEG (adjusted by Lynch) = PE Ratio/(Earnings Growth Rate + Dividend Yield)
This “adjusted PEG” ratio makes intuitive sense under various perspectives. For starters, if two different companies both had a PEG ratio of 0.8, but one of the two stocks paid a 3% dividend, Lynch’s adjusted PEG would register in at a more attractive level of 0.6 for the dividend paying stock.
Looked at under a different lens, let’s suppose there are two lemonade stands that IPO their stocks at the same time, and both companies use the exact same business model. Moreover, let us assume the following:
• Lemonade stand #1 has a P/E of 14x and growth rate of 15%.
• Lemonade stand #2 has a P/E of 12x and growth rate of 8%, but it also pays a dividend of 3%.
Given this information, which one of the two lemonade stands would you invest in? Many investors see the lower P/E of Lemonade stand #2, coupled with a nice dividend, as the more attractive opportunity of the two. But as we can see from Lynch’s “adjusted PEG” ratio, Lemonade stand #1 actually has the lower, more attractive value (.9 or 14/15 vs 1.1 or 12/(8+3)).
This analysis may be delving into the weeds a bit, but this framework is critical nonetheless. Valuation and earnings projections should be essential components of any investment decision, and with record low interest rates, dividend yields are playing a much more important role in the investment selection process. Regardless of your purchase decision thought process, whether deciding between Dom Perignon and box wine, or Facebook and Kodak shares, having the PEG ratio at your disposal should help you make wise and lucrative decisions.
Wade W. Slome, CFA, CFP®
Plan. Invest. Prosper.
DISCLOSURE: Sidoxia Capital Management (SCM) and some of its clients own certain exchange traded funds, but at the time of publishing SCM had no direct position in FB, EKDKQ.PK, or any other security referenced in this article. No information accessed through the Investing Caffeine (IC) website constitutes investment, financial, legal, tax or other advice nor is to be relied on in making an investment or other decision. Please read disclosure language on IC “Contact” page.
Earnings Showing Speedy Growth

With approximately 2/3 of the S&P 500 companies reporting, Thomson Reuters is reporting not only are 78% of those companies beating analyst expectations, but they are also beating them by a large margin (~16%). The financial sector is still rather volatile and is distorting comparisons, but if you look at the non-financial sector, profit growth is on pace to grow +35% this quarter as compared to +18% last quarter. Earnings are not the only thing growing…so are revenues. After four quarters of revenue declines, sales are on track to rise +11% this quarter (versus +8% last quarter) thanks to almost 80% of the S&P 500 companies reporting revenue growth (rather than declines) in the first quarter of 2010.

Source: The Wall Street Journal
Signs of Employment Improvement
Unemployment at 9.7% remains stubbornly high, but with corporation’s newfound revenue growth, there are signs companies are becoming more confident in the hiring department as well. Typically the sequence of a business cycle follows the pattern of cutting expenses and increasing layoffs into a recession; building cash at the cycle trough while running leaner expenses and staff; improving productivity with capital expenditures and technology purchases before hiring; and then as the recovery firms up, companies enjoy widening margins with sales growth, resulting in the confidence to hire. Take for example JP Morgan (JPM) mentioned they plan to hire 9,000 workers in the U.S. this year and Intel (INTC) another 1,000 new positions.
Growth is Global
With all the headlines about Greece’s financial woes, one might underestimate the recovery abroad as well. The average earnings growth rate estimates for the G6 stock markets is +41.6% and +21.9% for 2010 and 2011 according to Ed Yardeni, but a majority of the growth is not coming from the Euro zone.
There is still no shortage of issues to worry about, assuming we understand a Utopia does not exist. Besides elevated unemployment, other issues to remain concerned about include: a lack of credit accessibility for small and medium businesses; massive government debt and deficits; and diminishing impacts in the coming quarters from government stimulus and Federal Reserve monetary stimulus.
Regardless of the nervousness, evidence continues to build for a continuation of better than expected earnings. The music will not last forever and eventual stop, but until then, our economy will enjoy the speedier than anticipated earnings growth recovery.
Read Whole Wall Street Journal Article on Earnings (Subscription)
Wade W. Slome, CFA, CFP®
Plan. Invest. Prosper.
*DISCLOSURE: Sidoxia Capital Management (SCM) and some of its clients own certain exchange traded funds, but at the time of publishing SCM had no direct positions in JPM, INTC, or any security referenced in this article. No information accessed through the Investing Caffeine (IC) website constitutes investment, financial, legal, tax or other advice nor is to be relied on in making an investment or other decision. Please read disclosure language on IC “Contact” page.


