Posts tagged ‘earnings’
No Market Misgiving on This Thanksgiving

We’ll see if there is any gravy left for investors during the last month of the year, but so far 2024 has been a satiating feast that has stuffed investors. There has been a cornucopia of items to be thankful for, including the Federal Reserve, which is expected to provide some dessert this month in the form of its third interest rate cut this year.
Investors certainly can also be grateful for the performance of the stock market, which has had a phenomenal year thus far (see chart below):
• S&P 500: +26.5%
• Dow Jones Industrial Average:+19.2%
• NASDAQ: +28.0%

On a two-year basis, the S&P 500 results look even tastier: +57.1%
Why is there such a large appetite for stocks? For starters, we are coming off a fresh election last month, and the majority of Americans decided to vote for the new administration that has promised additional stimulative tax cuts, and deregulation. If these promises come to fruition, these changes could augur well for corporate profits and a rising stock market. Regardless of whether your candidate won or lost the election, investors can agree there is less uncertainty with an uncontested election, which is welcomed by all. In addition, the two Fed rate cuts that started in September have also buoyed enthusiasm.
What is less clear are the effects of President-elect Donald Trump’s tariff policy threats, which if enacted run the risk of increasing inflation, stifling global trade, and jeopardizing future Fed rate cuts. Combined, these negative side effects have the potential of significantly dampening economic growth. On the other hand, if the tariffs are only used as a negotiating tool with our larger trading partners (including China, Mexico, Canada, and Europe), the tariff discussion will likely have more bark than bite. Time will tell.
Dissecting Stock Performance & Valuations
A lot of pundits are pointing to an overheated market, but on a 3-year basis, returns are looking more normalized (+8.2% per year) because of the -20% hit on stocks during 2022. As you may recall, much of the 2022 decline was caused by the Fed slamming on the economic breaks with its fastest rate-hiking cycle in four decades (raising rates from 0.0% to 5.5%).
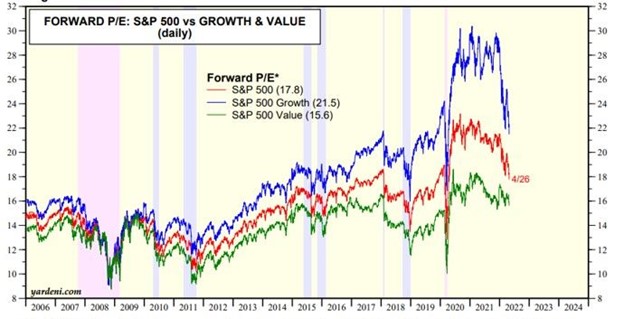
Objectively, stock values, as measured by the Price-Earnings (P/E) ratio of the S&P 500, are at elevated levels – registering in at approximately 22-times next year’s forecasted profits. As you can see from the chart below, the stock market is priced at levels not seen since 2001 and valuations are roughly double what they were at the lows of the 2008 Financial Crisis.

Source: Yardeni.com
A major reason for escalated valuations has been the concentration of performance in the largest seven companies, or the so-called Magnificent 7 stocks, which include, Apple, Microsoft, Alphabet, Amazon.com, Nvidia, Meta Platforms and Tesla. In fact, the index concentration is the highest it has been in more than a half century – even higher than at the peak of the 2000 Tech Bubble when Cisco Systems, Microsoft, GE, Intel, and Exxon Mobil were the five largest companies by market capitalization (see chart below).

The good news is the other 493 companies in the S&P 500 (I call them the “Absentee 493”) are priced much more reasonably. This bifurcated dynamic between the largest seven companies versus everything else, highlights the plethora of opportunities available to be harvested in Value stocks, Small-cap stocks, and Mid-cap stocks.
As is evident in the chart below, the S&P 500 index (red-line), which is skewed by the Magnificent 7, is about 30% more expensive than Small-cap and Mid-cap stocks, which are hovering near historically attractive valuation levels.

Source: Yardeni.com
Value stocks (blue-line) in the market look equally attractive (about 30% cheaper than the S&P 500), as can be seen in the chart below.

Source: Yardeni.com
As always, the future is uncertain, and risks abound for next year. But 2024 has been a blockbuster year and there has been plenty to be thankful for, especially the performance of the U.S. stock market.
Wade W. Slome, CFA, CFP®
Plan. Invest. Prosper.
This article is an excerpt from a previously released Sidoxia Capital Management complimentary newsletter (December 2, 2024). Subscribe Here to view all monthly articles.
DISCLOSURE: Sidoxia Capital Management (SCM) and some of its clients hold positions in AAPL, AMZN, MSFT, GOOGL, META, TSLA, NVDA, and certain exchange traded funds (ETFs), but at the time of publishing had no direct position in CSCO, GE, XOM, INTC or any other security referenced in this article. No information accessed through the Investing Caffeine (IC) website constitutes investment, financial, legal, tax or other advice nor is to be relied on in making an investment or other decision. Please read disclosure language on IC Contact page.
Recession Storm Fears Reign Supreme as Stocks Gain Steam

Commentators continue to shout the doom-and-gloom forecasts of a hard landing recession, but after an economic hurricane in 2022 there are some signs the financial clouds have begun to lift this year. The stock market has reflected this positive fundamental shift during January, as the S&P 500 catapulted +6.2%, NASDAQ +10.8%, and the Dow Jones Industrial Average +2.8%.
Last year, a major influencing cause to the -19% downdraft in the stock market (S&P 500) was due to the highest inflation readings experienced in four decades, compounded by a Federal Reserve hell-bent on slamming on the interest rate brakes. A big contributing factor to the surge in inflation was the spike in consumer spending fueled by trillions in government stimulus, coupled with widespread shortages in goods triggered by supply chain disruptions.
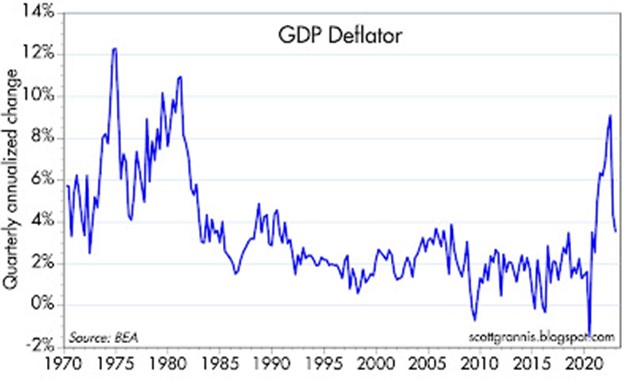
Fortunately, the headwinds of inflation now appear to be abating. Recently released inflation figures showed core inflation dropping from a peak of 9.1% last year to 3.5% in the fourth quarter (see chart below). Although the Fed will likely raise its interest rate target by 0.25% up to 4.75% this week, the downward reversal in inflation has raised the probabilities of the Federal Reserve “pausing” or “pivoting” on the direction of previous rate hikes. The odds of a halt or cut in rates will likely only increase if the descending trajectory of inflation persists and other upcoming economic data weaken further.
No Signs of Recession…Yet. Investors Waiting for Another Flood
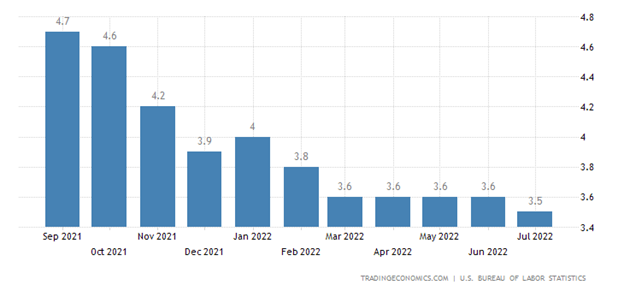
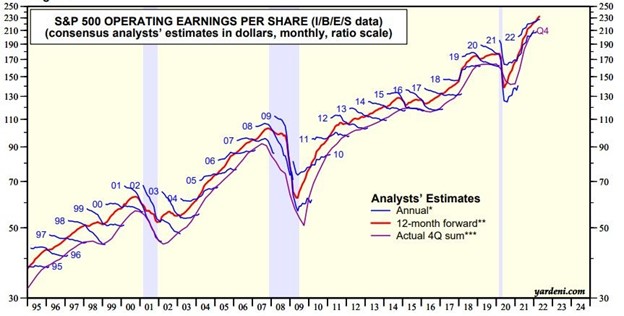
While the calls for a hard economic landing remain, healthy GDP growth (+2.9% in Q4), generationally low unemployment (3.5%), and relatively stable earnings (see chart below) all point to a stable economy with the ability to navigate a soft landing. China’s new reopening of the economy and Europe’s seeming ability of dodging a recession provide additional evidence for a soft landing scenario.
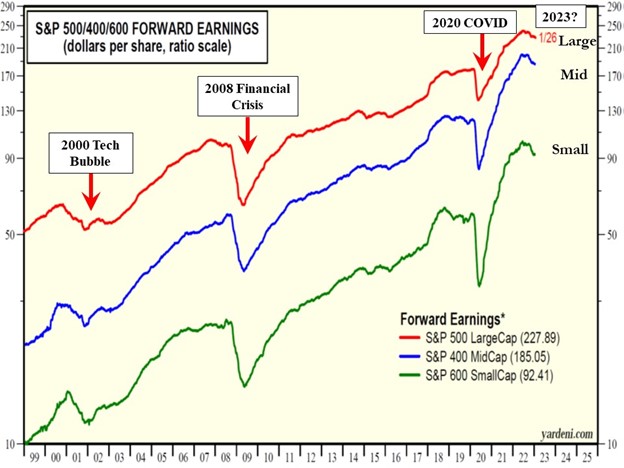
As you can see further from the 25-year earnings chart above, the drop in S&P 500 earnings in recent months has been fairly modest compared to previous downturns, and the forecast for 2023 earnings is currently estimating a modest gain on a year-over-year basis. Over the last 25 years, we have arguably experienced three 100-year floods (2000 Tech Bubble, 2008 Financial Crisis, and 2020 COVID pandemic), so investors have been bracing for another enormous financial hurricane.
Although the bursting of the 2000 Tech Bubble had an outsized impact on the technology sector, the effect on the overall economy was more muted, as you can observe from the shallow decline in the earnings. As the earnings show, during the Financial Crisis (2008) and COVID (2020), the crash in earnings was much more severe. Thus far in 2023, there has been no earnings plummet or sign of recession, and if financial conditions continue to soften, there is no reason we couldn’t undergo a more vanilla, garden-variety recession like we did in 1990 and 2000.
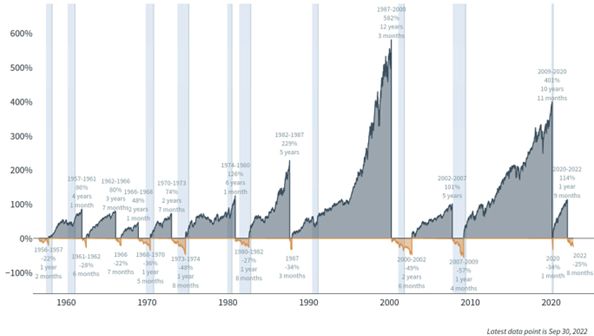
Stairs & Elevators
While the future always remains unclear, nobody knows for certain whether a recession will occur this year or if the 2022 bear market will endure into 2023. However, as you can notice below, history over the last 70 years shows the duration of bull markets (average of about 6 years) are much longer than bear markets (approximately 1 year). I like to compare bull markets to walking up stairs in a tall building, and bear markets to going down an elevator. The main difference is that the stock market elevator generally never goes to the bottom floor and the stairs keep growing to record heights over the long-run. Since World War II, Americans have experienced 13 economic recessions (see also Recession or Mental Depression?). Not only are investors batting 1,000% in successfully surviving these recessions, they have thrived. From 1956 until the present, the S&P 500 has vaulted approximately 80-fold.
Presently, economic skies might not all be clear, blue, and sunny, but the fact that inflation is dropping, our economy is still growing, labor markets remain healthy, China has reopened for business, and Europe hasn’t cratered all leave room for optimism. It may not be time to bust out the sunscreen quite yet, but the dark economic clouds of 2022 appear to be lifting slowly.

Wade W. Slome, CFA, CFP®
Plan. Invest. Prosper.
This article is an excerpt from a previously released Sidoxia Capital Management complimentary newsletter (Feb. 1, 2023). Subscribe Here to view all February articles.
DISCLOSURE: Sidoxia Capital Management (SCM) and some of its clients hold positions in certain exchange traded funds (ETFs), but at the time of publishing had no direct position in any other security referenced in this article. No information accessed through the Investing Caffeine (IC) website constitutes investment, financial, legal, tax or other advice nor is to be relied on in making an investment or other decision. Please read disclosure language on IC Contact page.
Armageddon or Time to Get In?

Halloween is a scary time, and the stock market has experienced a frightening 2022 as well. If you turn on the television or read the news, you may think Armageddon has arrived, the last battle of biblical proportion between good and evil. Fortunately, reality is often less dire than the headlines make it appear. Given the horrific -19% decline in the stock market (S&P 500 index) this year, arguably much of the current and future dreadful news is already expected and discounted into today’s stock market prices. So, perhaps, the end of the world is not upon us, and the sentiment is shifting from “Armageddon” to “time to get in!” The soaring +4,007 point increase (+14%) in the Dow Jones Industrial Average this month, the best month since 1976, may be an indication of changing investor attitudes.
We may not be completely out of the woods just yet, however a lot of the bad cat news is arguably out of the bag. For example, the Federal Reserve has already been hiking interest rates with reckless abandon since March, and this week another increase of 0.75% to roughly 4.00% is widely expected. This move should get us much closer to a Fed “pause” or “pivot”, which could soon turn the perception of a half-empty economic glass into a half-full one?
Inflation has also been running wild for months, but many indicators have shown price levels peaking or declining (i.e., commodities, housing, autos, transportation costs, etc.). Mortgage rates that have more than doubled this year to 7.08% (see chart below) are contributing to declines in home price growth.

High mortgages and high home prices have cooled the white-hot housing market because affordability has been reduced, thereby forcing rental rates to soar. And as a result, stubbornly high rents have been a major factor contributing to persistently high inflation in recent months. If home prices continue to decline (month-to-month) as shown below, this should provide some much-needed relief to rental prices, and ultimately inflation.

And although there does not appear to be a clear end in sight to the Russia-Ukraine war, Ukraine’s recently successful land recapture accomplishments from the Russians could pressure both parties to settle at the negotiation table.
Sweet October Treats
Stock market investors received a sugar high this month with sweet index gains of +8.0% and +14.0% for the S&P 500 and Dow Jones, respectively. While it has been mostly gloomy in 2022, some of the sunshine beaming through the clouds this month came in the form of better-than-expected GDP economic figures that measure the health of the overall economy. Rather than show an impending recession, the freshest 3rd quarter data shows the economy growing at a very respectable +2.6% annualized rate after falling -0.6% in the 2nd quarter (see chart below).

And contrary to many of the doomsday-er recession forecasting mongers, corporate profits have remained tenaciously high near record levels (see chart below), with no sign of collapsing as in 2020 (COVID) or 2008 (Financial Crisis). That doesn’t mean profits can’t contract further, because the dampening effect of higher interest rates could take some time before working its way through the economic python like a pig.

One month does not make a trend, but the largest one month gain in 46 years may be evidence that the world is actually not coming to an end anytime soon. Therefore, it might be a great time to “get in” before booking your fresh trip to “Armageddon”.

Wade W. Slome, CFA, CFP®
Plan. Invest. Prosper.
DISCLOSURE: Sidoxia Capital Management (SCM) and some of its clients hold positions in certain exchange traded funds (ETFs), but at the time of publishing had no direct position in any other security referenced in this article. No information accessed through the Investing Caffeine (IC) website constitutes investment, financial, legal, tax or other advice nor is to be relied on in making an investment or other decision. Please read disclosure language on IC Contact page.
Heartburn Pains After Digesting Market Gains

After gorging on +9% gains in the stock market (S&P 500 index) during July, investors suffered some heartburn pain in August (-4%). The indigestion really kicked in after Federal Reserve Chairman, Jerome Powell, gave a frank and candid outlook during his annual monetary policy speech at Jackson Hole, Wyoming. His key takeaways were that further interest rate increases are necessary to control and bring down inflation. And these economically-slowing measures, coupled with the Fed’s $95 billion in quantitative tightening policies (QT), will according to the Fed Chairman, “bring some pain to households and businesses. These are the unfortunate costs of reducing inflation. But a failure to restore price stability would mean far greater pain.”
But not everything is causing stomach pains. Yes, inflation is elevated (the rate declined to 8.5% in July from 9.1%), but there are multiple signs that overall prices are peaking. For example, gasoline prices have declined for 11 consecutive weeks to pre Russia-Ukraine invasion levels around $3.81/gallon nationally. There are also signs that housing prices, rent, used car prices, and other commodities like wheat, beef, and copper are all declining in price, as well. Even Bitcoin and other cryptocurrencies are joining in the deflation parade.
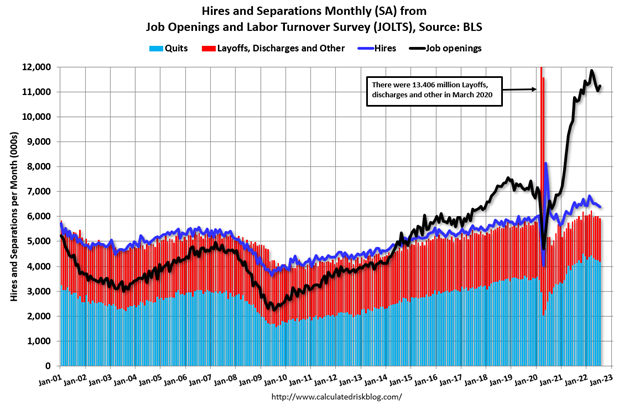
And while the Fed is doing its darnedest to bring a halt to gut-wrenching inflation, the job market remains on fire (see chart below). The unemployment rate registered in at a near a generational-low of 3.5% last month, but we will receive a fresh, new figure this week to see if this trend continues.
The economy’s ravenous appetite for workers can also be found in the just-released JOLTS job opening data (see chart below), which shows there are 11.2 million job openings, a total that is almost double the number of available workers (5.7 million).
Stimulus – Trillion Style
The subject of politics is not my strong suit, so perhaps only time will tell whether the net result of two large pieces of government legislation totaling more than $1 trillion (Inflation Reduction Act and Student Loan Forgiveness) will accelerate growth in the economy (Real GDP) or hasten the pace of inflation.
More specifically, the $565 billion Inflation Reduction Act is designed with the intent of investing in clean energy and healthcare initiatives, while negotiating lower pharmaceutical prices with drug companies, and raising tax revenues. The key measures planned in the legislation to fund the spending and forecasted deficit reduction are a minimum corporate tax, the termination of the carried interest tax loophole, and a doubling of the IRS (Internal Revenue Service) budget to hunt down tax dodgers.
With respect to the Student Loan Forgiveness Plan, the cost of the bill is estimated to be between $469 billion to $519 billion over a 10-year budget window, according to the University of Pennsylvania. The debt cancellation will apply to lower income individuals (earning less than $125,000 annually) with the potential of erasing debt of $10,000 – $20,000 per eligible person.
While the government passes various investing, spending, and tax-raising initiatives, corporations continue to crank out record results (see profit charts below), despite talks of an impending recession (see last month’s article, Recession or Mental Depression?).
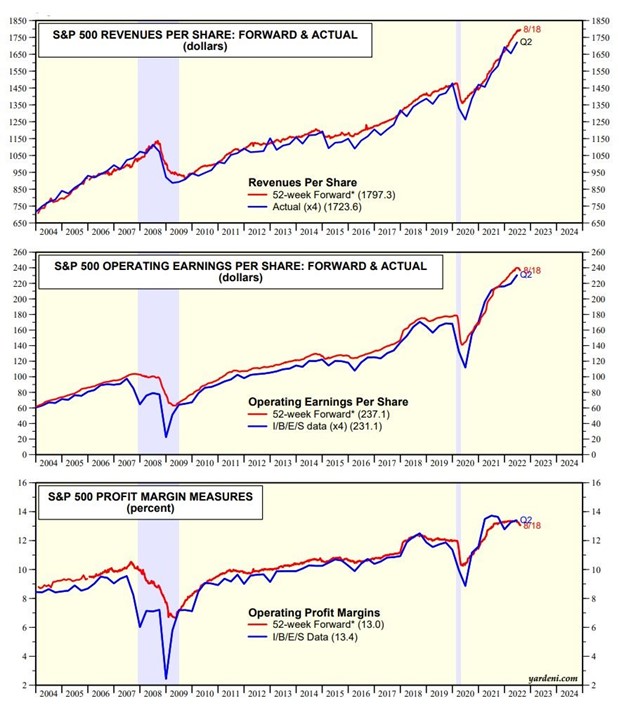
Pessimists point to the economic strength as only temporary, as they brace for the Fed’s interest rate hiking medicine to take larger effect on the patient. Optimists point to the durability of corporate profits, relatively low interest rates (3.13% yield on the 10-Year Treasury Note), positive Q3 – GDP growth estimates of +1.6%, and reasonable valuations (17x Forward Price/Earnings ratio), given the evidence of peaking and declining inflation.
In view of all the current countervailing factors, the near-term volatility will likely create a lot of stomach-churning uneasiness. However, in the coming months, if it becomes clearer the Fed is closer to the end of its rate-hiking cycle and inflation subsides, you might be gleefully enjoying your tasty gains rather than complaining of financial heartburn and headache pains.
Wade W. Slome, CFA, CFP®
Plan. Invest. Prosper.
DISCLOSURE: Sidoxia Capital Management (SCM) and some of its clients hold positions and certain exchange traded funds (ETFs), but at the time of publishing had no direct position in BRKA/B or any other security referenced in this article. No information accessed through the Investing Caffeine (IC) website constitutes investment, financial, legal, tax or other advice nor is to be relied on in making an investment or other decision. Please read disclosure language on IC Contact Page.
No Pain, No Gain

Long-term success is rarely achieved without some suffering. In other words, you are unlikely to enjoy gains without some pain. Last month was certainly painful for stock market investors. On the heels of concerns over the Russia-Ukraine war, Federal Reserve interest rate hikes, China-COVID lockdowns, inflation/supply chain disruptions, and a potential U.S. recession, the S&P 500 index declined -8.8% for the month, while the technology-heavy NASDAQ index fell -13.3%, and the Dow Jones Industrial Average weakened by -4.9%.
For long-term stock investors who have reaped the massive +520% rewards from the March 2009 lows, they understand this gargantuan climb was not earned without some rocky times along the way. As you can see from the chart below, there have been no shortage of issues and events to worry about over the last 15 years (2007 – 2022):
- 2008-2009: Financial Crisis
- 2010: Flash Crash (electronic trading collapse)
- 2011: Debt Ceiling – Eurozone Collapse
- 2012: Greek Debt Crisis – Arab Spring (anti-government protests)
- 2012: Presidential Elections – Sequestration (automatic spending cuts) – Cyprus Financial Crisis
- 2013: Federal Reserve Taper Tantrum (threat of removing monetary policy accommodation)
- 2014: Ebola Virus Outbreak
- 2015: China Economic Slowdown
- 2018: China Trade Tariffs – Federal Reserve Interest Rate Hikes
- 2020: COVID-19 Global Pandemic – Recession
- 2022: Russia-Ukraine War -Federal Reserve Interest Rate Hikes – Inflation/Supply Chain – Slowing China

So, that’s the bad news. The good news is that after the stock market eventually bottomed (S&P 500) around each of these events, one year later, stock prices rebounded on average approximately +32%, and prices moved even higher in the following two years. Suffice it to say, in most instances, patiently waiting and taking advantage of heightened volatility usually results in handsome rewards for investors over the long-run. As Albert Einstein stated, “In the middle of every difficulty lies an opportunity.”
There have been plenty of false recession scares in the past, and this could prove to be the case again. Although I have noted some of the key headwinds the economy faces above, it is worth noting that current corporate profits remain at/near all-time record highs (see chart below) and the 3.6% unemployment rate effectively stands at/near generationally record low levels. What’s more, housing remains strong, and consumer balance sheets remain very healthy as a result of elevated savings rates that occurred during COVID.
The S&P 500 is already off -14% from its highest levels experienced at the beginning of the year. Although there are no clear signs of a looming recession presently, if history is a guide, much of the pessimism is likely already discounted in current stock prices. Stated differently, even if the economy were to suffer a garden-variety recession, we may already be closer to a bottom than the potential gains from a subsequent rebound. The 15-year chart shows that stock prices have become significantly more attractively valued in recent months.
Panic is rarely a profitable strategy, so now is probably not the best time to knee-jerk react to the price declines. Peter Lynch, arguably one of the greatest all-time investors (see Inside the Brain of an Investing Genius), said it best when he stated, “Far more money has been lost by investors preparing for corrections, or trying to anticipate corrections, than has been lost in corrections themselves.”
Market corrections are never comfortable, but successful, long-term investing comes with a price…no pain, no gain!
Wade W. Slome, CFA, CFP®
Plan. Invest. Prosper.
This article is an excerpt from a previously released Sidoxia Capital Management complimentary newsletter (May 2, 2022). Subscribe on the right side of the page for the complete text.
DISCLOSURE: Sidoxia Capital Management (SCM) and some of its clients hold positions and certain exchange traded funds (ETFs), but at the time of publishing had no direct position in any other security referenced in this article. No information accessed through the Investing Caffeine (IC) website constitutes investment, financial, legal, tax or other advice nor is to be relied on in making an investment or other decision. Please read disclosure language on IC Contact page.
No Red Blood, Just Green Flood
Normally, investors equate the month of October with scary, blood-curdling screams because horrifying losses during the 1929 and 1987 crashes occurred during this month. Fortunately, for those invested in stocks, they experienced the opposite this last month – a flood of green (new all-time record highs), despite a whole host of frightening factors, including the following:
· Inflation
· Supply chain disruptions
· Federal Reserve monetary policy
· COVID variants
· Evergrande’s impact on China and commercial real estate
· Cryptocurrency volatility
· Expanding government deficits and debt (stimulus/infrastructure)
· Government debt ceiling negotiations
· Declining corporate profit margins
· Meme stocks
· And more…boo!
Even though this Halloween season has introduced these many spooky fears, investors still experienced a sugar-high during October. More specifically, the S&P 500 catapulted +6.9% this month (+22.6% Year-to-Date), Dow Jones Industrial Average +5.8% (+17.0% YTD); and NASDAQ +7.3% (+20.3% YTD). With the COVID Delta variant subsiding (see chart below), economic activity rising (Q4 GDP is estimated at +4.8%), and corporate profits going gang busters (33% growth and 84% of corporations are beating Q3 estimates), it should come as no surprise that stock market values continue to rise.
As I mention regularly to my readers, there is never a shortage of things to worry about when it comes to your investments, money, and savings. Emotions tend to highjack rational reasoning as non-existent boogeymen scare people into do-nothing decision-making or suboptimal choices. Investing for the long-run requires dedication and discipline, and if you do not have the time and fortitude to do so, it behooves you to find an experienced, independent professional to assist you.
Rather than getting spooked by supply chain fears and inflation plastered all over the newspapers and media outlets, the real way to compound wealth over the long-term is to do what Warren Buffett says, and that is “buy fear, and sell greed.” Unfortunately, our Darwinian instincts embedded in our DNA are naturally designed to do the contrary…”buy greed, and sell fear.” The goal is to buy low and sell high (not buy high and sell low).
Yes, it’s true that over the last year, semiconductor lead times have almost doubled to 22 weeks, and Chinese container shipping costs have about increased 10-fold to over $20,000 (see charts below). However, the economic laws of supply and demand remain just as true today as they did in 1776 when Adam Smith wrote Wealth of Nations (see also Pins, Cars, Coconuts & Chips). Chip makers are building new fabs (i.e., manufacturing plants) and worker shortages at the ports and truck driver deficiencies are slowly improving. Supply scarcity and higher prices may be with us for a while, but history tells us betting against capitalism isn’t a wise decision.


Not worrying about all the economic goblins and witches can be difficult when contemplating your investments and savings. Nevertheless, as I have consistently reminded my investors and readers, the key pillars to understanding the health of the investment environment are the following (see also The Stool):
· Interest rates
· Earnings (Corporate profits)
· Valuations (How cheap or expensive is the market?)
· Sentiment (How greedy or fearful are investors?)
The good news is that a) interest rates are near historically low levels; b) corporate profits are on a tear (+33% as mentioned above); c) valuations have come down because profits have grown faster than stock price appreciation; and d) sentiment remains nervous (a good thing) as measured by the massive inflows going into low (negative) yielding bonds. If you consider all these elements, one should not be surprised that we are at-or-near all-time record highs. Obviously, these investment pillars can reverse directions and create headwinds for investors. Until then, don’t be startled if there is more green flood rather than red blood.

Wade W. Slome, CFA, CFP®
Plan. Invest. Prosper.
This article is an excerpt from a previously released Sidoxia Capital Management complimentary newsletter (November 1, 2021). Subscribe on the right side of the page for the complete text.
DISCLOSURE: Sidoxia Capital Management (SCM) and some of its clients hold positions in certain exchange traded funds (ETFs), but at the time of publishing had no direct position in any other security referenced in this article. No information accessed through the Investing Caffeine (IC) website constitutes investment, financial, legal, tax or other advice nor is to be relied on in making an investment or other decision. Please read disclosure language on IC Contact page.
GDP Figures & Election Jitters

Ever since the beginning of 2020, it’s been a tale of two cities. As renowned author Charles Dickens famously stated, “It was the best of times and worst of times.” The year started with unemployment at a “best of times” low level of 3.5% (see chart below) before coronavirus shutdown the economy during March when we transitioned to the “worst of times.”
 |
With the recent release of record-high Gross Domestic Product (GDP) figures of +33.1% growth in Q3 (vs. -31.4% in Q2), and a +49% stock market rebound from the COVID-19 lows of March, a debate has been raging. Is the re-opening economic rebound that has occurred a V-shaped recovery that will continue expanding, or is the recovery that has occurred since March a temporary dead-cat bounce?
 |
For many people, the ultimate answer depends on the outcome of the impending presidential election. Making matters worse are the polarized politics that are being warped, distorted, and amplified by social media (see Social Dilemma). Although the election jitters have many stock market participants on pins and needles, history reminds us that politics have little to do with the long-term direction of the stock market and financial markets. As the chart below shows, over the last century, stock prices have consistently gone up through both Democratic (BLUE) and Republican (RED) administrations.
 |
Even if you have trouble digesting the chart above, I repeatedly remind investors that political influence and control are always temporary and constantly changing. There are various scenarios predicted for the outcome of the current 2020 elections, including a potential “Blue Wave” sweep of the Executive Branch (the president) and the Legislative Branch (the House of Representatives and Senate). Regardless of whether there is a Blue Wave, Red Wave, or gridlocked Congress, it’s worth noting that the previous two waves were fleeting. Unified control of government by President Obama (2008-2010) and President Trump (2016-2018) only lasted two years before the Democrats and Republicans each lost 100% control of Congress (the House of Representatives flipped to Republican in 2010 and Democrat in 2018).
Even though Halloween is behind us, many people are still spooked by the potential outcome of the elections (or lack thereof), depending on how narrow or wide the results turn out. Despite the +49% appreciation in stock prices, stock investors still experienced the heebie-jeebies last month. The S&P 500 index declined -2.8% for the month, while the Dow Jones Industrial Average and Nasdaq Composite index fell -4.6% and -2.3%, respectively. It is most likely true that a close election could delay an official concession, but with centuries of elections under our belt, I’m confident we’ll eventually obtain a peaceful continuation or transition of leadership.
Regardless of whomever wins the presidential election, roughly half the voters are going to be unhappy with the results. For example, even when President Ronald Reagan won in a landslide victory in 1980 (Reagan won 489 electoral votes vs. 49 for incumbent challenger President Jimmy Carter), Reagan only won 50.8% of the popular vote. In other words, even in a landslide victory, roughly 49% of voters were unhappy with the outcome. No matter the end result of the approaching 2020 election, suffice it to say, about half of the voting population will be displeased.
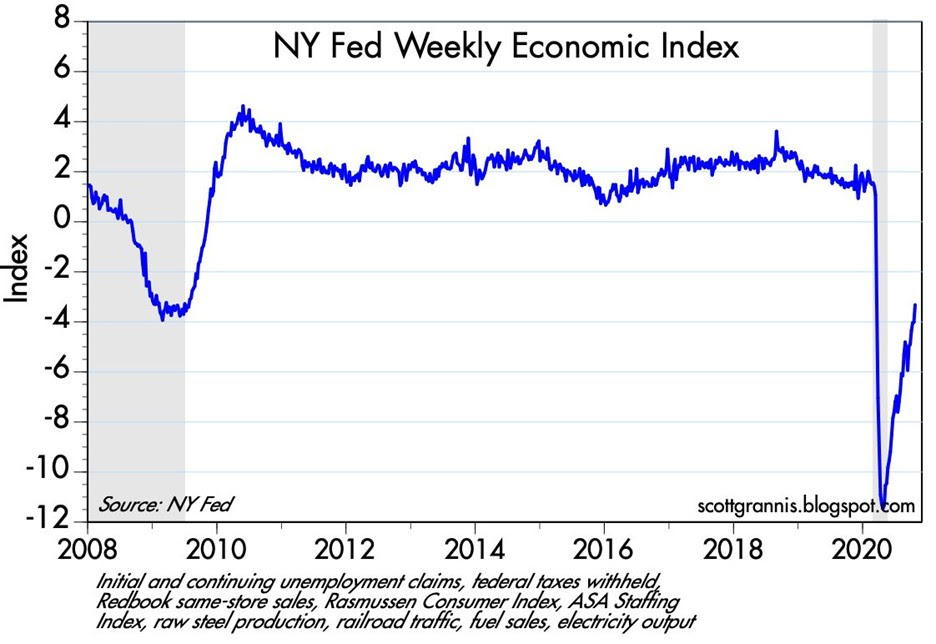
Despite the likely discontent, the upcoming winner will be working with (or inheriting) an economy firmly in recovery mode, whether you are referencing, jobs, automobile sales, home sales, travel, transportation traffic, consumer spending, or other statistics. The Weekly Economic Index from the New York Federal Reserve epitomizes the strength of the V-shaped recovery underway (see chart below).
It will come as no surprise to me if we continue to experience some volatility in financial markets shortly before and after the elections. However, history shows us that these election jitters will eventually fade, and the tale of two cities will become a tale of one city focused on the fundamentals of the current economic recovery.

Wade W. Slome, CFA, CFP®
Plan. Invest. Prosper.
This article is an excerpt from a previously released Sidoxia Capital Management complimentary newsletter (November 2, 2020). Subscribe on the right side of the page for the complete text.
DISCLOSURE: Sidoxia Capital Management (SCM) and some of its clients hold positions in certain exchange traded funds (ETFS), but at the time of publishing had no direct position in any other security referenced in this article. No information accessed through the Investing Caffeine (IC) website constitutes investment, financial, legal, tax or other advice nor is to be relied on in making an investment or other decision. Please read disclosure language on IC Contact page.
Bridge to Vaccine or Nowhere?

We are approximately eight months into a global pandemic that has infected an estimated 18 million people and taken almost 700,000 lives. Everyone is wrestling with the ripple through effects that COVID-19 has not only had on our personal lives, but also on the broader aspects of our economy, including science, politics, economics, education, mental health, food supply, and transportation. The 7.8 billion people on the planet, including investors, are waiting for a bridge to a COVID-19 vaccine cure to come as soon as possible, so people and the world can begin returning towards normalcy.
The bridge to a COVID cure is not complete yet, but investors are currently paying notice and giving researchers the benefit of the doubt. Last month, stocks continued their advance with the S&P 500 catapulting another 5.5%. Since the low in March this year, stock prices have appreciated an astounding +49%, and are actually in the black (i.e., positive) for the year despite unemployment climbing above 11% and a massive 2nd quarter economic contraction in GDP of -32.9%. Some stock enthusiasm can be attributed to forecasted 3rd quarter GDP growth of 16%. The stock market story is even brighter, if you consider the technology-heavy NASDAQ index rose +6.8% for the month, +62% from this year’s low, and +20% for 2020.
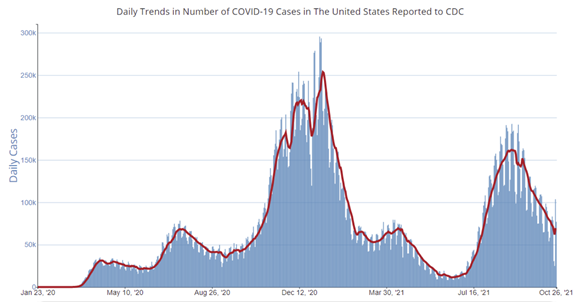
With the destruction of lives and economic activity so severe, how can stock prices be so lofty? In short, after the economy ground to a virtual halt in March, business has been slowly getting better. At the heart of this improvement, the learning curve in treating this deadly virus has slowed the bleeding of the COVID-19 disease. The progress in controlling the virus can be seen in the declining number of daily COVID-19 cases (see chart below).
The stabilization and the beginning of a downward trend of cases can be explained with the successful application of therapeutics like remdesivir (manufactured by Gilead Sciences); generic steroids like dexamethasone; improved ventilator implementation in conjunction with blood thinners; and better compliance with social distancing/mask-wearing protocols.
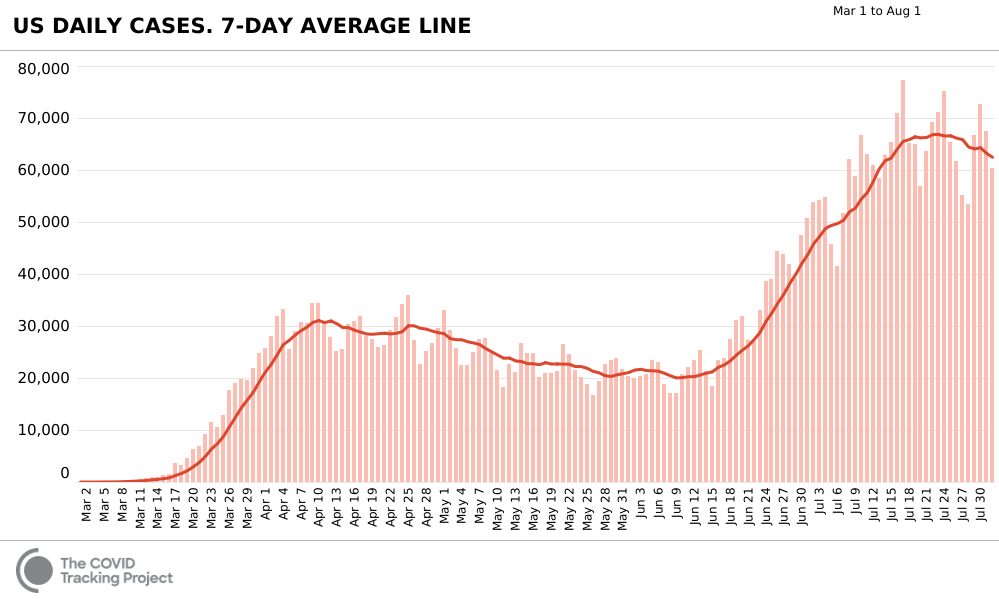
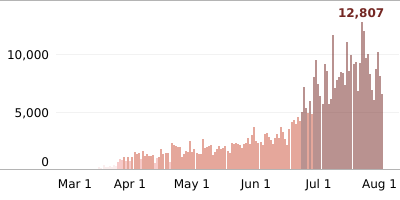
In California, we appear to be on the right path of the curve, as well. Daily infections peaked at 12,807 however, and as of August 1st, daily COVID-19 cases declined to 6,542 (see chart below).
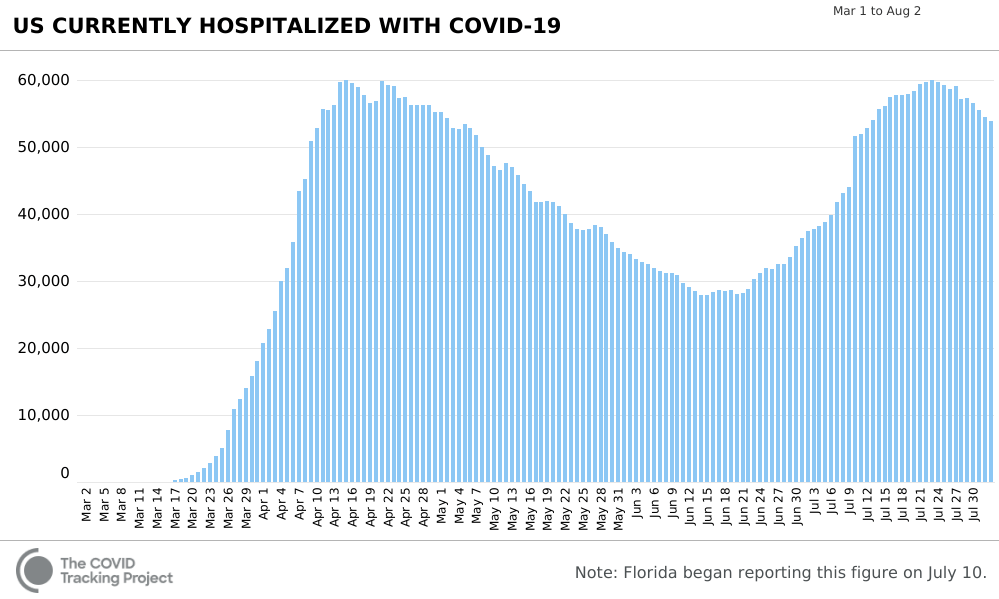
The hospitalization picture tells a similar story (see chart below). Even though the number of daily cases more than doubled nationally to record highs, the number of people hospitalized plateaued because of better treatment and the concentration of newly infected cases in the younger demographic age level.
In addition to current trends mending, optimism for a COVID-19 vaccine cure is also building, as I alluded to earlier. Economist and blog writer Dr. Ed Yardeni summed up the research developments well.
“The Trump administration has launched “Operation Warp Speed” with the goal of delivering 300 million doses of a safe, effective vaccine for COVID-19 by January 2021, as part of a broader strategy to accelerate the development, manufacturing, and distribution of COVID-19 vaccines, therapeutics, and diagnostics. Congress has directed almost $10 billion to this effort through supplemental funding, including the CARES Act. More than 100 clinical trials of dozens of potential coronavirus treatments are already underway around the world.”
If these timelines are correct, the bridge to a cure is almost here.
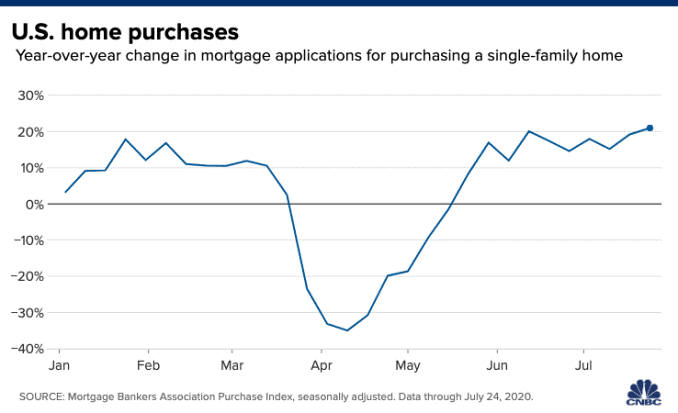
Housing Market on a Tear
One of the very positive byproducts of the pandemic has been the red-hot housing market (see chart below), which has been driven by record low interest rates and demand for COVID-friendly housing. People are migrating from tight urban quarters to the suburbs, where people can obtain a home office, a spacious backyard, and a swimming pool. This ravenous home demand is coinciding with generationally low interest rates, including a jaw-droppingly low 30-year fixed-rate mortgage hovering around 3%. All else equal, lower interest rates means consumers make lower monthly payments and can carry more debt, which improves home affordability.
Fears of a COVID Collapse
Although there have certainly been some tangible improvements since the depths of the pandemic, there are definite challenges ahead.
Consider the following challenges:
- Consequences to Unmitigated Government Spending: Congress is working to approve another $1 – $3 trillion dollar stimulus package to buttress our strained economy during the COVID-19 crisis. In the short-run, this money can provide relief to millions of people and businesses that have suffered through the global pandemic. However, in the longer term, spending cutbacks will likely be necessary. Just like somebody going on an endless credit card spending spree, eventually the money borrowed and spent needs to be paid back, or alternatively, a credit limit will ultimately be reached. Sooner or later, the trillions of dollars in spending will trigger collectors (investors) to come knocking. Under these possible scenarios, fiscal responsibility will force dramatic cuts to benefits and services like Social Security, Medicare, education, and military, among other areas.
- Rising China Tensions: It doesn’t take a genius to figure out our president’s view on China. All one needs to do is read his daily posts on Twitter. Our president’s commentary includes, but is not limited to, our massive trade deficits with China; political unrest in Hong Kong; Chinese consulate closure in Houston, Texas and American consulate closure in Chengdu, China; and blame regarding intellectual property theft and the spread of the “Wuhan” virus. These are only some of the factors contributing to the strained bilateral relationship between the United States and the #2 global economy, China.
- Presidential Election: The November 3rd presidential election date is just around the corner, and the outcome will likely create uncertainty regarding the trajectory of future U.S. tax rates and other policies.
- Burst in Tech Bubble? The top 1% of companies in the S&P 500 (Apple Inc., Microsoft Corp., Amazon.com, Alphabet Inc., Facebook Inc.) account for 22% of the value of the index, or more than $6 trillion in market value. Some observers explain this explosion in concentrated technology values by pointing a finger at the Federal Reserve’s zero-interest-rate policy and lack of government regulation, while others point to a behavioral shift in technology demand and usage.
- Potential Inflation: The inflation threat has been created by trillions of dollars in money printing policies by the Federal Reserve. But it’s not only the trillions of U.S. dollars being printed by the Fed, it’s also trillions in euros, Japanese yen, and Chinese yuan being printed by other global central banks. As a result, the danger of rampant inflation could become a reality.
The foundation may not be fully sturdy yet, but a clear bridge to a recovery is under construction, and the blueprint confirms we have the pieces needed for completion (i.e., a vaccine). As I pointed out in last month’s newsletter (Record Rebound), volatility has been a constant throughout the rebound. Given the pace and questionable sustainability of the bounce, active management is necessary. At Sidoxia Capital Management (www.Sidoxia.com), we continue to prudently manage our client portfolios with the purpose of meeting their customized objectives. Getting from here to achieving your financial goals is a serious challenge, and reaching your economic destination requires a well-designed bridge that won’t collapse.
Wade W. Slome, CFA, CFP®
Plan. Invest. Prosper.
This article is an excerpt from a previously released Sidoxia Capital Management complimentary newsletter (August 3, 2020). Subscribe on the right side of the page for the complete text.
DISCLOSURE: Sidoxia Capital Management (SCM) and some of its clients hold positions in GILD, AAPL, AMZN, GOOGL, FB, MSFT and certain exchange traded funds (ETFS), but at the time of publishing had no direct position in TWTR or any other security referenced in this article. No information accessed through the Investing Caffeine (IC) website constitutes investment, financial, legal, tax or other advice nor is to be relied on in making an investment or other decision. Please read disclosure language on IC Contact page.
Movie Deja Vu – Coronavirus

I have seen this movie before. I love the stock market, but I do actually have other outside interests, including seeing movies. What better indoor winter activity than watching movies?! The Hollywood excitement continues this Sunday for the 92nd Academy Awards. My popcorn consumption has been generous this year as I have seen seven of the nine Best Picture nominated films with the exception of Jojo Rabbit and Little Women.
With a lifetime of movie watching under my belt, there is no shortage of redundant movie themes, whether it’s happy endings in romantic comedies, triumphant patriotism in war flicks, or gory blood spatters in horror films. Just as repetitive as these story lines have been in films, the redundant theme of pandemic health panics continues to plague investors every time a new contagious disease is announced. The newest debut is coronavirus. While coronavirus is playing on the big screen, the presidential impeachment trial, and January 31st Brexit deadline have been sideshows. Stay tuned for that breaking news!
Doctor Wade’s Diagnosis
Although I have not added M.D. to my list of professional credentials (CFA, CFP), Dr. Wade has enough medical experience to identify historical patterns. Most recently, the media covering the Wuhan coronavirus originating in the central Chinese province of Hubei (see map below) has unnecessarily terrorized the global masses with F.U.D. (Fear, Uncertainty, Doubt). While we likely know the ending of this health scare movie (i.e., humanity survives and life goes on), the timing, and scope remain uncertain.

2020: Sickness After Healthy Start
After an healthy start to the 2020 stock market show (S&P 500 index zoomed +3.3% higher), investors viewing the coronavirus plot unfold subsequently were sickened with an S&P decline of -3.4% to finish the month slightly down from year-end (-0.2% from December 31st to January 31st). The Dow Jones Industrial Average was hit slightly worse, down 282 points for the month to 28,256, or -1.0%.
How do we know this infectious coronavirus disease scare shall too pass? Well, over the last few decades, there have been many more lethal diseases that have been put to bed. Here’s a list of some of these high profile, safely-controlled infectious diseases:
- Severe Acute Respiratory Syndrome (SARS)
- Middle East Respiratory Syndrome (MERS)
- Ebola
- Zika Virus
- Bird Flu
- Swine Flu
- H1N1 Virus
- Mad Cow
- Hoof-and-Mouth
A chart comparing the severity and timing of some of the major viruses can be seen below.

While the human impact has been tragic, coronavirus has also struck a blow to the global economy. The pandemic prequel that mostly closely matches coronavirus is SARS, which also originated in China during 2003 in the province of Guandong. Most notable to me is the fatality rate for coronavirus of just 2.2% versus 9.6% for SARS. While coronavirus is less deadly than SARS, coronavirus is objectively more contagious than SARS and could have an incubation period of 14 days (significantly longer than SARS, which could increase the rate of infections). In fact, there were more confirmed cases of coronavirus in one month than all the reported cases of SARS identified over a span of nine months. Even so, as the chart shows, coronavirus deaths remain the lowest.
Economic Impact
The damaging economic impact of the coronavirus pandemic continues to escalate rapidly on a daily basis as governments, global health agencies, corporations, and individuals respond. Even though coronavirus appears to be much less lethal than SARS, we can scale current economic estimates based on the relative costs incurred during SARS. Some reports show the 2003 SARS situation costing the global economy $40 – $60 billion and 2.8 milllion Chinese jobs, while the potential hit in lost global growth from coronavirus could total $160 billion, according to Warwick McKibbin, a Australian National University economics professor.
The Chinese government fully realizes the amount of financial destruction caused by the SARS outbreak, and therefore is not sitting idly as it relates to the coronavirus. Back during SARS, the government did not institute quarantine measures nor publish the SARS’ genome (necessary to test and track virus) until four months had passed. After the first coronavirus patient was diagnosed around December 1st (two months ago) and the spread of the virus accelerated, the Chinese local governments expanded mandatory factory shutdowns for the Lunar New Year from January 31st to February 9th. What’s more, Wuhan, a city of 11 million residents at the epicenter of the illness, recently closed the area’s outgoing airport and railway stations and suspended all public transport. Chinese government officials have since extended the travel ban to 16 neighboring cities with a combined population of more than 50 million people, including Huanggang, a city next to Wuhan with 7.5 million people, essentially placing those cities on lock down.
Private companies are taking action as well. Companies such as Disney, Tesla, Amazon, Google, Apple, McDonalds, Starbucks, and more than a dozen airlines, cruise lines, casinos, and other global companies with significant footprints in China are suspending operations, temporarily shutting factories and instituting travel restrictions.
No Need to Panic Yet
Before you quarantine yourself in your basement, and take full-body showers in hand sanitizer, let’s take a look at some of those annoying things called facts:
- There have been zero (0) coronavirus deaths in the United States, and eight diagnosed cases (at time of press).
- There have been approximately 10,000 Americans killed by the flu since October 2019.
Apparently casual American observers are unable to filter out the true signals being lost in the avalanche of blood-curdling, panicked virus headlines. Tufts Medical Center infectious disease specialist Dr. Shira Doron highlighted this message when she stated the following, “The likelihood of an American being killed by the flu compared to being killed by the coronavirus is probably approaching infinity.” Of the limited number of coronavirus deaths thus far, one study of 41 Wuhan coronavirus death cases showed the median age is around 75 years old. For most people (i.e., those who are not elderly or young children), I guess the moral of this story is to turn the TV off, go get your flu shot, and fall asleep with few worries.
There may be some more coronavirus pain and suffering ahead until this tragic human and economic pandemic comes under control. During the SARS outbreak (November 2002 – July 2003), peak-to-trough stock prices temporarily fell by -16% before marching upwards to new record highs. However, if this movie finishes like so many other similar infectious diseases, the coronavirus fever should break soon enough, and investors will be satisfied with new opportunities and another happy ending to the story.

Wade W. Slome, CFA, CFP®
Plan. Invest. Prosper.
This article is an excerpt from a previously released Sidoxia Capital Management complimentary newsletter (February 3, 2020). Subscribe on the right side of the page for the complete text.
DISCLOSURE: Sidoxia Capital Management (SCM) and some of its clients hold positions and certain exchange traded funds (ETFS) and DIS, TSLA, AMZN, GOOGL, AAPL, and MCD, but at the time of publishing had no direct position in SBUX or any other security referenced in this article. No information accessed through the Investing Caffeine (IC) website constitutes investment, financial, legal, tax or other advice nor is to be relied on in making an investment or other decision. Please read disclosure language on IC Contact page.
From Gloom to Boom

Gloomy clouds rolled in late last year in the form of a government shutdown; U.S. – China trade war tensions; hawkish Federal Reserve interest rate policies; a continued special counsel investigation by Robert Mueller into potential Russian election interference; a change in the Congressional balance of power; Brexit deal uncertainty; and U.S. recession concerns, among other worries. These fear factors contributed to a thundering collapse in stock prices during the September to December time frame of approximately -20% in the S&P 500 index (from the September 21st peak until the December 24th trough).
However, the dark storm clouds quickly lifted once Santa Claus delivered post-Christmas stock price gains that have continued through February. More specifically, since Christmas Eve, U.S. stocks have rebounded a whopping +18%. On a shorter term basis, the S&P 500 index and the Dow Jones Industrial Average have both jumped +11.1% in 2019. January showed spectacular gains, but last month was impressive as well with the Dow climbing +3.7% and the S&P +3.0%.
The rapid rise and reversal in negative sentiment over the last few months have been aided by a few positive developments.
- Strong Earnings Growth: For starters, 2018 earnings growth finished strong with an increase of roughly +13% in Q4-2018, thereby bringing the full year profit surge of roughly +20%. All else equal, over the long run, stock prices generally follow the path of earnings growth (more on that later).
- Solid Economic Growth: If you shift the analysis from the operations of companies to the overall performance of the economy, the results in Q4 – 2018 also came in better than anticipated (see chart below). For the last three months of the year, the U.S. economy grew at a pace of +2.6% (higher than the +2.2% GDP [Gross Domestic Product] growth forecast), despite headwinds introduced by the temporary U.S. federal government shutdown and the lingering Chinese trade spat. For the full-year, GDP growth came in very respectably at +2.9%, but critics are dissecting this rate because it was a hair below the coveted 3%+ target of the White House.

Source: The Wall Street Journal
- A More Accommodative Federal Reserve: As mentioned earlier, a major contributing factor to the late-2018 declines was driven by a stubborn Federal Reserve that was consistently raising their interest rate target (an economic-slowing program that is generally bad for stocks and bonds), which started back in late 2015 when the Federal Funds interest rate target was effectively 0%. Over the last three years, the Fed has raised its target rate range from 0% to 2.50% (see chart below), while also bleeding off assets from its multi-trillion dollar balance sheet (primarily U.S. Treasury and mortgage-backed securities). The combination of these anti-stimulative policies, coupled with slowing growth in major economic regions like China and Europe, stoked fears of an impending recession here in the U.S. Fortunately for investors, however, the Federal Reserve Chairman, Jerome Powell, came to the rescue by essentially implementing a more “patient” approach with interest rate increases (i.e., no rate increases expected in the foreseeable future), while simultaneously signaling a more flexible approach to ending the balance sheet runoff (take the program off “autopilot).

Source: Dr. Ed’s Blog
The Stock Market Tailwinds
For those of you loyal followers of my newsletter articles and blog articles over the last 10+ years, you understand that my generally positive stance on stocks has been driven in large part by a couple of large tailwinds (see also Don’t Be a Fool, Follow the Stool):
#1) Low Interest Rates – Yes, it’s true that interest rates have inched higher from “massively low” levels to “really low” levels, but nevertheless interest rates act as the cost of holding money. Therefore, when inflation is this low, and interest rates are this low, stocks look very attractive. If you don’t believe me, then perhaps you should just listen to the smartest investor of all-time, Warren Buffett. Just this week the sage billionaire reiterated his positive views regarding the stock market during a two hour television interview, when he once again echoed his bullish stance on stocks. Buffett noted, “If you tell me that 3% long bonds will prevail over the next 30 years, stocks are incredibly cheap… if I had a choice today for a ten-year purchase of a ten-year bond at whatever it is or ten years, or– or buying the S&P 500 and holding it for ten years, I’d buy the S&P in a second.”
#2) Rising Profits – In the short-run, the direction of profits (orange line) and stock prices (blue line) may not be correlated (see chart below), but over the long-run, the correlation is amazingly high. For example, you can see this as the S&P 500 has risen from 666 in 2009 to 2,784 today (+318%). More recently, profits rose about +20% during 2018, yet stock prices declined. Moreover, profits at the beginning of 2019 (Q1) are forecasted to be flat/down, yet stock prices are up +11% in the first two months of the year. In other words, the short-term stock market is schizophrenic, so focus on the key long-term trends when planning for your investments.

Source: Macrotrends
Although 2018 ended with a gloomy storm, history tells us that sunny conditions have a way of eventually returning unexpectedly with a boom. Rather than knee-jerk reacting to volatile financial market conditions after-the-fact, do yourself a favor and create a more versatile plan that deals with many different weather conditions.

Wade W. Slome, CFA, CFP®
Plan. Invest. Prosper.
This article is an excerpt from a previously released Sidoxia Capital Management complimentary newsletter (March 1, 2018). Subscribe on the right side of the page for the complete text.
DISCLOSURE: Sidoxia Capital Management (SCM) and some of its clients hold positions and certain exchange traded funds (ETFs), but at the time of publishing had no direct position in any other security referenced in this article. No information accessed through the Investing Caffeine (IC) website constitutes investment, financial, legal, tax or other advice nor is to be relied on in making an investment or other decision. Please read disclosure language on IC Contact page.
P.S.
Wade’s Investing Caffeine Podcast Has Arrived!

Wade Slome, founder of Sidoxia Capital Management, author of How I Managed $20 Billion Dollars by Age 32, and lead editor of the Investing Caffeine blog has launched the Caffeine Corner investment podcast.
The Investing Caffeine podcast is designed to wake up your investment brain with weekly overviews of financial markets and other economic-related topics.
Don’t miss out! Follow us on either SoundCloud or PodBean to get a new episode each week. Or follow our InvestingCaffeine.com blog and watch for new podcast updates each week.


