Posts tagged ‘dividends’
Winning via Halftime Adjustments

This article is an excerpt from a previously released Sidoxia Capital Management complementary newsletter (July 1, 2014). Subscribe on the right side of the page for the complete text.
In the game of sports and investing there are a lot of unanticipated dynamics that occur during the course of a game, season, or year. With the second quarter of 2014 now coming to a close, we have reached the half-way point of the year. Along the way, the coach (and investors) may need to make some strategic halftime adjustments. Reassessing or reflecting on the positioning of your investment portfolio once or twice per year in the context of your investment objectives, time horizon, and risk tolerance level is never a bad idea – especially when there are unforeseen events continually materializing during the game.
During the first half of the year, the financial markets have experienced numerous surprises:
- Declining Interest Rates: Under the auspices of a massive 2013 gain in stock prices, expectations were for an accelerating economy and rising interest rates in 2014. Instead, the 10-Year Treasury Note has seen its yield counterintuitively plunge from 3.03% to 2.52%.
- Geopolitical Tensions (Ukraine/Syria/Iraq): The stock market has ground higher this year in spite of geopolitical tensions in Ukraine, Syria, and now Iraq. These skirmishes make for great TV, radio, and blog content, but the reality is these conflicts will likely be forgotten/ignored in favor of other fresher clashes in the coming months and quarters.
- Unabated Tapering: It’s true the Federal Reserve signaled the reduction in its bond buying stimulus program last year, however the more surprising aspect has been the pace of the taper. From the beginning of the year, the $85 billion program has already been reduced to $35 billion and will likely be reduced to $0 by the fall.
- Polar Vortex/GDP: Weather is very unpredictable, and regardless of your views on global warming, the unseasonably cold weather on the eastern half of the country had a severely negative impact on first half GDP (Gross Domestic Product). In fact, first quarter GDP was revised lower to a contraction of -2.9%. The good news is expectations are for an improved second half of the year according to Merrill Lynch.
While it would be wonderful to live in Utopia, unfortunately for investors, there is always uncertainty and risk. These elements come with the investing territory. Of course, you can always compensate for that unwanted uncertainty by accepting low interest-paying options (e.g., stuffing your money under a mattress, in a CD, savings account, Treasury bonds, etc.).
Despite the unexpected first half events, the market continues to grind higher. During the first half of the year, the S&P 500 index rose 6.1% (+1.9% in June); the Dow Jones Industrials edged higher by +1.5% (+0.7% in June); and the Nasdaq climbed +5.5% (+3.9% in June). But stocks weren’t the only winning investment team in town – bonds tasted victory during the first half also, notching gains of +2.8% (AGG – Aggregate Bond), almost double the Dow’s performance.
Investor Psyche Pendulum Swinging in Positive Direction

As I have written in the past, investor psyches continually swing along an emotional pendulum (see also Sentiment Pendulum article) from a state of “Panic” to “Euphoria”. While the pendulum has clearly swung in a positive direction, away from the emotional states of “Panic & Fear,” we appear to now be between “Skepticism & Hope.” The timing of when we get to the latter stages of “Optimism & Euphoria” is dependent on the pace of the economic recovery, risk appetites of consumers/businesses, and the trajectory of risky assets like stocks. Just because the ride has been fun for the last five years, does not mean the ride is over. However, as the pendulum continues to swing to the left, long-term investors need to fight the tempting urge to increase risk appetite just as the allure of high stock returns appears more achievable.
During the second half of this economic cycle, before the next recession, investors need to be more cognizant of controlling risk (the probability of permanent losses) by paying closer attention to valuations, diversification, and rebalancing too heavily weighted equity portfolios.
Besides rising stock prices and the beginning of positive fund flows, investors’ increasing appetite for risk is evidenced by the yield chasing occurring in junk bonds, which has raised prices of the lowest quality bonds to lofty levels. The chart below shows this phenomenon happening with the yields narrowing between high yield (HY) bonds and investment grade (IG) corporate bonds.
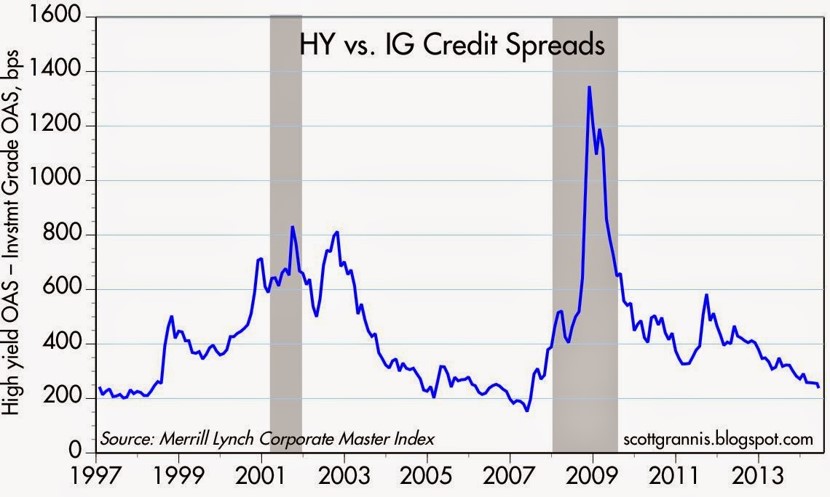
Source: Calafia Beach Pundit
Even though I pointed out a number of disconcerting surprises in the first half of the year, as you consider making halftime adjustments to your portfolios, do not forget some of the underlying positive currents that are leading to a winning halftime score.
Here are some of the constructive factors supporting stock prices, which have nearly tripled in value from the 2009 lows (S&P 500 – 666 to 1,960):
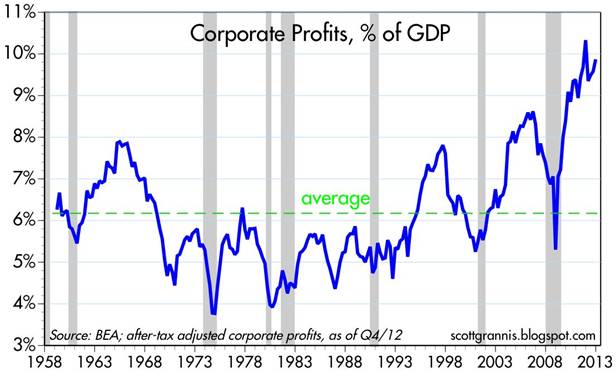
Record Corporate Profits: I constantly bump into skeptics who fail to realize the fundamental power of record profits driving stock prices higher (see chart below). As the late John Templeton stated, “In the long run, the stock market indexes fluctuate around the long-term upward trend of earnings per share.”
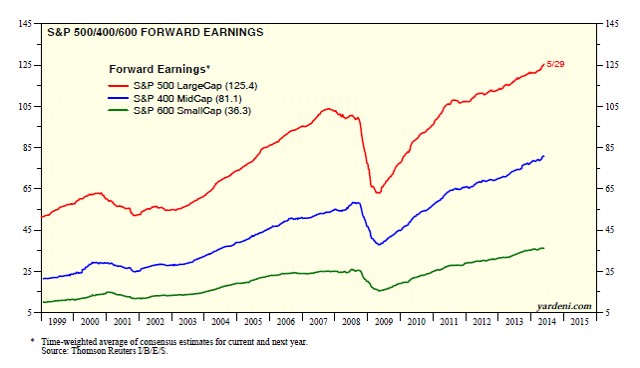
Source: Dr. Ed’s Blog
Improving Consumer Confidence: The University of Michigan consumer sentiment index increased to 82.5 for June from May. The confidence score came in above the consensus forecast of 82.0. Confidence has increased significantly from the 2009 lows but as the chart below shows, there is plenty of room for this metric to advance – consistent with the emotion pendulum discussed previously.
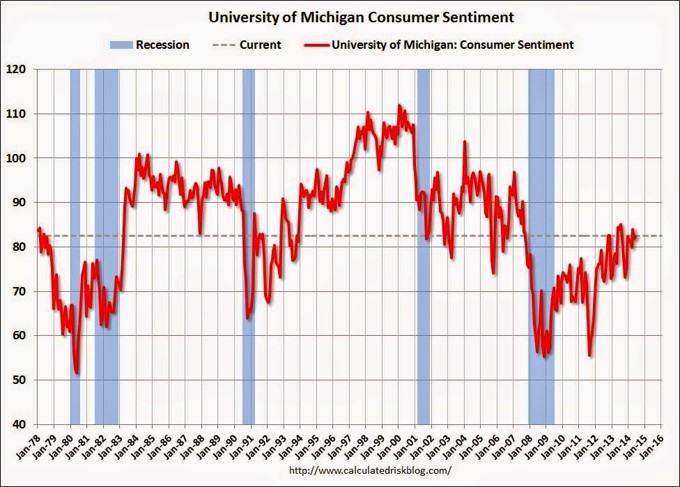
Source: Calculated Risk
Dividends & Share Buybacks Near Record Levels: A bird in the hand is worth two in the bush. Corporations have realized this investor desire and as a result companies are returning record levels of money (“capital”) to stock shareholders via increasing dividends and share buybacks (see chart below).
Source: Dr. Ed’s Blog
Housing on the Mend: The housing market has improved in fits and starts, but the most recent data point of new home sales shows significant improvement. More specifically, May’s new home sales were up +18.6% from the previous month (see chart below), the highest level seen since 2008. Although this data is encouraging, there is still plenty of room for improvement, as current sales remain more than 50% below 2005 peak levels.
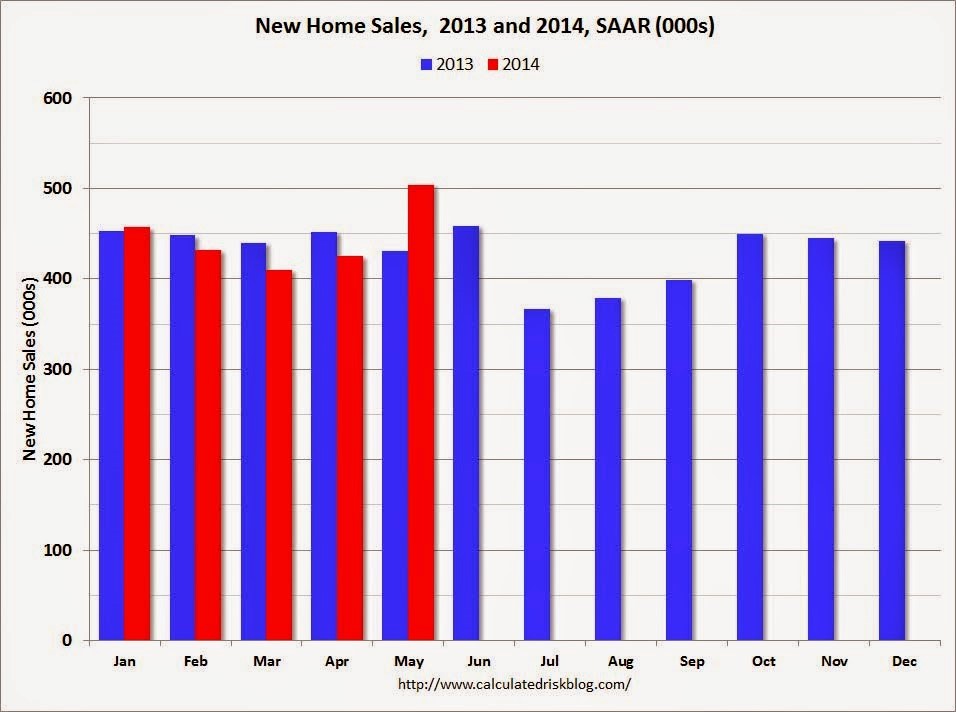
Source: Calculated Risk
Record Industrial Production: Adding support to the improving economic outlook are the industrial production figures, which also hit a record (see chart below). This data also adds credence to why the U.S. stock market has outperformed the European markets during the economic recovery from 2009.
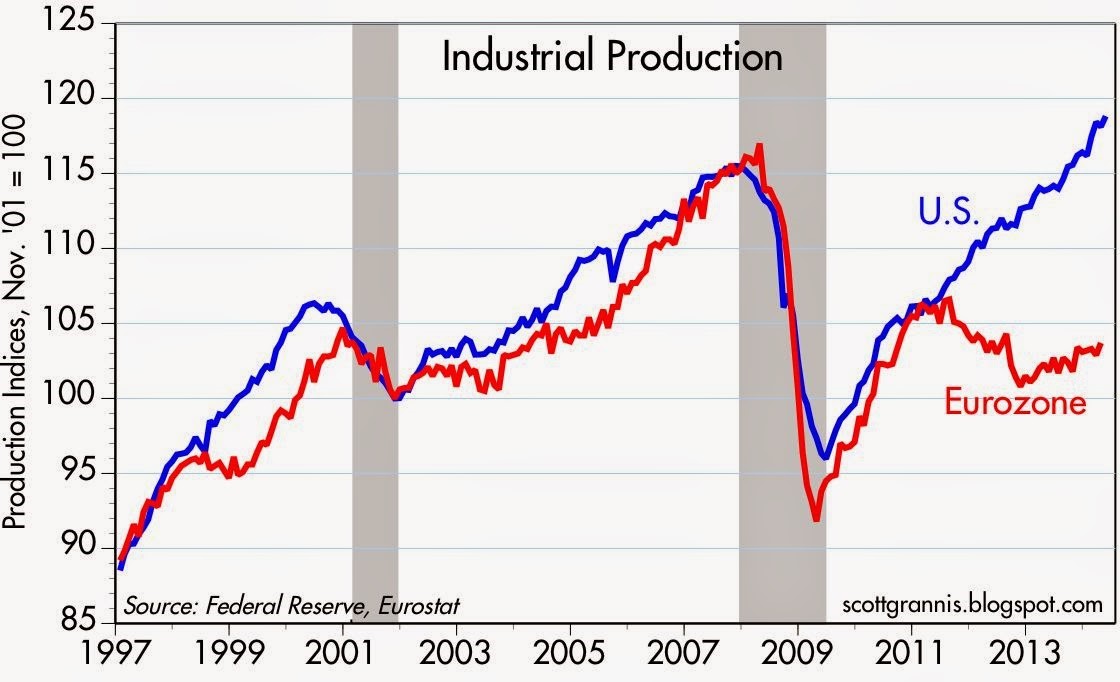
Source: Calafia Beach Pundit
Declining Federal Deficit: The federal deficit continues to narrow (i.e., tax revenues growing faster than government spending), so previous fiscally panicked screams have quieted down. We’re not out of the woods yet, but the trends are encouraging (see chart below):
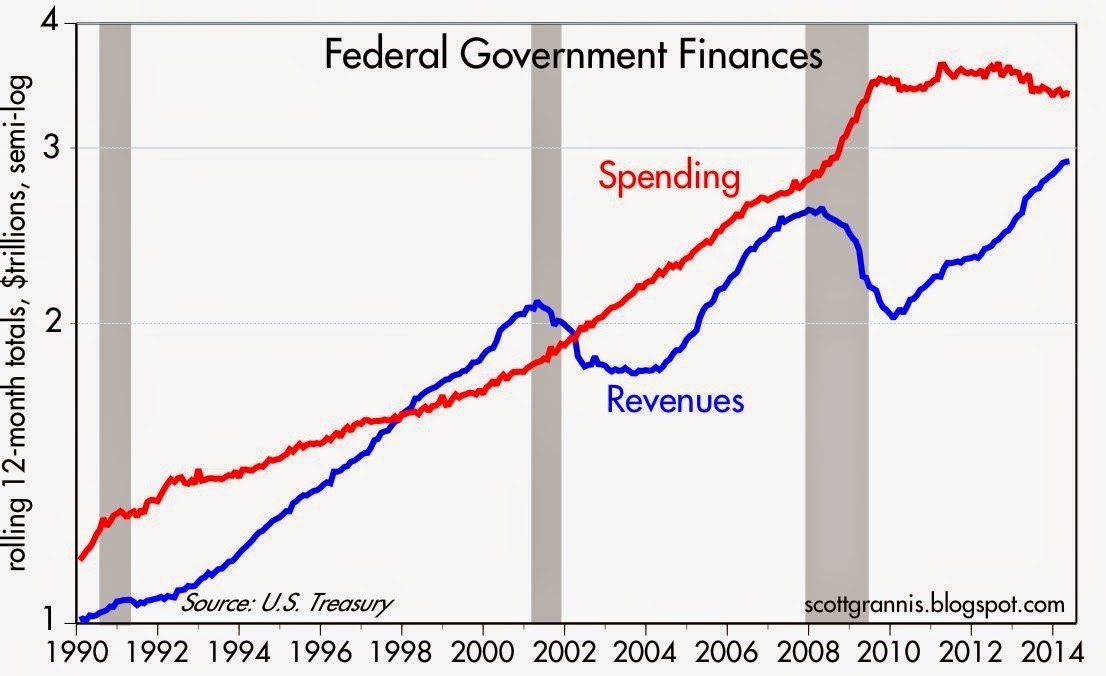
Source: Calafia Beach Pundit
There have been plenty of bombshells during the first half of 2014 (no pun intended), and there are bound to be plenty more during the second half of the year. By definition, nobody can be fully prepared for a surprise, or else it wouldn’t be called a “surprise”. For those skeptical investors sitting on the sidelines, the record breaking stock market performance has also been astonishing. Regardless of what happens over the next six months, periodically making adjustments to your financial plan is important, whether it’s during the pre-game, post-game, or halftime. And if you’re not interested or capable of making those adjustments yourself, find a professional advisor/coach to assist you.
Wade W. Slome, CFA, CFP®
Plan. Invest. Prosper.
DISCLOSURE: Sidoxia Capital Management (SCM) and some of its clients hold long positions in certain exchange traded funds and AGG, but at the time of publishing SCM had no direct position in any other security referenced in this article. No information accessed through the Investing Caffeine (IC) website constitutes investment, financial, legal, tax or other advice nor is to be relied on in making an investment or other decision. Please read disclosure language on IC Contact page.
QE: The Greatest Thing Since Sliced Bread*

Quantitative easing (QE), or the Federal Reserve’s bond buying program, has been a spectacular success. Arguably, the greatest innovation since sliced bread. Don’t believe me? I mean, if you listen to many of the experts, strategists, economists, and blogosphere pundits, the magical elixir of QE can be the only explanation rationalizing the multi-year economic recovery and stock market boom. Don’t believe me? Well, apparently many of the bearish pros make sure to credit QE for all our financial/economic positives. For example…
- QE is the reason the stock market is near all-time record highs.
- QE created seven million jobs in the U.S. over the last four years.
- QE turned around the housing market.
- QE turned around the auto market.
- QE weakened the U.S. dollar, resulting in flourishing exports.
- QE has lowered borrowing rates, thereby cleansing consumer balance sheets through deleveraging.
- QE is the reason Facebook Inc. (FB) hired 1,323 employees over the last year.
- QE is the reason Google Inc. (GOOG) has spent $7.8 billion on R&D over the last year.
- QE explains why McDonald’s Corp. (MCD) plans to open more than 1,400 stores this year.
- QE explains why Warren Buffett and 3G capital paid $28 billion to buy Heinz.
- QE is the reason Elon Musk and Tesla Motors (TSLA) invented the model S electric vehicle.
- QE exhibits why Target Corp. (TGT) is expanding outside the U.S. into Canada.
- QE is the reason why S&P 500 companies are expected to pay $300 billion in dividends this year.
- QE is the reason why S&P 500 companies were buying back shares at a $400 billion clip this year.
- QE is the basis for corporations spending billions on efficiency enhancing cloud-based services.
- QE led to a record number of new FDA drug approvals last year.
- QE has caused a natural gas production boom in numerous shale regions.
Wow…the list goes on and on! Heck, I even hear QE can take the corrosion off of a rusted car battery. Given how incredible this QE stuff is, why even consider tapering QE? Financial markets have been volatile on the heels of tapering the 3rd iteration of quantitative easing (QE3), but why slow QE3, when the FED could add more awesomeness with QE4, QE10, QE 100, and QE 1,000?
All of this QE talk is so wonderful, but unfortunately, according to all the bearish pundits, QE has created an artificial sugar high, thus creating an asset bubble that is going to end in a disastrous cratering of financial markets.
I know it’s entirely possible that QE may have absolutely nothing to do with the financial market recovery (other than a bid under Treasury & mortgage backed security prices), and also has no bearing on why I buy or sell stocks, but I guess I will need to hide in a cave when QE3 tapering begins. Although the end of dividends, share buybacks, housing/auto recoveries, acquisitions, expansion, innovation, etc., caused by QE tapering sure does not sound like a cheery outcome, at least I still have a loaf of sliced bread to make a sandwich.
*DISCLOSURE: For those readers not familiar with my writing style, I have been known to use a healthy dose of sarcasm. Call me if you want a deeper explanation.
Wade W. Slome, CFA, CFP®
Plan. Invest. Prosper.
DISCLOSURE II : Sidoxia Capital Management (SCM) and some of its clients hold positions in certain exchange traded funds (ETFs) and GOOG, but at the time of publishing, SCM had no direct position in FB, TSLA, MCD, BRKA, TGT, or any other security referenced in this article. No information accessed through the Investing Caffeine (IC) website constitutes investment, financial, legal, tax or other advice nor is to be relied on in making an investment or other decision. Please read disclosure language on IC Contact page
Stock Market at Record Highs…April Fool’s?

Article is an excerpt from previously released Sidoxia Capital Management’s complementary April 1, 2013 newsletter. Subscribe on right side of page.
April Fool’s Day has been around for centuries and has provided an opportunity for foolish pranks to be played on the masses around the world. Evidence of the global practice can be found from the bumper spaghetti harvest in Switzerland filmed by the BBC in 1957. The video footage (click here) was so convincing, viewers called and asked how they could grow their own spaghetti.
A cruel prank has also been played on investing skeptics as they have watched the S&P 500 and Dow Jones Industrials indexes catapult to new record highs over the last five quarters (up +25% & +19%, respectively). How can the stock market be setting new records when we have recently experienced a fiscal cliff, sequestration, a deepening European recession, slowing corporate profit growth, anemic GDP (Gross Domestic Product) expansion (0.4% last quarter), and a $13 billion Cyprus bailout?
The short answer is the economy continues to improve at a steady pace; stock prices are attractive; and gloomy headlines sell more advertisements in newspapers, magazines and on television. Is this wealth explosion a practical joke, or how can we help better explain this surprising phenomenon?
1) Record Corporate Profits
Source: Scott Grannis
Corporate profits are at record levels. After the worst financial crisis in a generation, companies have become mean and lean. They are hiring cautiously to maintain healthy profit margins, but also investing into productivity-improving technology and equipment.
2) Record Dividends and Share Buybacks Galore
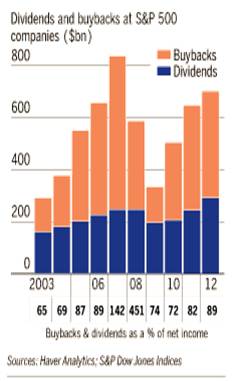
Source: WSJ
Annual dividend payments have reached a record level of more than $300 billion for S&P 500 companies, and there are no signs of this trend slowing down. This is occurring just as interest rates on bonds have been continuing to decline. Tack on a few hundred billion dollars in share buybacks to boost stock prices, and you get a recipe investors are enjoying.
3) Housing on the Comeback Trail
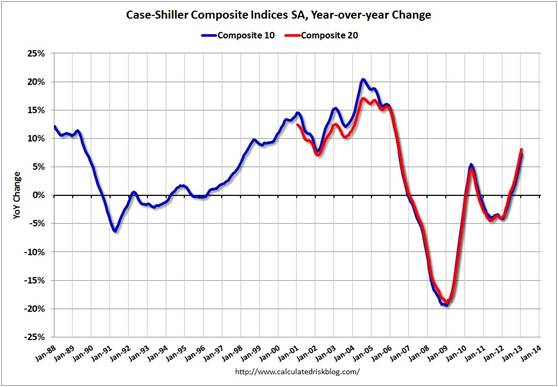
Source: Calculated Risk
Housing accounts for a significant portion of our economy. After several years of depression-like activity, this sector is on the comeback trail. In fact, the S&P/Case-Shiller index, that measures home prices in 20 major metropolitan cities, rose by +8.1% in the most recent reported figure. This increase was the largest gain in six-and-a-half years. This is important because the improvement in housing filters through to other major sectors of the economy, such as retail (e.g., furniture), banking (e.g., mortgages), and government (e.g., property taxes).
4) Consumer Spending Can’t be Killed
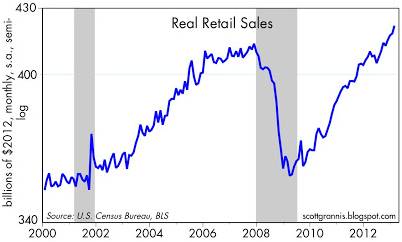
Source: Scott Grannis
Like a cockroach, the consumer is tough to exterminate. Consumer spending accounts for roughly 70% of the economy’s goods and services, and as you can see from the chart above, people are still shopping – despite domestic and international challenges.
The net result of all these trends is that the economic picture continues to improve and consumers and investors alike are beginning to feel better about themselves. And how could they not? As evidenced by the chart below, household net worth has reached a record level of about $66 trillion dollars, thanks to rallies in the stock market and home process, combined with a renewed conviction of keeping debt in check.
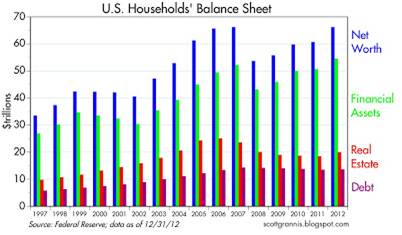
Source: Scott Grannis
Cyprus Side Notes

Over the last month, an avalanche of headlines, relating to the dire financial condition of Cyprus and Cypriot banks, has cascaded across the major media outlets. In analyzing the situation, there were two major questions I wanted answered:
Question #1: What is going on in Cyprus?
As it relates to this tiny island, approximately the size of Puerto Rico (east of Greece and south of Turkey), the first thing I learned is that the Cyprus situation is another example of a country’s financial sector gone wild. By some estimates the size of Cypriot bank deposits were more than 4x’s the size of its GDP. A key driving force behind the oversized banking industry is Russian depositors, who make up about 1/3 of overall Cypriot banking deposits. Cyprus acted as a sort of Cayman Islands in the Mediterranean for these wealthy Russians, who moved billions of dollars to the island after the Soviet Union broke apart in the early 1990s. The main attraction for the Russians were the lax banking laws and generous tax advantages.
In order to clean up this financial mess, the so-called adults or Troika, made up of the European Central Bank (ECB), International Monetary Fund (IMF), and European Commission (EU legislative body), approved a $13 billion bailout for Cyprus on the condition they restructured their main banks (Laiki Bank to be merged into Bank of Cyprus). The end result is that Cyprus (like Greece) chose to take the harsh medicine and stay in the eurozone by combining/closing banks and instituting significant losses on those depositors with more than $130,000 in their accounts (with some depositors expected to lose -60% of their money).
Question #2: Should I care?
The short answer is “No”. With a population of about 850,000 people, Cyprus is home to about the same number of folks who live in Birmingham, Alabama. Moreover, the size of Cyprus’ economy is barely 0.2% of euro-land GDP. Many pessimistic bears acknowledge the infinitesimal size of the Cypriot economy, but position the country as the domino about to topple the rest of Europe, including the much more important countries of Spain and Italy. The fact that private depositors are feeling a larger brunt of the pain rather than public taxpayers is actually a healthy long-term trend that will force more responsible behavior by other European financial institutions outside Cyprus.
In the face of the noisy Cyprus sideshow and endless economic/political worries, our corporate profit machine continues to churn out escalating profits,
as our stock markets set new record highs and our economy gains momentum. Today may be April Fool’s Day, but don’t become bamboozled by silly diversions, this stock market is no joke.
Wade W. Slome, CFA, CFP®
Plan. Invest. Prosper.
DISCLOSURE: Sidoxia Capital Management (SCM) and some of its clients hold positions in certain exchange traded funds (ETFs), but at the time of publishing SCM had no direct position in any security referenced in this article. No information accessed through the Investing Caffeine (IC) website constitutes investment, financial, legal, tax or other advice nor is to be relied on in making an investment or other decision. Please read disclosure language on IC Contact page.
Dividend Floodgates Widen

The recently reported lackluster, monthly employment report made stockholders grumpy (as measured by the recent -168 point decline in the Dow Jones Industrial index) and bondholders ecstatic (as measured by the surge in the 10-year Treasury note price and plunge in yield to a meager 1.88% annual rate). Stocks on the other hand are yielding a much more attractive rate of approximately 7.70% based on 2012 earnings estimates (see chart below) and are also offering a dividend yield of about 2.25%.

S&P 500 earnings yields trouncing bond yields despite historical correlation.
In my view, either stock prices go higher and drive equity yields lower; bonds sell off and Treasury yields spike higher; or a combination of the two. Either way, there are not many compelling reasons to pile into Treasuries, although I fully understand some Treasuries are needed in many investors’ portfolios for income, diversification, and risk tolerance reasons.
Not only are equity earnings yields beating Treasury yields, but so are dividend yields. It has been a generation, or more than 50 years, since the last time stock dividends were yielding more than 10-year Treasuries (see chart below). If you invested in stocks back when dividend yields outpaced bond yields, and held onto your shares, you did pretty well in stocks (the Dow Jones Industrial index traded around 600 in 1960 and over 13,000 today).

Source: The Financial Times
The Dynamic Dividend Payers
The problem with bond payments (coupons), in most cases, is that they are static. I have never heard of a bond issuer sending a notice to a bond holder stating they wanted to increase the size of interest payments to their investors. On the flip side, stocks can and do increase payments to investors all the time. In fact here is a list of some of the longest paying dividend dynamos that have incredible dividend hike streaks:
• Procter & Gamble (PG – 55 consecutive years)
• Emerson Electric (EMR – 54 years)
• 3M Company (MMM – 53 years)
• The Coca-Cola Company (KO – 49 years)
• Johnson & Johnson (JNJ – 49 years)
• Colgate-Palmolive Company (CL – 48 years)
• Target Corporation (TGT – 43 years)
• PepsiCo Inc. (PEP – 39 years)
• Wal-Mart Stores Inc. (WMT – 38 years)
• McDonald’s Corporation (MCD – 35 years)
This is obviously a small number of the long-term consecutive dividend hikers, but on a shorter term basis, more and more players are joining the dividend paying team. So far, in 2012 alone through April, there have been 152 companies in the S&P 500 index that have raised their dividend (a +11% increase over the same period a year ago). Of those 152 companies that increased the dividend this year, the average boost was more than +23%. Some notable names that have had significant dividend increases in 2012 include the following companies:
• Macy’s Inc. (M: +100% dividend increase)
• Mastercard Inc. (MA: +100%)
• Wells Fargo & Company (WFC: +83%)
• Comcast Corp. (CMCSA: +44%)
• Cisco Systems Inc. (CSCO: +33%)
• Goldman Sachs Group Inc. (GS: +31%)
• Freeport McMoran (FCX: +25%)
• Harley Davidson Inc. (HOG: +24%)
• Exxon Mobil Corp. (XOM: +21%)
• JP Morgan Chase & Co. (JPM: +20%)
Lots of Dividend Headroom
The nervous mood of investors is not much different from the temperament of uneasy business executives, so companies have been slow to hire; unhurried to acquire; and deliberate with their expansion plans. Rather than aggressively spend, corporations have chosen to cut costs, hoard cash, grow earnings, buy back shares, and pay out ever increasing dividends from the trillions in cash piling up.
When a company on average is earning an 8% yield on their stock price, there is plenty of headroom to increase the dividend. As a matter of fact, a company paying a 2% yield could increase its dividend by 10% for about 15 consecutive years and still pay a quadrupling dividend with NO earnings growth. Simply put, there is a lot of room for companies to increase dividends further despite the floodgate of dividend increases we have experienced over the last few years. If you look at the chart below, the dividend yield is the lowest it has been in more than a century (1900).

Source: The Financial Times
Perhaps we will experience another “Summer Swoon” this year, but for those selective and patient investors that sniff out high-quality, dividend paying stocks, you will be getting “paid to wait” while the dividend floodgates continue to widen.
Wade W. Slome, CFA, CFP®
Plan. Invest. Prosper.
DISCLOSURE: Sidoxia Capital Management (SCM) and some of its clients own certain exchange traded funds (including Treasury bond ETFs), CMCSA and WMT, but at the time of publishing SCM had no direct position in PG, EMR, MMM, KO, JNJ, CL, TGT, PEP, MCD, M, MA, WFC, CSCO, GS, FCX, HOG, XOM, JPM, or any other security referenced in this article. No information accessed through the Investing Caffeine (IC) website constitutes investment, financial, legal, tax or other advice nor is to be relied on in making an investment or other decision. Please read disclosure language on IC “Contact” page.
Cash Security Blanket Turns Into Tourniquet
![]()
Article is an excerpt from Sidoxia Capital Management’s April 2012 newsletter. Subscribe on right side of page.
That warm safety blanket of cash that millions of Americans have clutched on to during the 2008-09 financial crisis; the 2010 “Flash Crash”; and the 2011 U.S. credit downgrade felt cozy during the bumpy ride we experienced over the last three years. Now with domestic stocks (S&P 500) up +12% in the first quarter of 2012, that same comfy blanket of CDs, money market, and checking accounts is switching into a painful tourniquet, cutting off the lucrative blood and oxygen supply to millions of Americans’ future retirement plans.
Earning next to nothing by stuffing your money under the mattress (0.7% average CD rate – Bankrate.com) isn’t going to make many financial dreams a reality. The truth of the matter is that due to inflation (running +2% to +3% per year), blanket holders are losing about -2% per year in the true value of their savings.
Your Choice: 3 Years or 107 years?
If you like to accumulate money, would you prefer doubling your money in 3 years or 107 years? Although the S&P 500 has more than doubled over the last three years, based on fund flows data and cash balances at the banks, apparently more individuals prefer waiting until the year 2119 (107 years from now) for their money to double – SEE CHART BELOW.

Obviously the massive underperformance of CDs cherry picks the time-period a bit, given the superb performance of stocks from 2009 – 2012 year-to-date. Over 1999-2012 stock performance hasn’t been as spectacular, but what we do know is that despite the lackluster performance of stocks over the last 12 years, corporate profits have about doubled in a similar timeframe, making equity prices that much more attractive relative to 1999.
With the economy and employment picture improving, some doomsday scenarios have temporarily been put on the backburner. As the recovery has gained some steam, many people are opening their bank statements with the painful realization, “I just made $31.49 on my checking maximizer account last year! Wow, how incredible…I can now go out and buy a half-tank of gas.” Never mind that healthcare premiums are exploding, food costs are skyrocketing, and that vacation you were planning is now out of reach. If you’re a mega-millionaire, perhaps you can make these stingy rates work for you, but for most of the other people, successful retirements will require more efficient use of their investment dollars. Or of course you can always work at Wal-Mart (WMT) as a greeter in your 80s.
Rationalizing with a Teen
Some people get it and some don’t. Trying to time the market, by getting in and out at the right times is a losing battle (see Getting Off the Market Timing Treadmill). Even the smartest professionals in the industry have little accuracy and cannot consistently predict the direction of the markets. Rationalizing the ups and downs of the financial markets is equivalent to rationalizing the actions of a teenager. Sometimes the outcomes are explainable, but most of the times they are not.
What an astute investor does know is that higher long-term returns come with higher volatility. So while the last four years have been a bumpy ride for investors, this is nothing new for an experienced investor who has studied the history of financial markets. There have been a dozen or so recessions since World War II, and we’ll have a dozen or so more over the next 50-60 years. Wars, banking crises, currency crises, and political turmoil have been a constant over history. Despite all these setbacks, the equity markets have climbed over +1,300% over the last 30 years or so. The smartest financial minds on the planet (e.g., the Ben Bernankes and Alan Greenspans of the world) haven’t been able to figure it out, so if they couldn’t do it, how is an average Joe supposed to be able to time the market? The answer is nobody can predict the direction of the market reliably.
As my clients and Investing Caffeine followers know, for those individuals with adequate savings and shorter time horizons, much of this conversation is irrelevant. However, based on our country’s low savings rate and the demographics of longer Baby Boomer life expectancies, most individuals can’t afford to stuff all their money under the mattress. As famous investor Sir John Templeton stated, “The only way to avoid mistakes is not to invest – which is the biggest mistake of all.” Earning 0.7% on your nest egg is difficult to call investing.
Ignoring the Experts
Why is the investing game so difficult? For starters, individuals are constantly bombarded by so-called experts through television, radio, and newspapers. Not only did Federal Reserve Chairmen Alan Greenspan and Ben Bernanke get the economy, financial markets, and housing markets wrong, the most powerful and smart financial institution CEOs were dead wrong as well. Look no further than Lehman Brothers (Dick Fuld), Citigroup Inc. (Chuck Prince), and American International Group (Martin Sullivan), which were believed to house some of the shrewdest executives – they too completely missed the financial crisis.
Rather than listening to shoddy predictions from pundits who have little to no investing experience, it makes more sense to listen to successful long-term investors who have survived multiple investment cycles and lived to tell the tale. Those people include the great fund manager Peter Lynch who said it is better to “assume the market is going nowhere and invest accordingly,” rather than try to time the market.
What You Hear
As the market has more than doubled over the last 37 months, here are some clouds of pessimism that these same shoddy economists, strategists, and analysts have described for investors:
* Europe and Greece’s impending fiscal domino collapse
* Excessive money printing at the Federal Reserve through quantitative easing and other programs
* Imminent government disintegration due to unresolved structural debts and deficits
* Elevated unemployment rates and pathetic job creation statistics
* Rigged high frequency trading and “Flash Crash”
* Credit downgrade and political turmoil in Washington
* Looming Chinese real estate bubble and subsequent hard economic landing
Unfortunately, many investors got sucked up in these ominous warnings and missed most, if not all, of the recent doubling in equity markets.
What You Don’t Hear
What you haven’t heard from the popular press are the following headlines:
* 10 consecutive quarters of GDP growth
* Record corporate profits and profit margins
* Equity valuations attractively priced below 50-year average (14.4 < 16.6 via Calafia Beach Pundit)
* Rising dividends with yields approaching 3%, if you consider recent bank announcements
* Record low interest rates and moderate inflation make earnings streams and dividends that much more valuable
* Four million new jobs created over the last three years
* S&P Smallcap near all-time highs (21 years); S&P Midcap index near all-time highs (20 years); NASDAQ is at 11-year highs; Dow Jones Industrials and S&P 500 near 4-year-highs.
* Record retail sales with a consumer that has reduced household debt

Source: Calafia Beach Pundit
Given the massive upward run in the stock market over the last few years (and a complacent short-term VIX reading of 15), stocks are ripe for a breather. With that said, I would advise any blanket holders to not get too comfy with that money decaying away in a CD, money market, or savings account. Waiting too long may turn that security blanket into a tourniquet – forcing investors to amputate a portion of their future retirement savings.
Wade W. Slome, CFA, CFP®
Plan. Invest. Prosper.
DISCLOSURE: Sidoxia Capital Management (SCM) and some of its clients own certain exchange traded funds and WMT, but at the time of publishing SCM had no direct position in C, AIG, RATE, Lehman Brothers, or any other security referenced in this article. No information accessed through the Investing Caffeine (IC) website constitutes investment, financial, legal, tax or other advice nor is to be relied on in making an investment or other decision. Please read disclosure language on IC “Contact” page.
Box Wine, Facebook and PEG Ratios

I’m no wine connoisseur, but I do know I would pay more for a bottle of Dom Pérignon champagne than I would pay for a container of Franzia box wine. In the world of stocks, the quality disparity is massive too. In order to navigate the virtually infinite number of stocks, we need to have an instrument in our toolbox that can assist us in accurately comparing stocks across the quality spectrum. Thank goodness we have the handy PEG ratio (Price/Earnings to Growth) that elegantly marries the price paid for a stock (as measured by the P/E ratio) with the relative quality of the stock (as measured by its future earnings growth rate).

Famed investor Peter Lynch (see Inside the Brain of an Investing Genius) understood the PEG concept all too well as he used this tool religiously in valuing and analyzing different companies. Given that Lynch earned a +29% annual return from 1977-1990, I’ll take his word for it that the PEG ratio is a useful tool. As highlighted by Lynch (and others), the key factor in using the PEG ratio is to identify companies that trade with a PEG ratio of less than 1. All else equal, the lower the ratio, the better potential for future price appreciation. Facebook Vs. Eastman Kodak
To illustrate the concept of how a PEG ratio can be used to compare stocks with two completely different profiles, let’s start by answering a few questions. Would a rational investor pay the same price (i.e., Price-Earnings [P/E] ratio) for a company with skyrocketing profits as they would for a company going into bankruptcy? Look no further than the lofty expected P/E multiple to be afforded to the shares of the widely anticipated Facebook (FB) initial public offering (IPO). That same rational investor is unlikely to pay the same P/E multiple for a money losing company like Eastman Kodak Co. (EKDKQ.PK) that faces product obsolescence. The contrasting values for these two companies are stark. Some pundits are projecting that Facebook shares could fetch upwards of a 100x P/E ratio, while not too long ago, Kodak was trading at a P/E ratio of 4x. Plenty of low priced stocks have outperformed expensive ones, but remember, just because a “value” stock may have a lower absolute P/E ratio in the recent past, does not mean it will be a better investment than a “growth” stock sporting a higher P/E ratio (see Fallacy of High P/Es).
Price, Earnings, and Dividends
As I’ve written in the past, a key determinant of future stock prices is future earnings growth (see It’s the Earnings Stupid). The higher the P/E multiple, the more important future earnings growth becomes. The lower the future growth, the more important valuation and dividends become.
We can look at various money-making scenarios that incorporate these factors. If my goal were to double my money in 5 years (i.e., earn a 100% return), there are numerous ways to skin the profit-making cat. Here are four examples:
1) Buy a non-dividend paying stock of a company that achieves earnings growth of 15%/year and maintains its current P/E ratio over time.
2) Buy a stock of a company that has a 5% dividend and achieves earnings growth of 11%/year and maintains its current P/E ratio over time.
3) Buy a value stock with a 5% dividend that achieves earnings growth of 5%/year and increase its P/E ratio by 10% each year.
4) Buy a non-dividend paying growth stock that achieves earnings growth of 20%/year and decreases its P/E ratio by about 5% each year.
I think you get the idea, but as you can see, in addition to earnings growth, dividends and valuation do play a significant role in how an investor can earn excess returns.
Lynch’s Adjusted PEG
Peter Lynch added a slight twist to the traditional PEG analysis by accounting for the role of dividends in the denominator of the PEG equation:
PEG (adjusted by Lynch) = PE Ratio/(Earnings Growth Rate + Dividend Yield)
This “adjusted PEG” ratio makes intuitive sense under various perspectives. For starters, if two different companies both had a PEG ratio of 0.8, but one of the two stocks paid a 3% dividend, Lynch’s adjusted PEG would register in at a more attractive level of 0.6 for the dividend paying stock.
Looked at under a different lens, let’s suppose there are two lemonade stands that IPO their stocks at the same time, and both companies use the exact same business model. Moreover, let us assume the following:
• Lemonade stand #1 has a P/E of 14x and growth rate of 15%.
• Lemonade stand #2 has a P/E of 12x and growth rate of 8%, but it also pays a dividend of 3%.
Given this information, which one of the two lemonade stands would you invest in? Many investors see the lower P/E of Lemonade stand #2, coupled with a nice dividend, as the more attractive opportunity of the two. But as we can see from Lynch’s “adjusted PEG” ratio, Lemonade stand #1 actually has the lower, more attractive value (.9 or 14/15 vs 1.1 or 12/(8+3)).
This analysis may be delving into the weeds a bit, but this framework is critical nonetheless. Valuation and earnings projections should be essential components of any investment decision, and with record low interest rates, dividend yields are playing a much more important role in the investment selection process. Regardless of your purchase decision thought process, whether deciding between Dom Perignon and box wine, or Facebook and Kodak shares, having the PEG ratio at your disposal should help you make wise and lucrative decisions.
Wade W. Slome, CFA, CFP®
Plan. Invest. Prosper.
DISCLOSURE: Sidoxia Capital Management (SCM) and some of its clients own certain exchange traded funds, but at the time of publishing SCM had no direct position in FB, EKDKQ.PK, or any other security referenced in this article. No information accessed through the Investing Caffeine (IC) website constitutes investment, financial, legal, tax or other advice nor is to be relied on in making an investment or other decision. Please read disclosure language on IC “Contact” page.
2011: Beating Batter into Flat Pancake

As it turns out, 2011 can be characterized as the year of the pancake…the flat pancake. While the Dow Jones Industrial Average (Dow) rose about 6% this year (its third consecutive annual gain), the S&P 500 ended the year flat at 1257.6 (-0.003%), the smallest yearly move in more than four decades. Along the way in 2011, there was plenty of violent beating and whipping of the lumpy pancake batter before the flat cake was cooked for the year. With respect to the financial markets, the 2011 lumps came in the form of various unsavory events:
* Never-Ending Eurozone Financial Saga: After Ireland and Portugal sought bailouts, Greece added its negligent financial storyline to the financial soap opera. Whether European government leaders can manage out-of-control deficits and debt loads will determine if Greece and other peripheral countries will topple larger countries like Italy and Spain.
* Credit Rating Downgrade: Standard & Poor’s, the highest profile credit rating agency, downgraded the U.S.’s long-term debt rating to AA+ from AAA due to high debt levels and Congressional legislators inability to hammer out a deficit-reduction plan during the debt ceiling negotiations.
* Japanese Earthquake and Tsunami: Japan and the global economy were rocked by a magnitude 9.0 earthquake and tsunami on March 11, 2011, which resulted in 15,844 people dead and 3,451 people missing. The ripple effects are still being felt through large industries like the automobile and electronics industries.
* Arab Spring Protests: Protesters throughout the Middle East and North Africa provided additional uncertainty to the global political map as demonstrators demanded regime change and more political freedoms. In the long-run, removing oppressive leaders like Hosni Mubarak (Egypt’s leader for 30 years), Muammar Gadaffi (Libya’s leader for 42 years), and Zine al-Abidine Ben Ali (Tunisia’s president for 23 years) should be beneficial for global stability, but in the short-run, how the new leadership vacuum will be filled remains ambiguous.
* Occupy Movement Voices Disapproval: The Occupy Wall Street movement began on September 17, 2011 in Liberty Square in Manhattan’s Financial District, and spread to over 100 cities in the U.S. There has not been a cohesive articulated agenda, but a common thread underlying all the Occupy movements is a sense that 99% of the population is being treated unfairly due to a flawed corrupt system controlled by Wall Street that is feeding the richest 1%.
All these lumps experienced in 2011 were not settling to investors’ stomachs. As a result individuals continued the trend of piling into bonds, in hopes of soothing their investment tummies. Long-term Treasury prices spiked upwards in 2011 (+29% as measured by TLT Treasury ETF) and soaring 10-year Treasury note prices pushed yields (1.87%) below yields on S&P 500 equities (2.1%). Despite a more than 3,400 point increase in the Dow (+39%) since the end of 2008, investors have still poured $774 billion into bonds versus $33 billion yanked from equities, according to EPFR Global. Over-weighting bonds makes sense for some, including retirees on fixed budgets, but many investors should brace for an inevitable reversal in bond prices. Eventually, the sweet taste of safety achieved from bond appreciation will turn to heartburn, once interest rates reverse their 30 year trend of declines.
Syrupy Factors Help Sweeten Pancakes

Although the aforementioned factors lead to historically high volatility and flat flavors in 2011, there are also some countering sweet reasons that make equities look more palatable for 2012. Here are some of the factors:
* Record Corporate Profits: Even with the constant barrage of fear, uncertainty, and doubt distributed via the media channels, corporations posted record profits in 2011, with an estimated increase of +16% over last year (and another forecasted +10% rise in 2012 – Source: S&P).
* Historic Levels of Cash: Record profits mean record cash, and all those riches have been piling up on non-financial corporate balance sheets at historic levels. At the beginning of Q4 the figure stood at $2.12 trillion. Companies have generally been stingy, but as the recovery progresses, they have increasingly been spending on technology, equipment, international expansion, and even the beginnings of hiring.
* Interest Rates at 60 Year Lows: Interest rates are at record lows and home affordability has never been better with 30-year fixed rate mortgages hovering below 4%. Housing may not come screaming back, but the foundation for a recovery is being laid.
* Improving Economic Variables: Whether you’re looking at broader economic activity (Gross Domestic Product up for nine consecutive quarters); employment growth (declining unemployment rate and 21 consecutive months of private job creation), or consumer spending (consumer confidence approaching multi-year highs), all major signs are currently pointing to an improving outlook.
* Near Record Exports: While the U.S. dollar has made some recent gains against foreign currencies because of the financial crisis in Europe, the relative value of the dollar remains historically low versus the major global currencies. The longer-term depreciation of the dollar has buoyed exports of U.S. goods to near record levels despite the global uncertainty.
* Unprecedented Central Bank Support Globally: Ben Bernanke and the U.S. Federal Reserve is committed to keeping exceptionally low levels of lending interest rates at least through mid-2013, while also implementing “Operation Twist” and potential further quantitative easing (QE3). Translation: Ben Bernanke is going to do everything in his power to keep interest rates low in order to stimulate economic growth. The European Central Bank (ECB) has pulled out its lending fire trucks too, with an unparalleled three-year lending program to extinguish liquidity fires in the European banking sector.
* Improving Mergers & Acquisitions Environment: We may not be back to the 2006 buyout “hay-days,” but U.S. mergers and acquisitions activity increased +24% in 2011. What’s more, high profile potential IPOs like an estimated $100 billion Facebook offering may help kick-start the new equity issuance market in 2012.
* Tasty Fat Dividends: Rarely have S&P 500 dividend yields (currently 2.1%) outpaced the interest rates earned on 10-year Treasury note yields, but now happens to be one of those times. Typically S&P 500 stock dividends have averaged about 40% of the yield on 10-year Treasury notes, and now it is 112%. In Q3 of 2011, dividend increases rose +17% and expectations are for nearly a +11% increase in 2012, said Howard Silverblatt, senior index analyst at S&P.
Any way you cut it (or beat the batter), 2011 was a volatile year. And despite all the fear, uncertainty, and doubt, profits continue to grow and sovereign nations are being forced to deal with their fiscal problems. Unforeseen risks always exist, but if Europe can contain its financial crisis and the U.S. recovery can continue into this new election year, then opportunities in the 2012 attractively priced equity markets should sweeten the flat equity pancake we ate in 2011.
Wade W. Slome, CFA, CFP®
Plan. Invest. Prosper.
DISCLOSURE: Sidoxia Capital Management (SCM) and some of its clients own certain exchange traded funds, including a short position in TLT, but at the time of publishing SCM had no direct position in any other security referenced in this article. No information accessed through the Investing Caffeine (IC) website constitutes investment, financial, legal, tax or other advice nor is to be relied on in making an investment or other decision. Please read disclosure language on IC “Contact” page.
Fear & Greed Occupy Wall Street in October

Excerpt from Free November Sidoxia Monthly Newsletter (Subscribe on right-side of page)
Fear and frustration dominated investor psyches during August and September as backlash from political gridlock in the U.S. and worries of European contagion dominated action in volatile investment portfolios. Elevated 9.1% unemployment and a sluggish recovery in the U.S. also led populist Occupy Wall Street protesters to flood our nation’s streets, blaming the bankers and the wealthy as the cause for personal misfortunes and the widening gap between rich and poor. However, in the face of the palpable pessimism, economic Halloween treats and greedy corporate profits scared away bearish naysayers like invisible ghosts during the month of October.
While many investors stayed home for Halloween in the supposed comfort of their inflation-losing savings accounts and bonds, those investors choosing to brave the chilling elements in the frightening equity markets were handsomely rewarded. Stockholders tasted the sweet pleasure of a +11% October return in the S&P 500 index, the largest monthly advance in 20 years.
Of course, as I always advise, investors should not load themselves to the gills in stocks just to chase performance. Rather, investors should construct a diversified portfolio designed to meet one’s objectives, constraints, risk tolerance, and liquidity needs. Within that context, a portfolio should also periodically rebalance by selling pricey investments (i.e., Treasuries) and redeploy those proceeds into unloved investments (i.e., equities).
Glass Half Full

There is never a shortage of reasons to be fearful and a one-month rally in equities is not reason enough to blindly pile on risk, but there are plenty of reasons to counter the endless pessimism pornography peddled by media outlets on a continuous basis. Here are some of the “half-full” reasons:
- Euro Plan in Place: After months of conflicting headlines, European leaders reached an agreement to increase the European Union’s bailout fund to one trillion euros ($1.4 trillion) and negotiated a -50% debt reduction deal with Greek bondholders. In addition, European officials agreed on a plan to increase bank reserves by 106 billion euros to support potential bank losses due to European debt defaults. This plan is not a silver bullet, but it is a start.
- Bulging Corporate Profits: With the majority of S&P 500 companies now having reported their actual third quarter results, profit growth is estimated to exceed +16% for the three month period ending in September. Expectations for fourth quarter earnings are currently forecasted to top a respectable +11% growth rate (Data from Thomson Reuters).
- Tortoise-Like Growth Continues: Even though it’s Halloween, the double-dip recession boogeyman is still hiding. U.S. economic growth actually accelerated its growth to +2.5% in the third quarter on a year-over-year basis, up from +1.3% last quarter. The growth in Gross Domestic Product (GDP) was primarily driven by consumer and business spending.
- Jobs Still on the Rise: The unemployment rate remains stubbornly high, but offsetting the ongoing decline in government jobs has been a 19 consecutive month spurt in private job creation activity, resulting in +2.6 million jobs being added to the economy over the period. This doesn’t make up for the 8 million+ jobs lost during the 2008-2009 recession, but the economy is moving in the right direction.
- Consumers Opening Wallet: Consumers can be like cockroaches in that they are difficult to kill off when it comes to spending. Consumers whipped out their wallets in September as retail sales advanced at a brisk +7.9% pace (+7.8% excluding auto sales).
- Dividends on the Rise: While nervous Nellies park money in money losing cash and Treasuries (on an inflation-adjusted basis), corporations flush with cash are increasing dividends at a rapid clip. According to Standard & Poor’s rating agency, dividend increases rose over +17% during the third quarter of 2011. As of October 25th, the indicated dividend for the S&P stood at a decent +2.20% rate.
I am fully aware that equity investors are not out of the woods yet, as the European debt crisis has not been resolved, and the structural deficit/debt issues we face in the U.S. still have a long way to go before becoming disentangled. As a matter of fact, fear is building as we approach the looming deficit reduction Super Committee resolution (or lack thereof) later this month – I can hardly wait. If a $1.5 trillion bipartisan debt reduction agreement can’t be reached, some bored Occupy Wall Street protesters can shift priorities and take a tour bus to Washington D.C. to demonstrate. Regardless of the potential grand European or Washington debt plans that may or may not transpire, observers can rest assured fear and greed are two emotions that will remain alive and well when it comes to Wall Street and “Main Street” portfolios.
Wade W. Slome, CFA, CFP®
Plan. Invest. Prosper.
DISCLOSURE: Sidoxia Capital Management (SCM) and some of its clients own certain exchange traded funds, but at the time of publishing SCM had no direct position in any other security referenced in this article. No information accessed through the Investing Caffeine (IC) website constitutes investment, financial, legal, tax or other advice nor is to be relied on in making an investment or other decision. Please read disclosure language on IC “Contact” page.
September Surge: Stop, Go, or Proceed Cautiously?

The stock market just posted its strongest September and third quarter performance in more than seven decades (S&P 500 +8.8% and +10.7%, respectively), yet people are still waiting for a clear green light to signal blue investment skies ahead. Well of course, once it is apparent to everyone that the economy is obviously back on track, the opportunities persisting today will either be gone or vastly diminished. I’m not a blind optimist, but a sober realist that understands, like Warren Buffett, that it pays to “buy fear and sell greed.” And fear is exactly what we are witnessing today. The $2.6 trillion sitting in CDs earning a horrendously low 1% is simple proof (Huffington Post).
Like the fresh memory of a recent hand burned on the stove, the broader general public is still feeling the pain and recovering from the financial crisis. Each gloomy real estate or unemployment headline triggers agonizing flashbacks (read Unemployment Hypochondria) of the 2008-2009 financial collapse and leads to harmful emotional investment decisions. However, for some of us finance geeks that have cut through the monotony of “pessimism porn” blasted over the airwaves, we have discovered plenty of positive leading economic indicators bubbling up below the surface, like the following:
- Continued Economic Growth: Gross Domestic Product (GDP) grew +1.7% in the second quarter and current estimates stand in the +2.0% to +2.5% range for third quarter GDP, which will mark the fifth consecutive quarter of growth.
- Growing Corporate Profits: S&P 500 earnings are estimated to expand by +45.6% in 2010 and are estimated to grow by another +15% or so next year (Standard & Poor’s September 2010).
- Escalating M&A: Mergers and acquisitions activity increased to $566.5 billion in the third quarter. The value of announced transactions is up +60% from a year ago according to Bloomberg. If you have a tough time comprehending the pickup in M&A, then take a peek here.
- Record Cash Piles: The top 1,000 largest global corporations held a whopping $2.87 trillion in cash (Bloomberg).
- Accelerating Share Buybacks: Share buybacks totaled $77.6 billion in the second quarter, up +221% from a record low last year – Barron’s).
- Dividends Galore: S&P 500 companies have lifted their payouts by $15 billion so far this year versus a reduction of $40 billion for the same period last year (The Wall Street Journal). Tech giant Cisco Systems Inc. (CSCO) announced the pending initiation of a dividend, while Microsoft Corp. (MSFT) increased its dividend by a significant +23%.
I’m not naïve enough to believe choppy waters will disappear for good, but despite the depressing headlines there are constructive undercurrents. Beyond the points above, equity market prices remain attractive relative to the broader fixed-income markets (see Bubblicious Bonds) . More specifically, the S&P 500 is priced at about a 25% discount to historic valuation averages over the last 55 years (currently trading at about 12.5 Price/Earnings ratio vs 16.5x historic Price/Earnings ratio – Bloomberg). Now may not be the time to recklessly run a red light, but if you fearfully remain halted in front of the green light then prepare to receive a pricey ticket.
Wade W. Slome, CFA, CFP®
Plan. Invest. Prosper.
DISCLOSURE: Sidoxia Capital Management (SCM) and some of its clients own certain exchange traded funds and CSCO, but at the time of publishing SCM had no direct position in MSFT, or any other security referenced in this article. No information accessed through the Investing Caffeine (IC) website constitutes investment, financial, legal, tax or other advice nor is to be relied on in making an investment or other decision. Please read disclosure language on IC “Contact” page.
Microsoft Makes Dividend Splash

Source: ActingLikeAnimals.com
I’ve talked about growing profits and cash piles for a while now (read more), but at some point investors and board members get restless and demand action (Steve Jobs has not yet). The most recent blue-chip company to make a splash, when it comes to capital management, is Microsoft Corp. (MSFT), which just announced a significant +23% increase in its dividend in conjunction with $4.75 billion in debt offerings. These capital structure changes still leave plenty of room for additional share repurchases and acquisitions.
Debt Offering – Are You Sure?
Huh? What in the heck is Microsoft doing borrowing money? I mean, does a company with $44 billion in cash and investments, generating a whopping additional $22 billion in free cash flow in fiscal 2010 (ended in June), really need access to additional capital? The short answer is “NO.” But a company like Microsoft borrowing $4.75 billion is like Donald Trump borrowing $50 on his credit card. Well wait, “The Donald” has actually had some hair and Chapter 11 problems, so the more appropriate analogy would be Bill Gates borrowing $20 on his credit card. Not only is it a rounding error, but it’s a good financial management practice for corporations to take advantage of the debt tax shield (read definition).
What makes Microsoft’s debt issuance that much more incredible is the astonishingly low rates the company is paying investors on the debt. According to Dealogic, Microsoft set a record low for yield paid on corporate unsecured debt. For the separate maturities ranging from 2013 to 2040, Microsoft paid a stunningly low 25-83 basis point spread over Treasuries. I don’t want to get into government credit worthiness today, but who knows, maybe Microsoft will pay lower debt rates than the U.S. Treasury, in the not too distant future?!
Regardless of the array of capital structure management strategies used by other companies, Microsoft is not alone in dealing with its cash hoarding problems. Cisco Systems Inc. (CSCO), another blue-chip cash printing press, just announced the initiation of a 1-2% dividend to be paid by the end of their fiscal year ending in July 2011 (read more about dividend cash “un-hoarding”).
But Who Cares?
Who cares about Microsoft’s wimpy 2.62% yield anyway? Well, for one, I sure care! A 10-year Treasury Note is yielding a measly, static 2.55%. If Microsoft continued on the same dividend path growth over the next five years as it did over the last five years, investors could potentially be talking about a 5.2% yield on our initial investment, and this excludes any potential stock price appreciation. With only roughly a 25% payout ratio on Microsoft’s fiscal 2010 free cash flow, the company has a lot of freedom to hike future dividends, even if earnings don’t grow. Microsoft has also enhanced shareholder value by putting its money where its mouth is by purchasing over $30 billion of company stock over the last three years.

Nice trend in dividend growth.
The extreme case of dividend growth is Wal-Mart Stores (WMT), which if purchased in 1972 would provide a +2,300% yield on the original investment, excluding any benefit from the massive price appreciation ($.05 split-adjusted per share to $53.65). Microsoft is no young chick like Wal-Mart 40 years ago, but you get the gist (read Dividend Sapling to Fruit Tree).
So while strategists and economists fret about the possibilities of a “double dip” recession, in the interim there have been 179 companies in the S&P 500 index that have hiked dividends in 2010 (versus only 3 companies that have cut). Microsoft has been no slouch either, growing revenues by +22% and EPS (Earnings Per Share) by +50% in their most recent fiscal fourth quarter. Although Microsoft’s stock is down -20% for 2010, the capital management and dividend splash recently announced by Microsoft (and other companies) should eventually capture the eye of investors currently earning squat on overpriced bonds and almost worthless Certificates of Deposit.
Read complete Microsoft dividend story
Wade W. Slome, CFA, CFP®
Plan. Invest. Prosper.
DISCLOSURE: Sidoxia Capital Management (SCM) and some of its clients own certain exchange traded funds, CSCO, nd WMT, but at the time of publishing SCM had no direct position in MSFT, or any other security referenced in this article. No information accessed through the Investing Caffeine (IC) website constitutes investment, financial, legal, tax or other advice nor is to be relied on in making an investment or other decision. Please read disclosure language on IC “Contact” page.


