Posts tagged ‘debt’
No Market Misgiving on This Thanksgiving

We’ll see if there is any gravy left for investors during the last month of the year, but so far 2024 has been a satiating feast that has stuffed investors. There has been a cornucopia of items to be thankful for, including the Federal Reserve, which is expected to provide some dessert this month in the form of its third interest rate cut this year.
Investors certainly can also be grateful for the performance of the stock market, which has had a phenomenal year thus far (see chart below):
• S&P 500: +26.5%
• Dow Jones Industrial Average:+19.2%
• NASDAQ: +28.0%

On a two-year basis, the S&P 500 results look even tastier: +57.1%
Why is there such a large appetite for stocks? For starters, we are coming off a fresh election last month, and the majority of Americans decided to vote for the new administration that has promised additional stimulative tax cuts, and deregulation. If these promises come to fruition, these changes could augur well for corporate profits and a rising stock market. Regardless of whether your candidate won or lost the election, investors can agree there is less uncertainty with an uncontested election, which is welcomed by all. In addition, the two Fed rate cuts that started in September have also buoyed enthusiasm.
What is less clear are the effects of President-elect Donald Trump’s tariff policy threats, which if enacted run the risk of increasing inflation, stifling global trade, and jeopardizing future Fed rate cuts. Combined, these negative side effects have the potential of significantly dampening economic growth. On the other hand, if the tariffs are only used as a negotiating tool with our larger trading partners (including China, Mexico, Canada, and Europe), the tariff discussion will likely have more bark than bite. Time will tell.
Dissecting Stock Performance & Valuations
A lot of pundits are pointing to an overheated market, but on a 3-year basis, returns are looking more normalized (+8.2% per year) because of the -20% hit on stocks during 2022. As you may recall, much of the 2022 decline was caused by the Fed slamming on the economic breaks with its fastest rate-hiking cycle in four decades (raising rates from 0.0% to 5.5%).
Objectively, stock values, as measured by the Price-Earnings (P/E) ratio of the S&P 500, are at elevated levels – registering in at approximately 22-times next year’s forecasted profits. As you can see from the chart below, the stock market is priced at levels not seen since 2001 and valuations are roughly double what they were at the lows of the 2008 Financial Crisis.

Source: Yardeni.com
A major reason for escalated valuations has been the concentration of performance in the largest seven companies, or the so-called Magnificent 7 stocks, which include, Apple, Microsoft, Alphabet, Amazon.com, Nvidia, Meta Platforms and Tesla. In fact, the index concentration is the highest it has been in more than a half century – even higher than at the peak of the 2000 Tech Bubble when Cisco Systems, Microsoft, GE, Intel, and Exxon Mobil were the five largest companies by market capitalization (see chart below).

The good news is the other 493 companies in the S&P 500 (I call them the “Absentee 493”) are priced much more reasonably. This bifurcated dynamic between the largest seven companies versus everything else, highlights the plethora of opportunities available to be harvested in Value stocks, Small-cap stocks, and Mid-cap stocks.
As is evident in the chart below, the S&P 500 index (red-line), which is skewed by the Magnificent 7, is about 30% more expensive than Small-cap and Mid-cap stocks, which are hovering near historically attractive valuation levels.

Source: Yardeni.com
Value stocks (blue-line) in the market look equally attractive (about 30% cheaper than the S&P 500), as can be seen in the chart below.

Source: Yardeni.com
As always, the future is uncertain, and risks abound for next year. But 2024 has been a blockbuster year and there has been plenty to be thankful for, especially the performance of the U.S. stock market.
Wade W. Slome, CFA, CFP®
Plan. Invest. Prosper.
This article is an excerpt from a previously released Sidoxia Capital Management complimentary newsletter (December 2, 2024). Subscribe Here to view all monthly articles.
DISCLOSURE: Sidoxia Capital Management (SCM) and some of its clients hold positions in AAPL, AMZN, MSFT, GOOGL, META, TSLA, NVDA, and certain exchange traded funds (ETFs), but at the time of publishing had no direct position in CSCO, GE, XOM, INTC or any other security referenced in this article. No information accessed through the Investing Caffeine (IC) website constitutes investment, financial, legal, tax or other advice nor is to be relied on in making an investment or other decision. Please read disclosure language on IC Contact page.
AI Revolution and Debt Ceiling Resolution

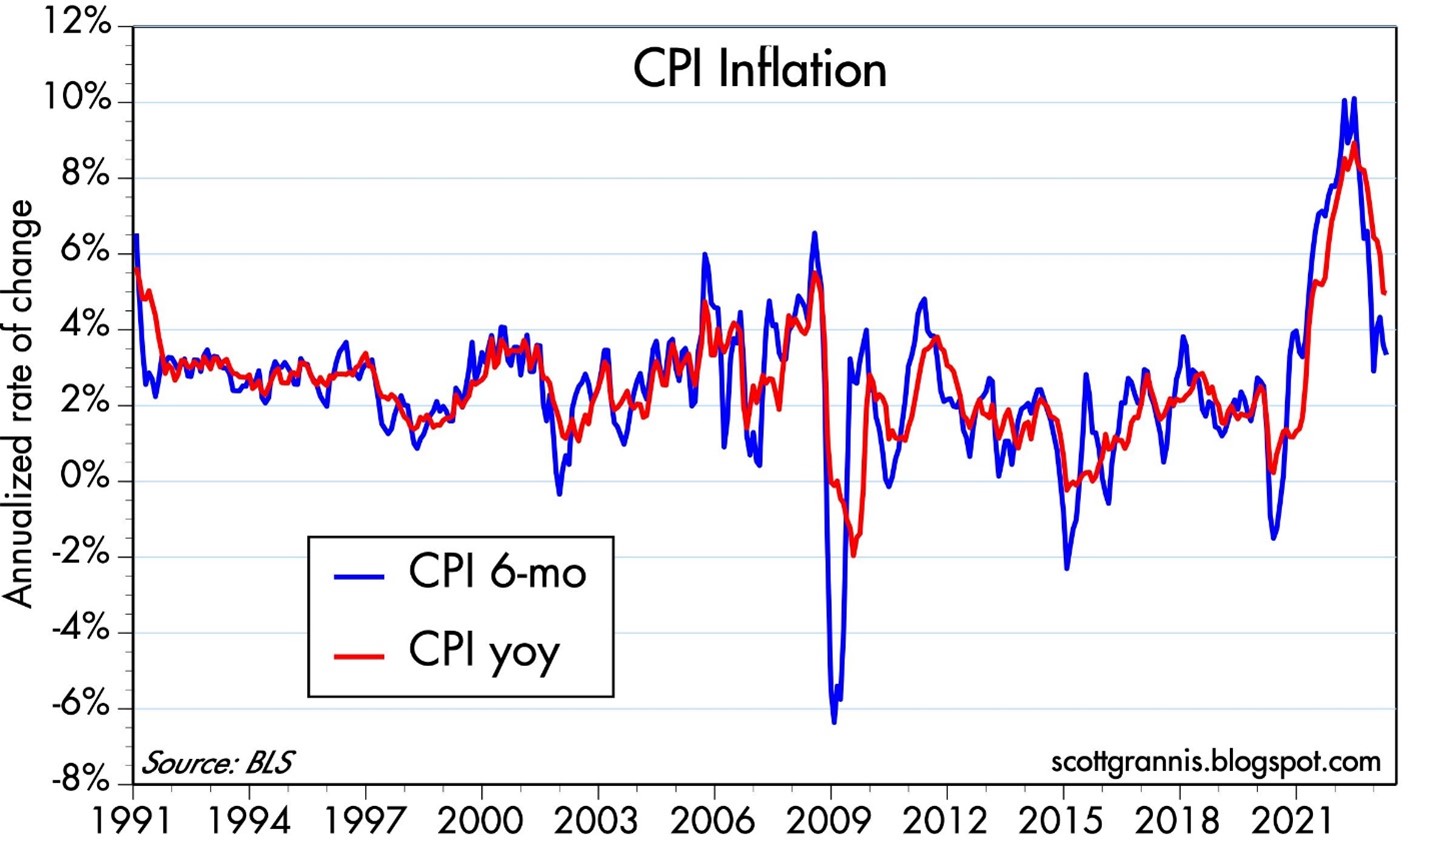
On the surface, last month’s performance of the stock market as measured by the S&P 500 index (+0.3%) seemed encouraging, but rather pedestrian. Fears of sticky-high inflation, more potential Federal Reserve interest rate hikes, contagion uncertainty surrounding a mini-banking crisis, along with looming recession concerns led to a -3.5% monthly decline in the Dow Jones Industrial Average (-1,190 points). The good news is that inflation is declining (see chart below) and currently the Federal Reserve is expected to pause from increasing interest rates in June (the first time in more than a year).
Source: Calafia Beach Pundit
Overall stock market performance has been a mixed-bag at best. Adding to investor anxiety, if you haven’t been living off-the-grid in a cave, is the debt ceiling negotiations. Essentially, our government has maxed out its credit card spending limit, but Republicans and Democrats have agreed in principle on a resolution for an expanded credit line. More specifically, the House of Representatives just approved to raise the debt ceiling by a resounding margin of 314 – 117. If all goes well, after months of saber rattling and brinksmanship, the bill should be finalized by the Senate and signed by the President over the next two days.
Beyond the Washington bickering, and under the surface, an artificial intelligence (AI) revolution has been gaining momentum and contributed to the technology-heavy NASDAQ catapulting +5.8% for the month and +23.6% for 2023. At the center of this disruptive and transformational AI movement is NVIDIA Corp., a leading Silicon Valley chip manufacturer of computationally-intensive GPUs (graphics processing units), which are used in generative AI models such as OpenAI’s ChatGPT (see NVIDIA products below). Adoption and conversations surrounding NVIDIA’s AI technology have been spreading like wildfire across almost every American industry, resulting in NVIDIA’s stratospheric stock performance (+36% for the month, +159% for the year, +326% on a 3-year basis).

Source: NVIDIA Corp. – the computing engines behind the AI revolution.
Why Such the Fuss Over AI?
Some pundits are comparing AI proliferation to the Industrial Revolution – on par with productivity-enhancing advancements like the steam engine, electricity, personal computers, and the internet. The appetite for this new technology is ravenous because AI is transforming a large swath of industries with its ability to enhance employee efficiency. By leveraging machine learning algorithms and massive amounts of data, generative AI enables businesses to automate repetitive tasks, streamline processes, and unlock new levels of productivity. A study released by MIT researchers a few months ago showed that workers were 37% more efficient using ChatGPT.
If you have created an account and played around with ChatGPT at all you can quickly realize there are an endless number of potential applications and use-cases across virtually all industries and job functions. Already, application of generative AI systems is disrupting e-commerce, marketing, customer service, healthcare, robotics, computer vision, autonomous vehicles, and yes, even accounting. Believe it or not, ChatGPT recently passed the CPA exam! Maybe ChatGPT will do my taxes next year?
Other industries are quickly being disrupted too. Lawyers may feel increased pressure when contracts or briefs can be created with a click of the button. Schools and teachers are banning ChatGPT too in hopes of not creating lazy students who place cheating and plagiarism over critical thinking.
At one end of the spectrum, some doomsday-ers believe AI will become smarter than humans, replace everyone’s job, and AI robots will take over the world (see Elon Musk warns AI could cause “civilization destruction”). At the other end of the spectrum, others see AI as a transformational tool to help worker productivity. As generative AI continues to advance, its impact on employee efficiency will only grow, optimizing processes, driving innovation, and reshaping industries for a more productive future. Embracing this transformative technology will be critical for businesses seeking to thrive in the new digital age.
2023 Stock Performance Explained – Index Up but Most Stocks Down
Although 2022 was a rough year for the stock market (i.e., S&P 500 down -19%), stock prices have rebounded by +20% from the October 2022 lows, and +9% this year. This surge can be in large part attributed to the lopsided performance of the top 1% of stocks in the S&P 500 index (Apple Inc., Microsoft Corp., Amazon.com Inc., NVIDIA Corp., and Alphabet-Google), which combined account for almost 25% of the index’s total value. These top 5 consumer and enterprise technology companies have appreciated on average by an astounding +60% in the first five months of the year and represent a whopping $9 trillion in value. It gets a little technical, but it’s worth noting these larger companies have a disproportionate impact on the calculation of the return percentages, and vice versa for the smaller companies. To put these numbers in context, Apple’s $2.8 trillion company value is greater than the Gross Domestic Product (GDP) of many entire countries, including Italy, Canada, Australia, South Korea, Brazil, and Russia.
On the other hand, if we contrast the other 99% of the S&P 500 index (495 companies), these stocks are down -1% each on average for 2023 (vs +60% for the top 5 mega-stocks). If you look at the performance summary below, you can see that basically every other segment of the stock market outside of technology (e.g., small-cap, value, mid-cap, industrial) is down for the year.
2023 Year-To-Date Performance (%)
S&P 500: +8.9%
S&P 500 (Equal-Weight): -1.2%
S&P Small-Cap Index: -2.3%
Russell 1000 Value Index: -2.0%
S&P Mid-Cap Index: -0.7%
Dow Jones Industrial: -0.7%
While most stocks have dramatically underperformed technology stocks this year, this phenomenon can be explained in a few ways. First of all, smaller companies are more cyclically sensitive to an economic slowdown, and do not have the ability to cut costs to the same extent as the behemoth companies. The majority of stocks have factored in a slowdown (or mild recession) and this is why valuations for small-cap and mid-cap stocks are near multi-decade lows (12.8x and 13.0x, respectively) – see chart below.

Source: Yardeni.com
The stock market pessimists have been calling for a recession for going on two years now. Not only has the recession date continually gotten delayed, but the severity has also been reduced as corporate profits remain remarkably resilient in the face of numerous economic headwinds. Regardless, investors can stand on firmer ground now knowing we are upon the cusp of an AI revolution and near the finish line of a debt ceiling resolution.
Wade W. Slome, CFA, CFP®
Plan. Invest. Prosper.
This article is an excerpt from a previously released Sidoxia Capital Management complimentary newsletter (June 1, 2023). Subscribe Here to view all monthly articles.
DISCLOSURE: Sidoxia Capital Management (SCM) and some of its clients hold positions in NVDA, AAPL, MSFT, GOOGL, AMZN and certain exchange traded funds (ETFs), but at the time of publishing had no direct position in any other security referenced in this article. No information accessed through the Investing Caffeine (IC) website constitutes investment, financial, legal, tax or other advice nor is to be relied on in making an investment or other decision. Please read disclosure language on IC Contact page.
Cash Is Trash

The S&P 500 stock market index took a breather and ended its six-month winning streak, declining -4.8% for the month. Even after this brief pause, the S&P has registered a very respectable +14.7% gain for 2021, excluding dividends. Nevertheless, even though the major stock market indexes are roaming near all-time record highs, FUD remains rampant (Fear, Uncertainty, Doubt).
As the 10-Year Treasury Note yield has moved up to a still-paltry 1.5% level this month, the talking heads and peanut gallery bloggers are still fretting over the feared Federal Reserve looming “tapering”. More specifically, Jerome Powell, the Fed Chairman and the remainder of those on the FOMC (Federal Open Market Committee) are quickly approaching the decision to reduce monthly bond purchases (i.e., “tapering”). The so-called, quantitative easing (QE) program is currently running at about $120 billion per month, which was established with the aim to lower interest rates and stimulate the economy. Now that the COVID recovery is well on its way, the Fed is effectively trying to decrease the size of the current, unruly punch-keg down to the volume of a more manageable punch bowl.
Stated differently, even when the arguably overly-stimulative current bond buying slows or stops, the Federal Funds Rate is still effectively set at 0% today, a level that still offers plenty of accommodative fuel to our economy. Although interest rates will not stay at 0% forever, many people forget that between 2008 and 2015, the Fed Funds Rate stubbornly stayed sticky at 0% (i.e., a full punch bowl) for seven years, even without any spike in inflation.
Because the economy continues to improve, current consensus projections by economists show the first interest rate increase of this cycle (i.e., “liftoff”) to occur sometime in 2022 and subsequently climb to a still extraordinarily low level of 2.0% by 2024 (see “Dot Plot” below). For reference, the projected 2.0% figure would still be significantly below the 6.5% Fed Funds Rate we saw in the year 2000, the 5.3% in 2007, or the 2.4% in 2019. If history is any guide, under almost any scenario, Chairman Powell is very much a dove and is likely to tap the interest rate hike brakes very gently.

Low But Not the Lowest
In a world of generationally low interest rates, what I describe as our low bond yields here in the United States are actually relatively high, if you consider rates in other major industrialized economies and the trillions of negative-interest-rate bonds littered all over the rest of the world (see August’s article, $16.5 Trillion in Negative-Yielding Debt). Although our benchmark government rates are hovering around 1.5%, as you can see from the chart below, Germany is sitting considerably lower at -0.2%, Japan at 0.1%, France at 0.2%, and the United Kingdom at 1.0%.

Taper Schmaper
As with many government related policies, the Federal Reserve often gets too much credit for successes and too much blame for failures, as it relates to our economy. I have illustrated the extent of how globally interconnected our world of interest rates is, and one taper announcement is unlikely to reverse a four-decade disinflationary declining trend in interest rates.
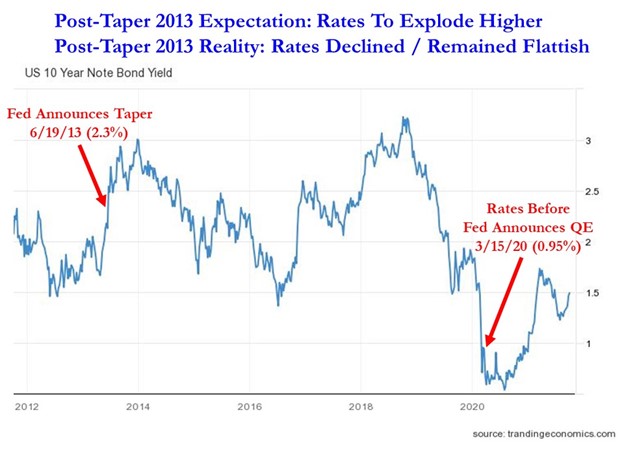
Back in 2013, after of five years of quantitative easing (QE) that began in 2008, investors were terrified that interest rates were artificially being depressed by a money-printing Fed that had gone hog-wild in bond buying. At that time, pundits feared an imminent explosion higher in interest rates once the Fed began tapering. So, what happened after Federal Reserve Chairman Ben Bernanke broached the subject of tapering on June 19, 2013? The opposite occurred. Although 10-Year yields jumped 0.1% to 2.3% on the day of the announcement, interest rates spent the majority of the next six years declining to 1.6% in 2019, pre-COVID. As COVID began to spread globally, rates declined further to 0.95% in March of 2020, the day before Jerome Powell announced a fresh new round of quantitative easing (see chart below).
Obviously, every economic period is different from previous ones, and fearing to fall off the floor to lower interest rate levels is likely misplaced at such minimal current rates (1.5%). However, panicking over potential exploding interest rates, as in 2013 (which did not happen), again may not be the most rational behavior either.
What to Do?
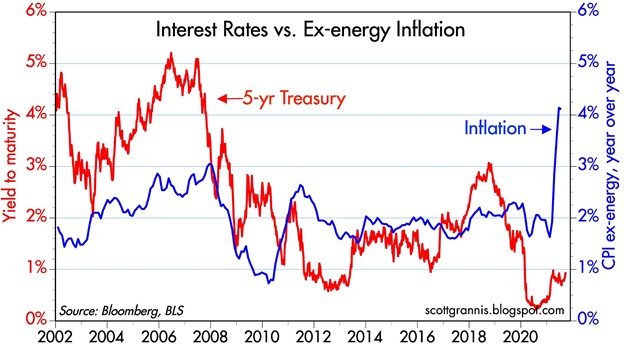
If interest rates are low, and inflation is high (see chart below), then what should you do with your money? Currently, if your money is sitting in cash, it is losing 4-5% in purchasing power due to inflation. If your money is sitting in the bank earning minimal interest, you are not going to be doing much better than that. Everybody’s time horizon and risk tolerance is different, but regardless of your age or anxiety level, you need to efficiently invest your money in a diversified portfolio to counter the insidious, degrading effects of inflation and generationally low interest rates. The “do-nothing” strategy will only turn your cash into trash, while eroding the value of your savings and retirement assets.

Wade W. Slome, CFA, CFP®
Plan. Invest. Prosper.
This article is an excerpt from a previously released Sidoxia Capital Management complimentary newsletter (October 1, 2021). Subscribe on the right side of the page for the complete text.
DISCLOSURE: Sidoxia Capital Management (SCM) and some of its clients hold positions in certain exchange traded funds (ETFs), but at the time of publishing had no direct position in any other security referenced in this article. No information accessed through the Investing Caffeine (IC) website constitutes investment, financial, legal, tax or other advice nor is to be relied on in making an investment or other decision. Please read disclosure language on IC Contact page.
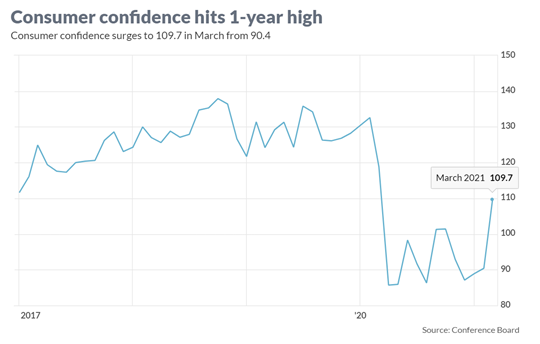
Consumer Confidence Flies as Stock Market Hits New Highs

As the economy starts reopening from a global pandemic that is improving, consumers and businesses are beginning to see a light at the end of the tunnel. The surge in the recently reported Consumer Confidence figures to a new one-year high (see chart below) is evidence the recovery is well on its way. A stock market reaching new record highs is further evidence of the reopening recovery. More specifically, the Dow Jones Industrial Average catapulted 2,094 points higher (+6.2%) for the month to 32,981 and the S&P 500 index soared +4.2%. A rise in interest rate yields on the 10-Year Treasury Note to 1.7% from 1.4% last month placed pressure on technology growth stocks, which led to a more modest gain of +0.4% in the tech-heavy NASDAQ index during March.
Comeback from COVID
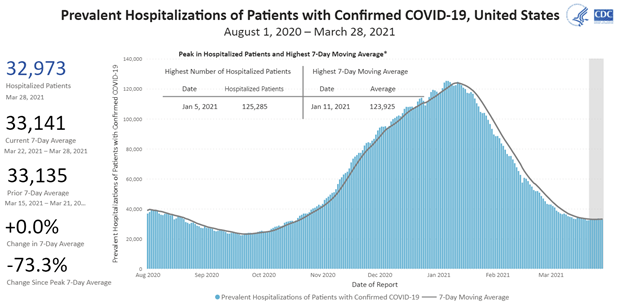
With a combination of 150 million vaccine doses administered and 30 million cumulative COVID cases, the U.S. population has creeped closer toward herd immunity protection against the virus and pushed down hospitalizations dramatically (see chart below).
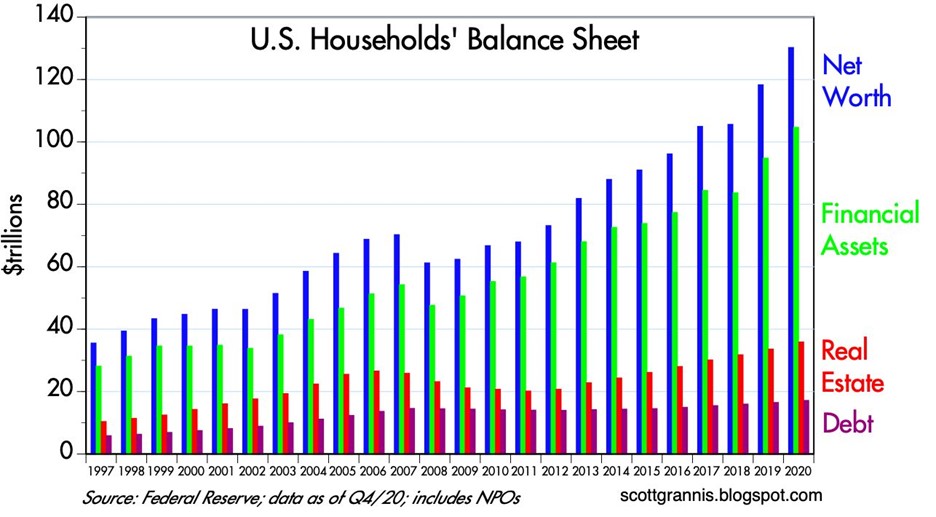
Also contributing to investor optimism have been the rising values of investments and real estate assets thanks to an improving economy and COVID case count. As you can see from the chart below, the net worth of American households has more than doubled from the 2008-2009 financial crisis to approximately $130 trillion dollars, which in turn has allowed consumers to responsibly control and manage their personal debt. Unfortunately, the U.S. government hasn’t been as successful in keeping debt levels in check.
Spending and Paying for Infrastructure Growth
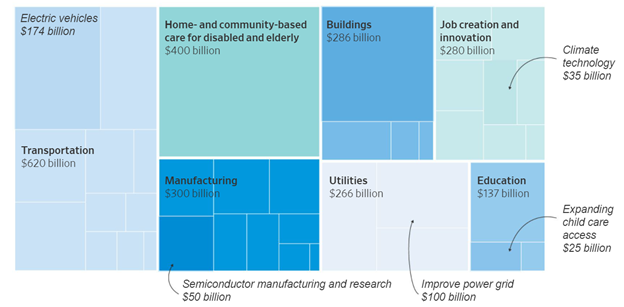
Besides focusing on positive COVID trends, investors have also centered their attention on the passage of a $1.9 trillion stimulus bill last month and a new proposed $2.3 trillion infrastructure bill that President Biden unveiled details on yesterday. At the heart of the multi-trillion dollar spending are the following components (see also graphic below):
- $621 billion modernize transportation infrastructure
- $400 billion to assist the aging and disabled
- $300 billion to boost the manufacturing industry
- $213 billion to build and retrofit affordable housing
- $100 billion to expand broadband access
With over $28 trillion in government debt, how will all this spending be funded? According to The Fiscal Times, there are four main tax categories to help in the funding:
Corporate Taxes: Raising the corporate tax rate to 28% from 21% is expected to raise $730 billion over 10 years
Foreign Corporate Subsidiary Tax: A new global minimum tax on foreign subsidiaries of American corporations is estimated to raise $550 billion
Capital Gains Tax on Wealthy: Increasing income tax rates on capital gains for wealthy individuals is forecasted to raise $370 billion
Income Tax on Wealthy: Lifting the top individual tax rate back to 39.6% for households earning more than $400,000 per year is seen to bring in $110 billion
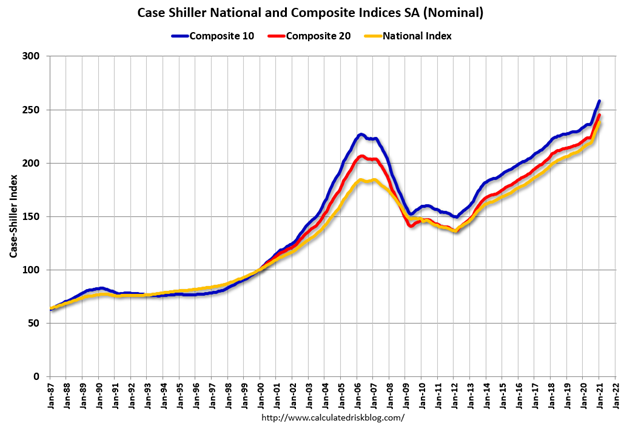
Besides the economy being supported by government spending, growth and appreciation in the housing market are contributing to GDP growth. The recently released housing data shows housing prices accelerating significantly above the peak levels last seen before the last financial crisis (see chart below).
Although the economy appears to be on solid footing and stock prices have marched higher to new record levels, there are still plenty of potential factors that could derail the current bull market advance. For starters, increased debt and deficit spending could lead to rising inflation and higher interest rates, which could potentially choke off economic growth. Bad things can always happen when large financial institutions take on too much leverage (i.e., debt) and speculate too much (see also Long-Term Capital Management: When Genius Failed). The lesson from the latest, crazy blow-up (Archegos Capital Management) reminds us of how individual financial companies can cause billions in losses and cause ripple-through effects to the whole financial system. And if that’s not enough to worry about, you have rampant speculation in SPACs (Special Purpose Acquisition Companies), Reddit meme stocks (e.g., GameStop Corp. – GME), cryptocurrencies, and NFTs (Non-Fungible Tokens).
Successful investing requires a mixture of art and science – not everything is clear and you can always find reasons to be concerned. At Sidoxia Capital Management, we continue to find attractive opportunities as we strive to navigate through areas of excess speculation. At the end of the day, we remain disciplined in following our fundamental strategy and process that integrates the four key legs of our financial stool: corporate profits, interest rates, valuations, and sentiment (see also Don’t Be a Fool, Follow the Stool). As long as the balance of these factors still signal strength, we will remain confident in our outlook just like consumers and investors are currently.

Wade W. Slome, CFA, CFP®
Plan. Invest. Prosper.
This article is an excerpt from a previously released Sidoxia Capital Management complimentary newsletter (April 1, 2021). Subscribe on the right side of the page for the complete text.
DISCLOSURE: Sidoxia Capital Management (SCM) and some of its clients hold positions in certain exchange traded funds (ETFs), but at the time of publishing had no direct position in GME or any other security referenced in this article. No information accessed through the Investing Caffeine (IC) website constitutes investment, financial, legal, tax or other advice nor is to be relied on in making an investment or other decision. Please read disclosure language on IC Contact page.
Hot Dogs, Political Fireworks, and Our Nation’s Birthday

This article is an excerpt from a previously released Sidoxia Capital Management complimentary newsletter (July 3, 2017). Subscribe on the right side of the page for the complete text.
The 4th of July has arrived once again as we celebrate our country’s 241st birthday of independence. Besides being a time to binge on hot dogs, apple pie, fireworks, and baseball, this national holiday allows Americans to also reflect on the greatness created by our nation’s separation from the British Empire.
As our Founding Fathers fought for freedom and believed in a more prosperous future, I’m not sure if the signers of our Declaration of Independence (Below [left to right]: Roger Sherman, Benjamin Franklin, Thomas Jefferson, John Adams, and Robert Livingston) envisioned a world with tweeting Presidents, driverless Uber taxis, internet dating, biotechnology medical breakthroughs, cloud storage, and countless other innovations that have raised the standard of living for billions of people around the world.

(These Founding Fathers may use different pictures for their Facebook profile, if they were alive today.)
I tend to agree with the wealthiest billionaire investor on the planet, Warren Buffett, that being born in the United States is the equivalent of winning the “Ovarian Lottery.” The opportunities for finding success are exponentially higher, if you were born in America vs. Bangladesh, for example. Surprisingly, the U.S. only accounts for about 4% of the global population (325 million out of 7.5 billion world total). However, even though we Americans make up such a small portion of the of the people on the planet, we still manage to generate over $18 trillion in goods and services, which makes us the world’s largest economy. As the #1 economy, we account for almost 25% of the world’s total economic output (see table & graphic below).
| Rank | Country | GDP (Nominal, 2015) | Share of Global Economy (%) |
| #1 | United States | $18.0 trillion | 24.3% |
| #2 | China | $11.0 trillion | 14.8% |
| #3 | Japan | $4.4 trillion | 5.9% |
| #4 | Germany | $3.4 trillion | 4.5% |
| #5 | United Kingdom | $2.9 trillion | 3.9% |
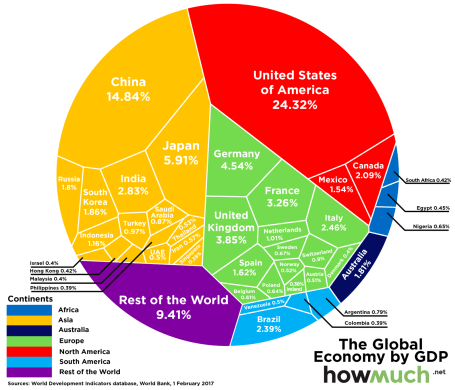
Source: Visual Capitalist
How do we create six times the output of our population (i.e., 4% of world’s population producing 25% of the world’s output)? Despite the nasty, imperfect, mudslinging politics we live through daily, the U.S. has perfected the art of capitalism, which has landed us on top of the economic Mt. Everest. Although, there is always room for improvement, culturally, the winning “entrepreneurial” strain is born into our American DNA. The recent merger announcement between Amazon.com Inc. (AMZN) and Whole Foods (WFM), the leading natural and organic foods supermarket, is evidence of this entrepreneurial strain. Amazon has come a long way and gained significant steam since its founding in July 1994 by CEO Jeff Bezos. Consequently, the momentum of this internet giant has it steamrolling the entire retail industry, which has led to a flood of store closings, including department store chains, Macy’s, J.C. Penney, Sears and Kmart. The Amazon-Whole Foods merger announcement was not a huge surprise to my family because we actually order more than half of our groceries from AmazonFresh (Amazon’s food delivery program). What’s more, since I despise shopping, I continually find myself taking advantage of Amazon’s “Prime Now” 2-hour delivery option to my office, which is free to all Prime subscribers. It won’t be long before Amazon’s multi-channel strategy will allow me to make same-day orders for groceries, electronics, and general merchandise from my office, then pick up those items on my way home from work at the local Whole Foods store.
Leading the Pack
Replicating this competitive advantage around the world is a challenge for competing countries, and our nation remains leap years ahead of others, regardless of their efforts. However, the United States does not have a monopoly on capitalism. We are slowly exporting our entrepreneurial secret sauce abroad with the help of technology and globalization. Just consider these three Chinese companies alone are valued at almost $1 trillion (Alibaba Group $360B [BABA]; Tencent Holdings $340B [TCEHY]; and China Mobile $220B [CHL]), and the largest expected IPO (Initial Public Offering) in the world could be a Saudi Arabian company valued at $2 trillion (Saudi Aramco). When 96% of the world’s population lies outside of the U.S., this reality helps explain why exporting our advancements should not be considered a bad thing. In fact, a growing international pie means more American jobs and more dollars will flow back to the U.S., as we export more value-added products and services abroad.
Even if other countries are narrowing the entrepreneurial competitive gap with the United States, we still remain a beacon of light for others to follow. Despite what you may read in the newspaper or hear on the TV, Americans are dramatically better off financially over the last 20 years. Not only has net worth increased spectacularly, but consumers have also responsibly reduced debt leverage ratios (see chart below).
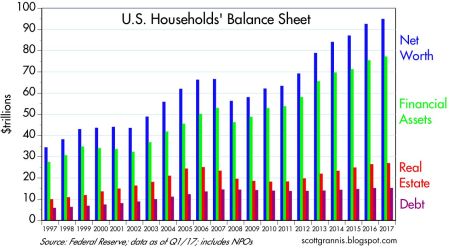
Source: Calafia Beach Pundit
If you were a bright CEO working for an innovative new start-up company, would you choose to launch your company in a closed, censored society like China? How about a fractured Britain that is pushing to break away from the European Union? Better yet, how about Japan with its exploding debt levels, a declining population, and a stock market that is about half the level it peaked at 28 years ago? Do emerging markets like Brazil with widespread corruption scandals blanketing a new president (after a recently impeached president) seem like the best location for a hot new venture? The answer to all these questions is a resounding “no”, even when compared to the warts and flaws that come with our durable democracy.
Political Pyrotechnics
Besides the bombs bursting in air during the 4th of July celebration, there were plenty of political fireworks blasting in our nation’s capital last month. No matter what side of the political fence you stand on, last month was explosive. Consider ousted FBI Director Jim Comey’s impassioned testimony relating to his firing by President Donald Trump; the contentious Attorney General Jeff Sessions Senate Intelligence Committee interview; the politically driven Republican baseball shooting; and the Special Counsel leader Robert Mueller’s investigation into Russian interference and potential Trump administration collusion into the 2016 elections.
Despite the combative atmosphere in Washington D.C., the stock market managed to notch another record high last month, with the Dow Jones Industrial Average index advancing another 340.98 points (+1.6%) for the month, and +8.0% for the first half of 2017. As I have written numerous times, the scary headlines accumulating since 2009 have prevented investors, strategists, economists, and even professionals from adequately participating in the almost quadrupling in stock prices since early 2009. Unfortunately, to the detriment of many, large swaths of investors who were burned by the 2008-2009 Financial Crisis have been scarred to almost permanent risk aversion. The fact of the matter is stock prices care more about economic factors than political / news headlines (see Moving on Beyond Politics).
The bitter, vitriolic political discourse is unlikely to disappear anytime soon, so do yourself a favor, and focus on the more important factors driving financial markets to new record highs – mainly corporate profits, interest rates, valuations, and sentiment (see Don’t Be a Fool). During this year’s 4th of July, partaking in hot dogs, apple pie, fireworks, and baseball are wholly encouraged, but please also take the time to celebrate and acknowledge the magnitude of our country’s greatness. That’s a birthday wish, I think we can all agree upon.

Wade W. Slome, CFA, CFP®
Plan. Invest. Prosper.
DISCLOSURE: Sidoxia Capital Management (SCM) and some of its clients hold positions in AMZN and certain exchange traded funds (ETFs), but at the time of publishing had no direct position in WFM, BABA, TCEHY, CHL, or any other security referenced in this article. No information accessed through the Investing Caffeine (IC) website constitutes investment, financial, legal, tax or other advice nor is to be relied on in making an investment or other decision. Please read disclosure language on IC Contact page.
EBITDA: Sniffing Out the Truth

Financial analysts are constantly seeking the Holy Grail when it comes to financial metrics, and to some financial number crunchers, EBITDA (Earnings Before Interest Taxes Depreciation and Amortization – pronounced “eebit-dah”) fits the bill. On the flip side, Warren Buffett’s right hand man Charlie Munger advises investors to replace EBITDA with the words “bullsh*t earnings” every time you encounter this earnings metric. We’ll explore the good, bad, and ugly attributes of this somewhat controversial financial metric.
The Genesis of EBITDA
The origin of the EBITDA measure can be traced back many years, and rose in popularity during the technology boom of the 1990s. “New Economy” companies were producing very little income, so investment bankers became creative in how they defined profits. Under the guise of comparability, a company with debt (Company X) that was paying high interest expenses could not be compared on an operational profit basis with a closely related company that operated with NO debt (Company Z). In other words, two identical companies could be selling the same number of widgets at the same prices and have the same cost structure and operating income, but the company with debt on their balance sheet would have a different (lower) net income. The investment banker and company X’s answer to this apparent conundrum was to simply compare the operating earnings or EBIT (Earnings Before Interest and Taxes) of each company (X and Z), rather than the disparate net incomes.
The Advantages of EBITDA
Although there is no silver bullet metric in financial statement analysis, nevertheless there are numerous benefits to using EBITDA. Here are a few:
- Operational Comparability: As implied above, EBITDA allows comparability across a wide swath of companies. Accounting standards provide leniency in the application of financial statements, therefore using EBITDA allows apples-to-apples comparisons and relieves accounting discrepancies on items such as depreciation, tax rates, and financing choice.
- Cash Flow Proxy:Since the income statement traditionally is the financial statement of choice, EBITDA can be easily derived from this statement and provides a simple proxy for cash generation in the absence of other data.
- Debt Coverage Ratios:In many lender contracts, certain debt provisions require specific levels of income cushion above the required interest expense payments. Evaluating EBITDA coverage ratios across companies assists analysts in determining which businesses are more likely to default on their debt obligations.
The Disadvantages of EBITDA
While EBITDA offers some benefits in comparing a broader set of companies across industries, the metric also carries some drawbacks.
- Overstates Income: To Charlie Munger’s point about the B.S. factor, EBITDA distorts reality by measuring income before a bunch of expenses. From an equity holder’s standpoint, in most instances, investors are most concerned about the level of income and cash flow available AFTERaccounting for all expenses, including interest expense, depreciation expense, and income tax expense.
- Neglects Working Capital Requirements: EBITDA may actually be a decent proxy for cash flows for many companies, however this profit measure does not account for the working capital needs of a business. For example, companies reporting high EBITDA figures may actually have dramatically lower cash flows once working capital requirements (i.e., inventories, receivables, payables) are tabulated.
- Poor for Valuation: Investment bankers push for more generous EBITDA valuation multiples because it serves the bankers’ and clients’ best interests. However, the fact of the matter is that companies with debt or aggressive depreciation schedules do deserve lower valuations compared to debt-free counterparts (assuming all else equal).
Wading through the treacherous waters of accounting metrics can be a dangerous game. Despite some of EBITDA’s comparability benefits, and as much as bankers and analysts would like to use this very forgiving income metric, beware of EBITDA’s shortcomings. Although most analysts are looking for the one-size-fits-all number, the reality of the situation is a variety of methods need to be used to gain a more accurate financial picture of a company. If EBITDA is the only calculation driving your analysis, I urge you to follow Charlie Munger’s advice and plug your nose.

Wade W. Slome, CFA, CFP®
Plan. Invest. Prosper.
DISCLOSURE: Sidoxia Capital Management (SCM) and some of its clients hold positions in certain exchange traded funds (ETFs), but at the time of publishing had no direct position in any other security referenced in this article. No information accessed through the Investing Caffeine (IC) website constitutes investment, financial, legal, tax or other advice nor is to be relied on in making an investment or other decision. Please read disclosure language on IC Contact page.
Oxymoron: Shrewd Government Refis Credit Card

With the upcoming Federal Reserve policy meetings coming up this Wednesday and Thursday, investors’ eyes remain keenly focused on the actions and words of Federal Reserve Chairwoman Janet Yellen.
If you have painstakingly filled out an IRS tax return or frustratingly waited in long lines at the DMV or post office, you may not be a huge fan of government services. Investors and liquidity addicted borrowers are also irritated with the idea of the Federal Reserve pulling away the interest rate punch bowl too soon. We will find out early enough whether Yellen will hike the Fed Funds interest rate target to 0.25%, or alternatively, delay a rate increase when there are clearer signs of inflation risks.
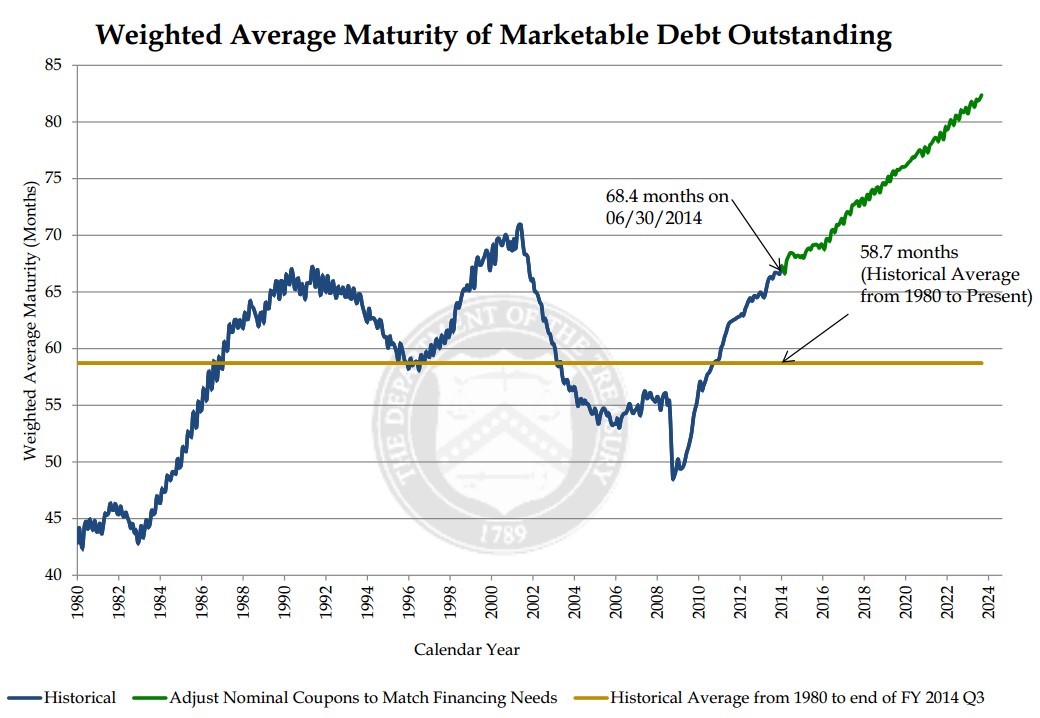
Regardless of the Fed decision this week, with interest rates still hovering near generational lows, it is refreshing to see some facets of government making shrewd financial market decisions – for example in the area of debt maturity management. Rather than squeezing out diminishing benefits by borrowing at the shorter end of the yield curve, the U.S. Treasury has been taking advantage of these shockingly low rates by locking in longer debt maturities. As you can see from the chart below, the Treasury has increased the average maturity of its debt by more than 20% from 2010 to 2015. And they’re not done yet. The Treasury’s current plan based on the existing bond issuance trajectory will extend the average bond maturity from 70 months in 2015 to 80 months by the year 2022.
If you were racking up large sums of credit card debt at an 18% interest rate with payments due one month from now, wouldn’t you be relieved if you were given the offer to pay back that same debt a year from now at a more palatable 2% rate? Effectively, that is exactly what the government is opportunistically taking advantage of by extending the maturity of its borrowings.
Most bears fail to acknowledge this positive trend. The typical economic bear argument goes as follows, “Once the Fed pushes interest rates higher, interest payments on government debt will balloon, and government deficits will explode.” That argument definitely holds up some validity as newly issued debt will require higher coupon payments to investors. But at a minimum, the Treasury is mitigating the blow of the sizable government debt currently outstanding by extending the average Treasury maturity (i.e., locking in low interest rates).
It is worth noting that while extending the average maturity of debt by the Treasury is great news for U.S. tax payers (i.e., smaller budget deficits because of lower interest payments), maturity extension is not so great news for bond investors worried about potentially rising interest rates. Effectively, by the Treasury extending bond maturities on the debt owed, the government is creating a larger proportion of “high octane” bonds. By referring to “high octane” bonds, I am highlighting the “duration” dynamic of bonds. All else equal, a lengthening of bond maturities, will increase a bond’s duration. Stated differently, long duration, “high octane” bonds will collapse in price if in interest rates spike higher. The government will be somewhat insulated to that scenario, but not the bond investors buying these longer maturity bonds issued by the Treasury.
All in all, you may not have the greatest opinion about the effectiveness of the IRS, DMV, and/or post office, but regardless of your government views, you should be heartened by the U.S. Treasury’s shrewd and prudent extension of the average debt maturity. Now, all you need to do is extend the maturity and lower the interest rate on your personal credit card debt.

Wade W. Slome, CFA, CFP®
Plan. Invest. Prosper.
DISCLOSURE: Sidoxia Capital Management (SCM) and some of its clients hold positions in certain exchange traded funds (ETFs) , but at the time of publishing, SCM had no direct position in any other security referenced in this article. No information accessed through the Investing Caffeine (IC) website constitutes investment, financial, legal, tax or other advice nor is to be relied on in making an investment or other decision. Please read disclosure language on IC Contact page.
Missing the Forest for the Trees

Just days ago, billionaire investor and corporate activist Carl Icahn called the stock market “extremely overheated,” especially as it relates to high yield bonds. He communicated these comments over Twitter after saying markets are “sailing in dangerous unchartered waters.” Given recent Greek developments regarding its inability to strike a debt repayment deal with eurozone leaders, Mr. Icahn might get exactly the volatility he expected when he made those comments. There’s no question a Greek default could definitely cause a short-term contagion effect, but there will be much larger fish to fry than domestic equity markets (I will have much more to say on the Greek topic in my monthly newsletter).
While it’s difficult to argue with Carl Icahn’s long-term investment track record, currently there is little objective data (unemployment, yield curve, corporate profits, GDP, etc.) signaling an imminent recession or economic collapse. Whether you are an optimist or pessimist, there is no doubt we have come a long ways since the lows of 2009 – see Global Stock Market chart below:
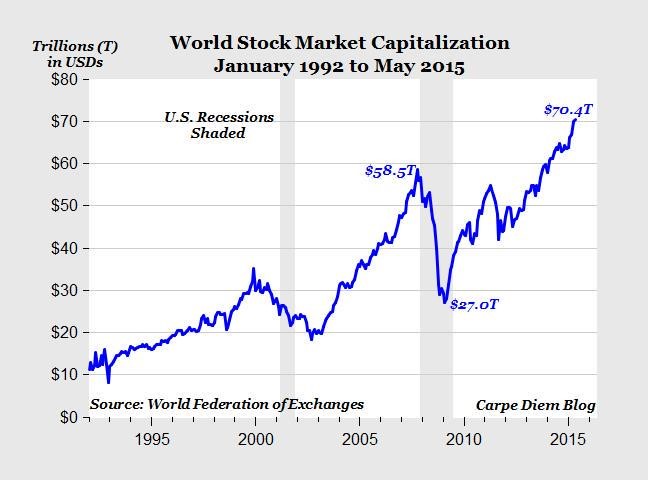
Source: Mark Perry (Carpe Diem)
The rapid price appreciation has been undeniable, but Mr. Icahn and other equity bears may be missing the forest for the trees. There has been a disproportional increase in the value of bond assets versus equity assets. More specifically, as can be seen from the chart below, the value of global financial assets increased an estimated +21.5% to $294 trillion from 2007 to 2014. Of the $52 trillion increase in global financial assets, 92% of the increase ($48 trillion) was derived from expanding debt obligations – not stocks. I’ve said it many times before, but if you are worried about the pricking of an equity bubble, make sure to buy some heavy-duty industrial ear plugs for eventual pricking of the bond bubble.
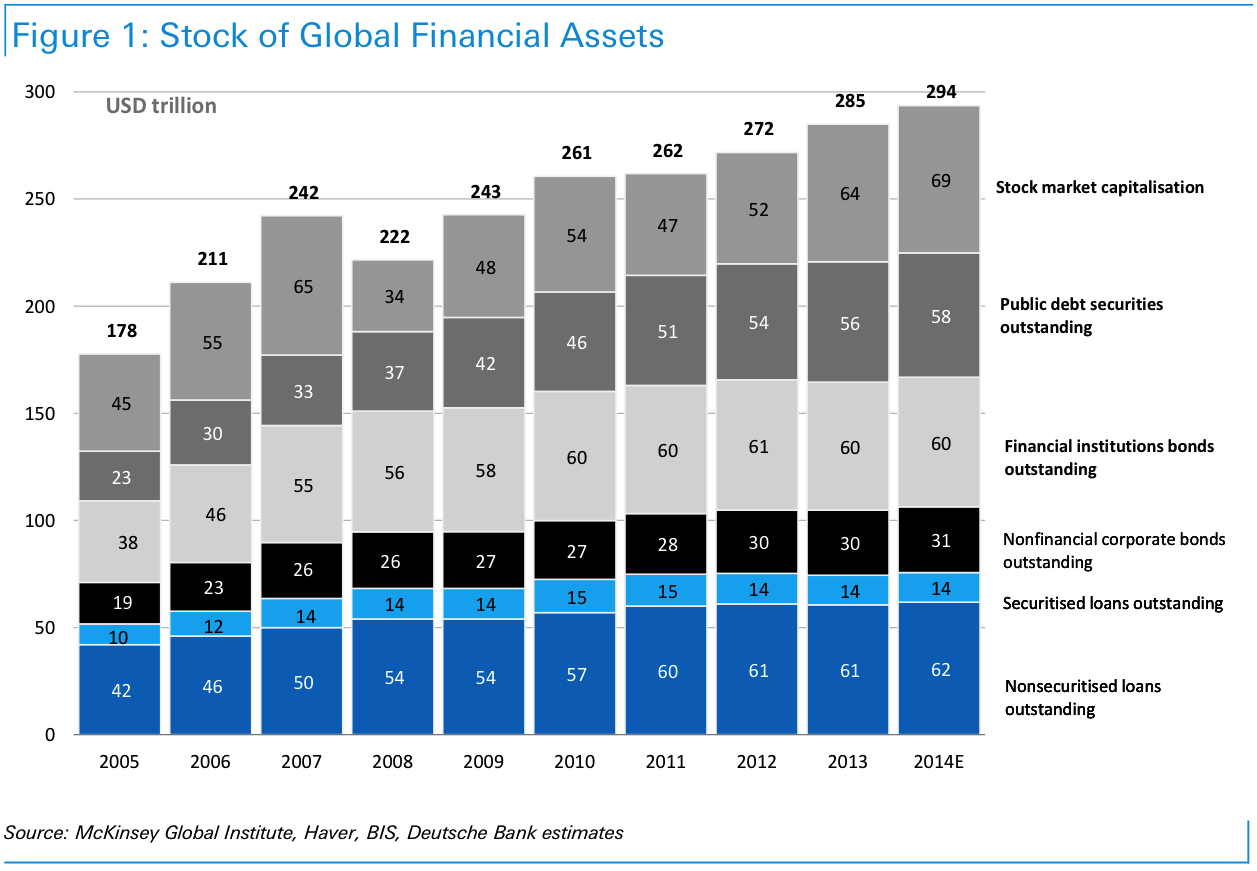
Source: Business Insider / McKinsey
Former Treasury Secretary and Harvard President Larry Summers recently commented in an interview that a potential “Grexit” could have unforeseen consequences just like the situations leading to the collapse of Lehman Brothers, Long Term Capital Management, and the subprime market. At the time, those particular circumstances were underestimated and characterized as being “contained”. Today, we are hearing the opposite regarding Greece.
In a post financial crisis world, every financial molehill is made into a crisis mountain as it spreads through social media and appears on every TV show, blog, newspaper, and magazine article. In a post financial crisis world characterized with ultra-low central bank interest rate policies, a combination of excessive conservatism from individual investors and opportunistic corporate actions (e.g., share buybacks and M&A), has led to a lopsided increase in debt issuance. Case in point is the bloated debt balances held by the Greek government. There will inevitably be pain associated with a Greek default and potential exit from the euro, but due to its size (<2% of European GDP), Greece should be treated more like a pimple than a body rash.
If you want to reach your financial goals, you need to prudently manage your risk through a broad asset allocation and realize that experiencing turbulence is part of the investing game. The impending Greece default will not be the first financial crisis, nor the last one. Extreme growth in debt should be more of a concern than a tiny, financially irresponsible country missing a debt payment. But rather than panicking, it is wiser to maintain a long-term investment strategy coupled with a globally diversified portfolio across asset classes, which will allow you to not miss the forest for the trees.
Wade W. Slome, CFA, CFP®
Plan. Invest. Prosper.
DISCLOSURE: Sidoxia Capital Management (SCM) and some of its clients hold positions in certain exchange traded funds (ETFs) , but at the time of publishing, SCM had no direct position in any other security referenced in this article. No information accessed through the Investing Caffeine (IC) website constitutes investment, financial, legal, tax or other advice nor is to be relied on in making an investment or other decision. Please read disclosure language on ICContact page.
Netflix: Burn It and They Will Come

In the successful, but fictional movie, Fields of Dreams, an Iowa farmer played by actor Kevin Costner is told by voices to build a field for baseball playing ghosts. After the baseball diamond is completed, the team of Chicago White Sox ghosts, including Shoeless Joe Jackson, come to play.
Well, in the case of the internet streaming giant Netflix Inc (NFLX), instead of chasing ghosts, the company continues to chase the ghosts of profitability. Netflix’s share price has already soared +63% this year as the company continues to burn hundreds of millions in cash, while aggressively building out its international streaming footprint. Unlike Kevin Costner, Netflix investors are likely to eventually get spooked by the by the stratospheric valuation and bleeding cash.
At Sidoxia, we may be a dying breed, but our primary focus is on finding market leading franchises that are growing cash flows at reasonable valuations. In sticking with my nostalgic movie quoting, I believe as Cuba Gooding Jr. does in the classic movie, Jerry Maguire, “Show me the money!” Unfortunately for Netflix, right now the only money to be shown is the money getting burned.
Burn It and They Will Come

In a little over three years, Netflix has burned over -$350 million in cash, added $2 billion in debt, and spent approximately -$11 billion on streaming content (about -$4.6 billion alone in the last 12 months). As the hemorrhaging of cash accelerates (-$163 million in the recent quarter), investors with valuation dementia have bid up Netflix shares to a head-scratching 350x’s estimated earnings this year and a still mind-boggling valuation of 158x’s 2016 Wall Street earnings estimates of $3.53 per share. Of course the questionable valuation built on accounting smoke and mirrors looks even more absurd, if you base it on free cash flow…because Netflix has none. What makes the Netflix story even scarier is that on top of the rising $2.4 billion in debt anchored on their balance sheet, Netflix also has commitments to purchase an additional $9.8 billion in streaming content in the coming years.
For the time being, investors are enamored with Netflix’s growing revenues and subscribers. I’ve seen this movie before (no pun intended), in the late 1990s when investors would buy growth with reckless neglect of valuation. For those of you who missed it, the ending wasn’t pretty. What’s causing the financial stress at Netflix? It’s fairly simple. Beyond the spending like drunken sailors on U.S. television and movie content (third party and original), the company is expanding aggressively internationally.
The open check book writing began in 2010 when Netflix started their international expansion in Canada. Since then, the company has launched their service in Latin America, the United Kingdom, Ireland, Finland, Denmark, Sweden Norway, Netherlands, Germany, Austria, Switzerland, France, Belgium, Luxembourg, Australia, and New Zealand.
With all this international expansion behind Netflix, investors should surely be able to breathe a sigh of relief by now…right? Wrong. David Wells, Netflix’s CFO had this to say in the company’s recent investor conference call. Not only have international losses worsened by 86% in the recent quarter, “You should expect those losses to trend upward and into 2016.” Excellent, so the horrific losses should only deteriorate for another year or so…yay.
While Netflix is burning hundreds of millions in cash, the well documented streaming competition is only getting worse. This begs the question, what is Netflix’s real competitive advantage? I certainly don’t believe it is the company’s ability to borrow billions of dollars and write billions in content checks – we are seeing plenty of competitors repeating the same activity. Here is a partial list of the ever-expanding streaming and cord-cutting competitive offerings:
- Amazon Prime Instant Video (AMZN)
- Apple TV (AAPL)
- Hulu
- Sony Vue
- HBO Now
- Sling TV (through Dish Network – DISH)
- CBS Streaming
- YouTube (GOOG)
- Nickelodeon Streaming
Sadly for Netflix, this more challenging competitive environment is creating a content bidding war, which is squeezing Netflix’s margins. But wait, say the Netflix bulls. I should focus my attention on the company’s expanding domestic streaming margins. This is true, if you carelessly ignore the accounting gimmicks that Netflix CFO David Wells freely acknowledges. On the recent investor call, here is Wells’s description of the company’s expense diversion trickery by geography:
“So by growing faster internationally, and putting that [content expense] allocation more towards international, it’s going to provide some relief to those global originals, and the global projects that we do have, that are allocated to the U.S.”
In other words, Wells admits shoving a lot of domestic content costs into the international segment to make domestic profit margins look better (higher). Longer term, perhaps this allocation could make some sense, but for now I’m not convinced viewers in Luxembourg are watching Orange is the New Black and House of Cards like they are in the U.S.
Technology: Amazon Doing the Heavy Lifting
If check writing and accounting diversions aren’t a competitive advantage, does Netflix have a technology advantage? That’s tough to believe when Netflix effectively outsources all their distribution technology to Amazon.com Inc (AMZN).
Here’s how Netflix describes their technology relationship with Amazon:
“We run the vast majority of our computing on [Amazon Web Services] AWS. Given this, along with the fact that we cannot easily switch our AWS operations to another cloud provider, any disruption of or interference with our use of AWS would impact our operations and our business would be adversely impacted. While the retail side of Amazon competes with us, we do not believe that Amazon will use the AWS operation in such a manner as to gain competitive advantage against our service.”
Call me naïve, but something tells me Amazon could be stealing some secret pointers and best practices from Netflix’s operations and applying them to their Amazon Prime Instant Video offering. Nah, probably not. Like Netflix said, Amazon wouldn’t steal anything to gain a competitive advantage…never.
Regardless, the real question surrounding Netflix should focus on whether a $35 billion valuation should be awarded to a money losing content portal that distributes content through Amazon? For comparison purposes, Netflix is currently valued at 20% more than Viacom Inc (VIA), the owner of valuable franchises and brands like Paramount Pictures, Nickelodeon, MTV, Comedy Central, BET, VH1, Spike, and more. Viacom, which was spun off from CBS 44 years ago, actually generated about $2.5 billion in cash last year and paid out about a half billion dollars in dividends. Quite a stark contrast compared to a company accelerating its cash losses.
I openly admit Netflix is a wonderful service, and I have been a loyal, longtime subscriber myself. But a good service does not necessarily equate to a good stock. And despite being short the stock, Sidoxia is actually long the company’s bonds. It’s certainly possible (and likely) Netflix’s stock will underperform from today’s nosebleed valuation, but under almost any scenario I can imagine, I have a difficult time foreseeing an outcome in which Netflix would go bankrupt by 2021. Bond investors currently agree, which explains why my Netflix bonds are trading at a 5% premium to par.
Netflix stockholders, and crazy disciples like Mark Cuban, on the other hand, may have more to worry about in the coming quarters. CEO Reed Hastings is sticking to his “burn it and they will come” strategy at all costs, but if profits and cash don’t begin to pile up quickly, then Netflix’s “Field of Dreams” will turn into a “Field of Nightmares.”
Wade W. Slome, CFA, CFP®
Plan. Invest. Prosper.
DISCLOSURE: Sidoxia Capital Management (SCM) and some of its clients hold positions in certain exchange traded funds (ETFs), AAPL, GOOGL, AMZN, long Netflix bond position, long Dish Corp bond, and a short position in NFLX, but at the time of publishing, SCM had no direct position in VIA, TWX, SNE, or any other security referenced in this article. No information accessed through the Investing Caffeine (IC) website constitutes investment, financial, legal, tax or other advice nor is to be relied on in making an investment or other decision. Please read disclosure language on IC Contact page.
Fiscal Armageddon Greatly Exaggerated

Source: Photobucket
“The reports of my death are greatly exaggerated.”
-Mark Twain (after a relative’s illness was attributed to Twain)
The same can be said for the exaggerated death of the U.S. economy and stock market. Naysayers have been pounding a consistent stream of fatal economic theories for years as a positive set of broader metrics disassembled those arguments. Debt downgrades, debt defaults, and a domino of European country collapses were supposed to set our financial markets spiraling downwards out of control. That didn’t happen.
A large contributing component to our oversized debt burden was the massive federal, state, and local deficits. Consider the federal fiscal deficit that reached -$1.5 trillion during the 2008-09 Financial Crisis.
Many of the doom-and-gloomer pundits expected a deficit in the uber-trillion dollar range to last for as far as the eye could see, but perception didn’t turn out to be reality. Scott Grannis at Calafia Beach Pundit always does a superb job of summarizing this government related data (see chart below):
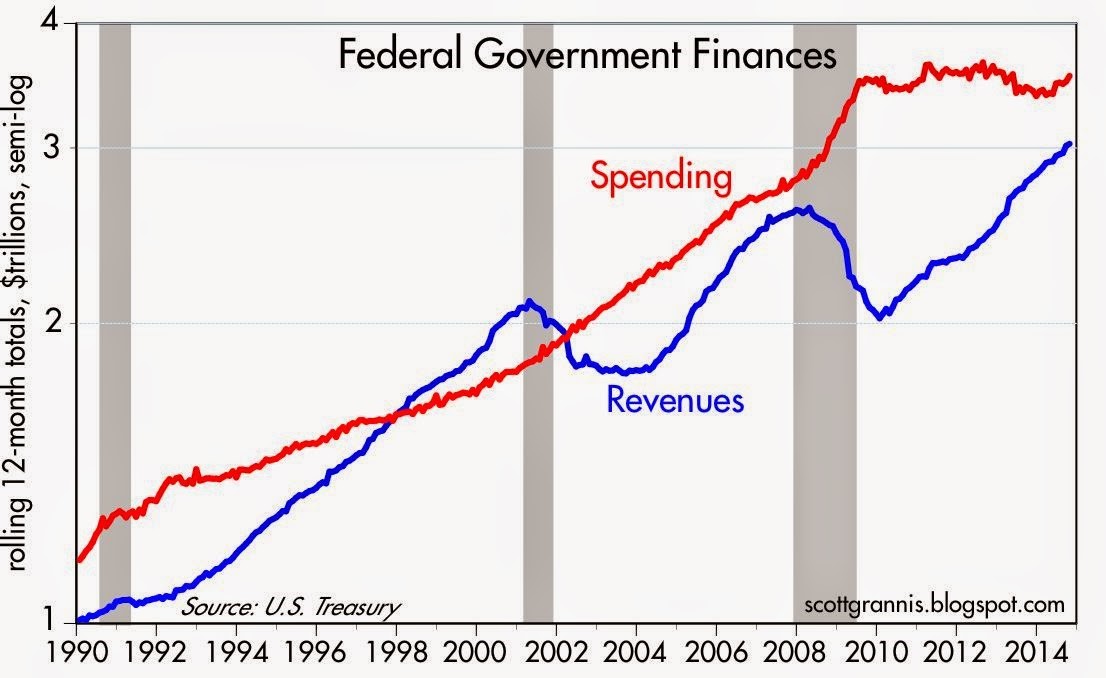
Source: Calafia Beach Pundit
All too often people confuse a secular trend vs. a cyclical move. The collapse in tax revenues during the 2008-2009 timeframe was not the result of some permanent shift in tax policy, but rather a function of a cyclical downturn, much like we have seen in prior recessions.
Extrapolating a short-term trend into a long-term trend is a common investor mistake (see Extrapolation Dangers). While the mean reversion in tax revenues came as a surprise to some, it was no bombshell for me. When the country axes 9 million private jobs and then both companies and consumers rein in spending due to depression fears, a subsequent reduction in tax receipts should not be a shock to market observers. On the flip side, it should then be no revelation that tax revenues will rise when 9 million+ jobs return and confidence rebounds.
We have talked about the shape of tax revenues/receipts, but what about the shape of spending? With all the gridlock occurring in Washington, Americans are fed up with the government’s inability to get anything done, which is evident by the near-record low approval rating of Congress. But as I have written before, not all the effects of gridlock are bad (see Who Said Gridlock is Bad?). What Grannis’s chart above shows is that gridlock has beneficially resulted in about five years of flat spending. Despite the spending stinginess, the slow and steady economic recovery has continued virtually unabated since 2009.
Looked at from a slightly different lens, you can see the deficit reached its worst point in 2009 at about -$1.5 trillion (-10% of GDP) – see chart below. Today, the deficit has almost been cut by 2/3rds to a level of -$0.5 billion (-2.8% of GDP). As you can see, the current deficit/GDP percentage is consistent with the average deficit levels experienced over the last 50 years.
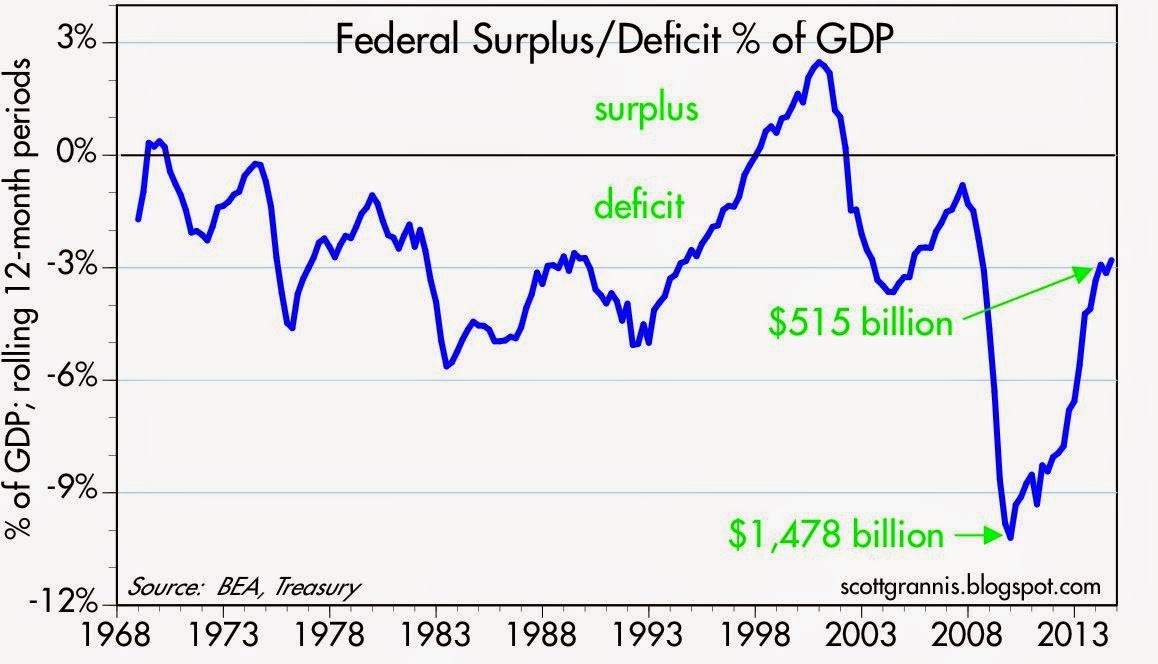
Source: Calafia Beach Pundit
Regardless of your political persuasion, investors are best served by not placing too much focus on what’s going on in Washington D.C. Equal blame and credit can be dispersed across Congress (Democrats & Republicans), the President, and the Federal Reserve. Exaggerating the death of the U.S. economy and stock market may sell more newspapers and advertising, but the resilience of capitalism and innovative spirit of American entrepreneurship has not and will not die.
Wade W. Slome, CFA, CFP®
Plan. Invest. Prosper.
DISCLOSURE: Sidoxia Capital Management (SCM) and some of its clients own a range of positions in certain exchange traded fund positions, but at the time of publishing SCM had no direct position in any other security referenced in this article. No information accessed through the Investing Caffeine (IC) website constitutes investment, financial, legal, tax or other advice nor is to be relied on in making an investment or other decision. Please read disclosure language on IC Contact page.


