Posts tagged ‘data’
Gobbling Up the All-You-Can-Eat Data Buffet

Gorging oneself at an all-you-can eat buffet has its advantages, but managing the associated extra pounds and bloatedness carries its own challenges. In a similar fashion, businesses and consumers are devouring data at an exponential rate, while simultaneously attempting to slice, dice, manage, and store all of this information. Data is quickly becoming as cheap as oxygen, and there are virtually no limitations on the amount consumed.
With the help of my handy smart phone, tablet, and digital camera, I can almost store and watch every moment of my life, very much like the movie The Truman Show. Social media and cloud services, coupled with inexpensive storage, have only made it simpler to digitally archive my life. Pretty soon, with the click of a mouse (or tap of the tablet) everyone will be able to instantaneously access every important moment of their life from cradle to grave.
Consuming Data Bytes at a Time
If you are in the mood for consuming free data, there are plenty of free multi-gigabyte services to choose from, including Dropbox, Mozy, and SkyDrive among other. For those chomping on more than 25 gigabytes of data, paid services like Amazon.com’s (AMZN) Simple Storage Service (a.k.a, “S3”) allow users to store a terabyte of data for about $0.01 – $0.05 per month. However, if renting storage is not your gig (no pun intended), you can own your personal storage device for next to nothing. In fact, you can buy a 1 terabyte (equal to 1,000 gigabytes) external hard drive today for less than $70. If that’s too rich for your blood, then just wait 12 months or so and pay $50 bucks. To put a terabyte in context, this amount of storage can hold approximately 625,000 high quality photos or 412 DVD quality movies, according to a Financial Times article talking about “big data.”
A terabyte may sound like a lot, but if we’re going to be honest, this amount of storage is Tiddly Winks. Once we start talking about petabytes (1,000 terabytes), exabytes (1,000,000 terabytes), and zettabytes (1 billion terabytes), things begin to get a little more interesting (see chart below). If you consider that 2012 global data center traffic estimates amount to 2.6 zettabytes (or 2.6 billion terabytes), it doesn’t take long to appreciate the enormity of the data management challenge facing billions of people.
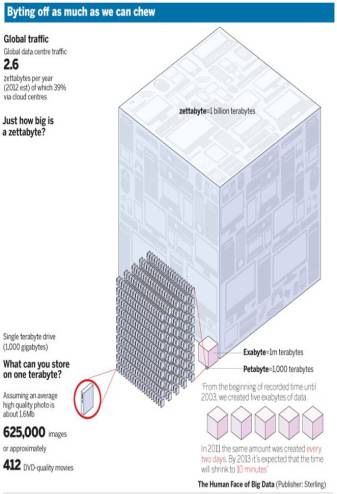
Source: The Financial Times
The Financial Times also points out the following:
“From the beginning of recorded time until 2003, we created five exabytes of data. In 2011 the same amount was created every two days. By 2013 it’s expected that the time will shrink to 10 minutes.”
Digital World Driving Data Appetite
What’s driving the global gusher of data growth? There’s not just one answer, but one can start understanding the scope of the issue after contemplating the trillions of annual text messages; 1 billion Facebook (FB) users; 800 million monthly YouTube visitors watching 4 billion hours of videos; six billion cell phones worldwide; and a global 122 million tablet market (IDC).
I certainly wasn’t the first person to discover this megatrend, but I am not hesitating to invest both my client’s money and my money into benefiting from this massive growth trend. Businesses are prospering from the data tidal wave too, as evidenced in part by Oracle Corp’s (ORCL) stellar quarterly earnings results reported just a few days ago. The mass migration of services to the “cloud” (software delivered over the internet) combined with the need to manage and store exploding industry data, resulted in Oracle reporting growth of +18% in its profitable Software License Sales and Cloud Subscriptions segment. With results like these, no wonder Oracle’s founder and CEO Larry Ellison owns a 141-mile square island, a multi-hundred million yacht, and is worth $41 billion according to Forbes (#3 on the Forbes 400 list).
Whether you realize it or not, we are all consuming heaps of all-you-can eat data at the digital buffet. Rather than rolling over into a data consumption coma, you will be much better off figuring out how to profit from the exploding data trends.
See also: The Age of Information Overload
Wade W. Slome, CFA, CFP®
Plan. Invest. Prosper.
DISCLOSURE: Sidoxia Capital Management (SCM) and some of its clients hold positions in certain exchange traded funds (ETFs), GOOG, and AMZN, but at the time of publishing SCM had no direct positions in FB, ORCL, or any other security referenced in this article. No information accessed through the Investing Caffeine (IC) website constitutes investment, financial, legal, tax or other advice nor is to be relied on in making an investment or other decision. Please read disclosure language on IC Contact page.
Getting Debt Binge Under Control

Given the endless daily reminders about our federal government’s insatiable appetite for debt, the inevitable collapse of the dollar, and the potential for civil unrest, the average citizen might be surprised to find out the overall debt situation has actually improved. While our federal debt has been exploding (see also Investing Caffeine D-E-B-T article), households and businesses have been tightening their belts and cutting down on the debt binge of recent years. In fact, the overall debt for the U.S. grew at the slowest rate in a decade according to The Business Insider.

Source: The Business Insider. Steady debt growth decline.
As you can see from the nitty-gritty in the Federal Reserve chart below, total Nonfinancial Debt grew at +2.8% in the 3rd quarter of 2009 (comprised of -2.6% Household Debt; -2.6% Business Debt; +5.1% State & Local Government Debt; and +20.6% Federal Debt).

What does this all mean? Not surprisingly, we are seeing the same trends in the debt figures that we are seeing in the components of our GDP (Gross Domestic Product). We learned from our Economics 101 class that the equation for GDP = C + I + G + (NX), which explains the components of economic growth.
- C = Consumer spending (or private consumption)
- I = Investment (or business spending)
- G = Government spending
- NX = Net exports (or exports – imports)
Consumer spending has been the biggest driver of growth before the financial crisis (fueled in part by the contribution of debt growth), accounting for more than 2/3 of our GDP. Now, with the consumer retrenching dramatically – spending less and saving more – we are seeing government spending (i.e., stimulus) pick up the slack.
These same dynamics are playing out in the total debt figures. Since the consumer is retrenching, they are saving more and paying down debt. Business owner debt has been chopped too, either by choice or because the banks simply are not lending. Here again, the government is picking up the slack by ramping up the debt growth.
Encouragingly, all is not lost. Economic principles, like the laws of physics, eventually take hold. Fortunately consumers and businesses have gone on a crash diet from debt – and the banks haven’t accommodated the pleading cash-starved either. Now legislators in our nation’s capital must do their part in dealing with the weighty spending. The overall debt progress is heartening, but Uncle Sam still needs to get off the Ho-Hos and Twinkies and start shedding some of that binge-related debt.
Read Full Business Insider Article
Wade W. Slome, CFA, CFP®
Plan. Invest. Prosper.
DISCLOSURE: Sidoxia Capital Management (SCM) and some of its clients own certain exchange traded funds and equity securities in client and personal portfolios at the time of publishing. No information accessed through the Investing Caffeine (IC) website constitutes investment, financial, legal, tax or other advice nor is to be relied on in making an investment or other decision. Please read disclosure language on IC “Contact” page.
Ooops…Siegel Data Questioned

Professor Jeremy Siegel is well-known in large part due to his famed book, “Stocks for the Long Run,” which Siegel uses as a foundation for his assertion that stocks have dramatically outperformed bonds since 1802. Siegel has four versions of his book, but the basic conclusion is that stocks have averaged about a 7% annual return (approximately 10% after accounting for inflation) versus around 4% for bonds, over a two hundred plus year timeframe. One problem – the validity of 69 years of the data (1802 – 1870) are now being questioned.

Any Utopian study or mathematical model is only as valuable as the data that goes into it. “Garbage in” will result in “garbage out.” According to a Wall Street Journal article (Does Stock-Market Data Really Go Back 200 Years?) written by Jason Zweig, the index data used by Siegel was too narrow on an industry basis and involved too few stocks (e.g., primarily banks, insurance and transportation stocks). In addition, the reliability of the conclusions is being second guessed because the data used by Professor Siegel starting back as far as 1802 were compiled decades ago by two separate economists, Walter Buckingham Smith and Arthur Harrison Cole.
According to Zweig, another area of concern is the fluctuating dividend yield used by Professor Siegel:
In an article published in 1992, he estimated the average annual dividend yield from 1802-1870 at 5.0%. Two years later in his book, it had grown to 6.4% — raising the average annual return in the early years from 5.7% to 7.0% after inflation. Why does that matter? By using the higher number for the earlier period, Prof. Siegel appears to have raised his estimate of the rate of return for the entire period by about half a percentage point annually.
I’m sure Professor Siegel has a rebuttal to all these accusations, but we’ll just have to wait and see how credible the response is. Maybe Siegel’s next book will be entitled, “Bonds for the Long Run”?
Wade W. Slome, CFA, CFP®
Plan. Invest. Prosper.
DISCLOSURE: Sidoxia Capital Management (SCM) and some of its clients own certain exchange traded funds, but at the time of publishing SCM had no direct position in any other security referenced in this article. No information accessed through the Investing Caffeine (IC) website constitutes investment, financial, legal, tax or other advice nor is to be relied on in making an investment or other decision. Please read disclosure language on IC “Contact” page.


