Posts tagged ‘commodities’
Return to Rationality?

As the worst pandemic in more than a generation is winding down in the U.S., people are readjusting their personal lives and investing worlds as they transition from ridiculousness to rationality. After many months of non-stop lockdowns, social distancing, hand-sanitizers, mask-wearing, and vaccines, Americans feel like caged tigers ready to roam back into the wild. An incredible amount of pent-up demand is just now being unleashed not only by consumers, but also by businesses and the economy overall. This reality was also felt in the stock market as the Dow Jones Industrial Average powered ahead another 654 points last month (+1.9%) to a new record level (34,529) and the S&P 500 also closed at a new monthly high (+0.6% to 4,204). For the year, the bull market remains intact with the Dow gaining almost 4,000 points (+12.8%), while the S&P 500 has also registered a respectable +11.9% return.

The story was different last year. The economy and stock market temporarily fell off a cliff and came to a grinding halt in the first quarter of 2020. However, with broad distribution of the vaccines and antibodies gained by the previously infected, herd immunity has effectively been reached. As a result, the U.S. COVID-19 pandemic has essentially come to an end for now and stock prices have continued their upward surge since last March.
Insanity to Sanity?
With the help of the Federal Reserve keeping interest rates at near-0% levels, coupled with trillions of dollars in stimulus and proposed infrastructure spending, corporate profits have been racing ahead. All this free money has pushed speculation into areas such as cryptocurrencies (i.e., Bitcoin, Dogecoin, Ethereum), SPACs (Special Purpose Acquisition Companies), Reddit meme stocks (GameStop Corp, AMC Entertainment), and highly valued, money-losing companies (e.g., Spotify, Uber, Snowflake, Palantir Technologies, Lyft, Peloton, and others). The good news, at least in the short-term, is that some of these areas of insanity have gone from stratospheric levels to just nosebleed heights. Take for example, Cathie Wood’s ARK Innovation Fund (ARKK) that invests in pricey stocks averaging a 91x price-earnings ratio, which exceeds 4x’s the valuation of the average S&P 500 stock. The ARK exchange traded fund that touts investments in buzzword technologies like artificial intelligence, machine learning, and cryptocurrencies rocketed +149% last year in the middle of a pandemic, but is down -10.0% this year. The Grayscale Bitcoin Trust fund (GBTC) that skyrocketed +291% in 2020 has fallen -5.6% in 2021 and -48.1% from its peak. What’s more, after climbing by more than +50% in less than four months, the Defiance NextGen SPAC fund (SPAK) has declined by -28.9% from its apex just a few months ago in February. You can see the dramatic 2021 underperformance in these areas in the chart below.

Inflation Rearing its Ugly Head?
The economic resurgence, weaker value of the U.S. dollar, and rising stock prices have pushed up inflation in commodities such as corn, gasoline, lumber, automobiles, housing, and a whole host of other goods (see chart below). Whether this phenomenon is “transitory” in nature, as Federal Reserve Chairman Jerome Powell likes to describe this trend, or if this is the beginning of a longer phase of continued rising prices, the answer will be determined in the coming months. It’s clear the Federal Reserve has its hands full as it attempts to keep a lid on inflation and interest rates. The Fed’s success, or lack thereof, will have significant ramifications for all financial markets, and also have meaningful consequences for retirees looking to survive on fixed income budgets.

As we have worked our way through this pandemic, all Americans and investors look to change their routines from an environment of irrationality to rationality, and insanity to sanity. Although the bull market remains alive and well in the stock market, inflation, interest rates, and speculative areas like cryptocurrencies, SPACs, meme-stocks, and nosebleed-priced stocks remain areas of caution. Stick to a disciplined and diversified investment approach that incorporates valuation into the process or contact an experienced advisor like Sidoxia Capital Management to assist you through these volatile times.

Wade W. Slome, CFA, CFP®
Plan. Invest. Prosper.
This article is an excerpt from a previously released Sidoxia Capital Management complimentary newsletter (June 1, 2021). Subscribe on the right side of the page for the complete text.
DISCLOSURE: Sidoxia Capital Management (SCM) and some of its clients hold positions in certain exchange traded funds (ETFs), but at the time of publishing had no direct position in GME, AMC, SPOT, UBER, SNOW, PLTR, LYFT, PTON, GBTC, SPAK, ARKK or any other security referenced in this article. No information accessed through the Investing Caffeine (IC) website constitutes investment, financial, legal, tax or other advice nor is to be relied on in making an investment or other decision. Please read disclosure language on IC Contact page.
Spring Has Sprung: Market Weather Turning

This article is an excerpt from a previously released Sidoxia Capital Management complimentary newsletter (April 1, 2016). Subscribe on the right side of the page for the complete text.
It was a cold winter for stocks, but as we approached the spring season in March, the flowers have begun to bloom. More specifically, during the month of March, the Dow Jones Industrial index catapulted +7.1% and the S&P 500 index jumped +6.6%. While this roughly +80% annualized rate is unlikely to sustain itself, this flurry of strong performance could be the sign of warmer weather conditions in the economic forecast.
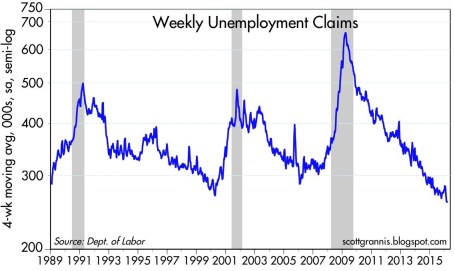
What started out as a cold and blustery January, with stocks posting one of the worst beginning months in history (S&P 500 down -5.1%), quickly thawed out in February and March. Fears over deteriorating economic conditions in the U.S., China along with plummeting oil prices proved fleeting. In fact, as Scott Grannis at Calafia Beach Pundit pointed out, there is no sign of recession in the U.S. as evidenced by a 43-year low in unemployment claims and a 4.9% unemployment rate (see chart below).
As I’ve stated for many years, focusing on the never-ending hurricane of pessimistic headlines is a wasteful use of time and destructive force on performance, if acted upon. Offsetting the downpour of negative news stories are the record low interest rates (now incomprehensibly negative in parts of the globe), which serve as a protective umbrella against the short-term stormy volatility. When investors face the soggy reality of earning a near-0% return on their bank savings and a sub-2% Treasury bond market for 10-year maturities, suddenly a 6-7% earnings yield on stocks certainly looks pretty sunny. There have been very few times in history when dividends earned on stocks have exceeded the payments received on a 10 year Treasury bond, but that is exactly the extreme environment we are living in today. No doubt, if the interest rate climate changes, and rates spike higher, stocks will face a more thunderous environment.
However, fortunately for stock market investors (and unfortunately for savers), this week Federal Reserve Chair Janet Yellen reiterated her forceful view of maintaining interest rates at a low, stimulative level for an extended period of time.
If It Bleeds It Leads – At the Expense of Your Portfolio
Even in the face of European terrorist attacks in Brussels and a turbulent (but entertaining) political presidential election season, the four pillars of earnings, interest rates, valuations, and sentiment are still protecting stock investors from an economic flood (see also Don’t Be a Fool, Follow the Stool). Scary news headlines may sell newspapers and attract advertising dollars, but the real money is made by following the four investing pillars.
Also contributing to a clearer outlook this spring is the steadying value of the U.S. dollar and stabilizing trend realized in oil prices.
For most of 2015, multinational corporations saw their profits squeezed due to a 20-25% spike in the dollar. For example, an auto manufacturer selling a car for $20,000 in the U.S. could suddenly see the price of the same car changed to $25,000 in Europe. Meanwhile, a different German competitor could price a similar car manufactured in their country at the lower $20,000. This all translates into diminished sales and profits for American companies. Mercifully, we are beginning to see these currency headwinds abate, and even begin to shift into a slight tailwind (see 5-year chart below).
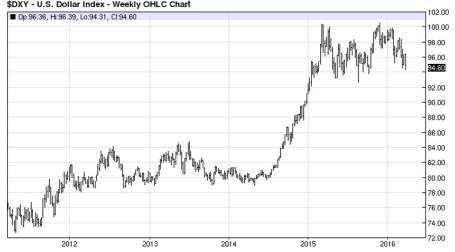
Source: barchart.com
From copper and corn to silver and soy beans, commodity prices have been in a downward death spiral over the last five years. And crude oil hasn’t escaped the commodity collapse either…until recently. The supply glut, created by factors like the U.S. shale revolution and new added Iranian post-sanction reserves, led to price declines from a 2009 high of $147 per barrel to a 2016 low of $26. With China and U.S. dollar fears abating, oil prices have bounced about +45% from the 2016 lows to about $38 per barrel.
While the weather has been improving on our shores, not everyone appreciates the fact the U.S. has been the “best house in a bad global neighborhood.” As the chart below shows (February 2016), international stock markets have gone into a bear market (down > -20%) since the 2011 and 2014 peaks, while the U.S. has performed about 100% better. Even in the U.S. market, small-midcap stocks (small & midsize companies) fell about -22% from their 2015 peak before recouping much of the losses.
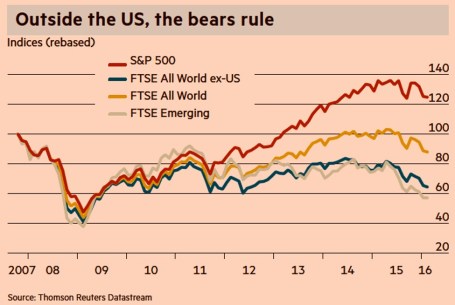
Source: Financial Times
Whether large companies, as measured by the S&P 500 index, which fell about -15% from the peak, suffer a true, technical -20% “bear market” or continue the current seven-year bull market is debatable. Regardless, what we do know is investors survived another cold winter and spring has produced a weather forecast that is currently predicting warmer weather and sunnier economic skies.

Wade W. Slome, CFA, CFP®
Plan. Invest. Prosper.
DISCLOSURE: Sidoxia Capital Management (SCM) and some of its clients hold positions in certain exchange traded funds (ETFs), but at the time of publishing had no direct position in any security referenced in this article. No information accessed through the Investing Caffeine (IC) website constitutes investment, financial, legal, tax or other advice nor is to be relied on in making an investment or other decision. Please read disclosure language on IC Contact page.
Dolphin or Shark…Time for Concern?

This article is an excerpt from a previously released Sidoxia Capital Management complimentary newsletter (March 1, 2016). Subscribe on the right side of the page for the complete text.
Through the choppy stock market waters of February, investors nervously tried to stay afloat as they noticed a fin cutting through the water. The only problem is determining whether the fin approaching is coming from a harmless dolphin or a ferocious shark? The volatility in 2016 has been disconcerting for many, but a life preserver was provided during the month with the Dow Jones Industrial Average up a modest 50 points (+0.30%).
Remaining calm can be challenging when facing a countless number of ever-changing concerns. Stock investors have caught lots of fish since early 2009 (prices have about tripled), but here are some of the scary headlines (fins) floating out in the financial markets:
- Recession? Overall corporate profits have slowed in the face of plummeting energy prices and the headwind of a strong dollar. However, corporate profit margins remain near record levels and if you exclude the decline in the troubled oil patch, core profits keep chugging along. If an imminent recession were actually on the horizon, you wouldn’t expect to see a 4.9% unemployment rate (8-year low); record auto sales; an improving housing market; and stimulative national gasoline prices at $1.75/gallon (recent recessions have been caused by high energy prices).
- Negative Interest Rates: Would you like to get paid to borrow money? With $6 trillion dollars of negative interest rate bonds in the market (see chart below), that’s exactly what is happening. Just imagine walking into your local Best Buy, and asking the salesman, “Can I borrow $2,000 to buy that big screen TV there…and oh by the way, can you pay me interest every month after you give me the money?” Scary to think many people are panicked over the stock market when they should be more alarmed over negative interest rates. Would you rather earn 6.4% on the average stock (S&P 500 earnings yield) and a 2.2% dividend yield vs negative interest rate bonds? As I always caution investors, even though interest rates are at/near a generational low, diversified portfolios still need exposure to bonds, even if you’re at/near retirement because of the stability they provide. Bonds act like expensive pillows – they are necessary to sleep at night. Although some observers point to negative rates as a sign of a global collapse, low inflation, aggressive foreign central bank monetary policies, and a lingering risk aversion hangover from the 2008-09 financial crisis probably have more to do with the current strange status of interest rates.
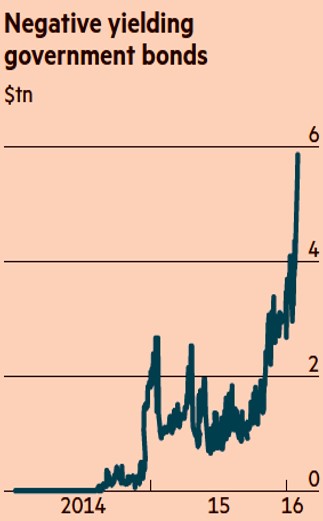
Source: Financial Times
- Political Turbulence: Uncertainty abounds in another election year, just as is the case every other four years. As we head into Super Tuesday, the day in the presidential primary season when the largest number of states hold primary elections, the Republicans are set to battle for approximately half of the delegates necessary to secure the party nomination. The Democrats will be competing for about one-third of the delegates. While many individuals are placing paramount importance on the outcomes of the presidential elections, history teaches us otherwise. The ultimate person elected as president will certainly have a significant impact on the direction of the country, but there are other contributing factors as important (or more important) to economic growth, including the Federal Reserve, and the two houses of Congress. On numerous occasions, I have pointed out the irrelevance of presidential politics (see also Who Said Gridlock is Bad?). As the chart shows below, the past confirms there is no consistency to stock market performance based on political party affiliations. Stocks have performed strongly (and poorly) under both party affiliations.

- Brexit? After lengthy negotiations with EU leaders in Brussels, Britain’s Prime Minister David Cameron set June 23rd as the referendum date for voters to determine whether Britain stays in the European Union. Opinions remain divided (see chart below), but we have seen this movie before with Greece’s threat to leave the EU. As we experienced with the Greece exit (“Grexit”) drama, calmer heads are likely to prevail again. Nevertheless, until the end of June, regrettably we will be forced to listen to continued Brexit fears (see also Brexit article in the Economist for a more thorough review).

- Collapsing Oil Prices: The violent decline in oil prices over the last few years has been swift from about $100/barrel to $34/barrel today. However, the economic slowdown in China, coupled with a stronger U.S. dollar, has led to a broad downfall in commodity prices over the last five years as well. As much as declining demand has hurt commodities and been stimulative for buyers, over-building and excess supply has pressured prices equally. Fortunately, there are signs commodity prices could be in the process of bottoming (see CRB Index).
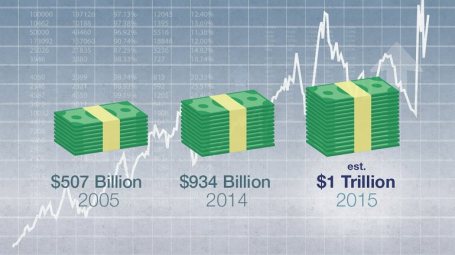
Financial market volatility in early 2016 has frayed some nerves, and the appearance of swirling fins has many investors wondering whether now’s the time to swim for shore or remain calm and catch the next growth wave. Despite the concerns over a potential recession, negative interest rates, bitter politics, Brexit fears, and depressed oil prices, our economy keeps slowly-but-surely powering forward. While U.S. corporations have been negatively impacted by a strong currency, compressed banking profits (i.e., lower interest rates), and a weak energy sector, S&P 500 companies are rewarding investors by returning a record $1 trillion in dividends and share buybacks (up from $500 million in 2005). When swimming in the current financial markets, you will be better served by swimming with the harmless dolphins rather than panicking over imaginary sharks.
Wade W. Slome, CFA, CFP®
Plan. Invest. Prosper.
DISCLOSURE: Sidoxia Capital Management (SCM) and some of its clients hold positions in certain exchange traded funds (ETFs), but at the time of publishing had no direct position in BBY or any other security referenced in this article. No information accessed through the Investing Caffeine (IC) website constitutes investment, financial, legal, tax or other advice nor is to be relied on in making an investment or other decision. Please read disclosure language on IC Contact page.
Going Shopping: Chicken vs. Beef

The headlines haven’t been very rosy over the last week, but when is that ever not the case? Simply put, gloom and doom sells. The Chinese stock market is collapsing; the Yuan is plummeting; there are rising tensions in the Middle East; terrorism is rising to the fore; and commodity prices are falling apart at the seams. This is only a partial snapshot of course, and does not paint a complete or accurate picture. Near record-low interest rates; record corporate profits (outside of energy); record-low oil prices; unprecedented accommodative central bank policies; and attractive valuations are but a few of the positive, countervailing factors that rarely surface through the media outlets.
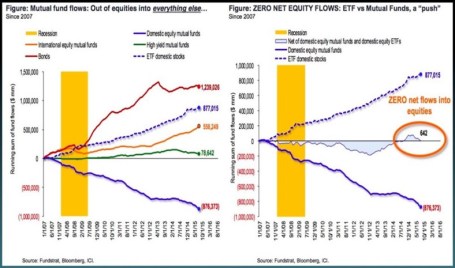
At the end of the day, smart long-term investors understand investing in financial markets is a lot like grocery store shopping. Similarly to stocks and bonds, prices at the supermarket fluctuate daily. Whether you’re comparing beef (bonds) and chicken (stocks) prices in the meat department (stock market), or apple (real estate) and orange (commodities) prices in the produce department (global financial markets), ultimately, shrewd shoppers eventually migrate towards purchasing the best values. Since the onset of the 2008-2009 financial crisis, risk aversion has dominated over value-based prudence as evidenced by investors flocking towards the perceived safety of cash, Treasury bonds, and other fixed income securities that are expensively priced near record highs. As you can see from the chart below, investors poured $1.2 trillion into bonds and effectively $0 into stocks. Consumers may still be eating lots of steaks (bonds) currently priced at $6.08/lb while chicken (stocks) is at $1.48/lb (see U.S. Department of Labor Data – Nov. 2015), but at some point, risk aversion will abate, and consumers will adjust their preferences towards the bargain product.
Some Shoppers Still Buying Chicken
While the general public may have missed the massive bull market in stocks, astute corporate executives and investment managers took advantage of the equity bargains in recent years, as seen by stock prices tripling from the March 2009 lows. As corporate profits and margins have marched to record levels, CEOs/CFOs put their money where their mouths are by investing trillions of dollars into share buybacks and mergers & acquisitions transactions.
Despite the advance in the multi-year bull market, with the recent sell-off, panic has once again dominated rational thinking. We see this rare phenomenon (a few times over the last century) manifest itself through a stock market dividend yield that exceeds the yield on Treasury bonds (2.2% S&P 500 vs 2.1% 10-Year Treasury). But if we are once again comparing beef vs. chicken prices (bonds vs stocks), the 6% earnings yield on stocks (i.e., Inverse P/E ratio or E/P) now looks even more compelling relative to the 2% yield on bonds. For example, the iShares Core U.S. Aggregate Bond ETF (AGG) is currently yielding a meager 2.3%.
For a general overview, Scott Grannis at Calafia Beach Pundit summarizes the grocery store flyer of investment options below:
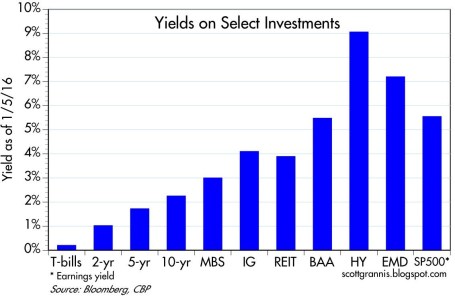
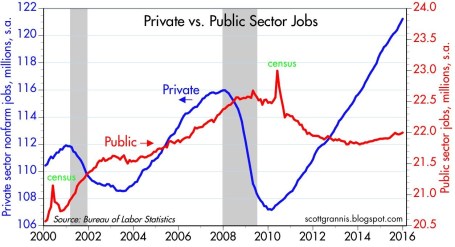
While these yield relationships can and will certainly change under various economic scenarios, there are no concrete signs of an impending recession. The recent employment data of 292,000 new jobs added during December (above the 200,000 estimate) is verification that the economy is not falling off a cliff into recession (see chart below). As I’ve written in the past, the positively-sloped yield curve also bolsters the case for an expansionary economy.
Source: Calafia Beach Pundit
While it’s true the Chinese economy is slowing, its rate is still growing at multiples of the U.S. economy. As a communist country liberalizes currency and stock market capital controls (i.e., adds/removes circuit breakers), and also attempts to migrate the economy from export-driven growth to consumer-driven expansion, periodic bumps and bruises should surprise nobody. With that said, China’s economy is slowly moving in the right direction and the government will continue to implement policies and programs to stimulate growth (see China Leaders Flag More Stimulus).
As we have recently experienced another China-driven correction in the stock market, and the U.S. economic expansion matures, equity investors must realize volatility is the price of admission for earning higher long-term returns. However, rather than panicking from fear-driven headlines, it’s times like these that should remind you to sharpen your shopping list pencil. You want to prudently allocate your investment dollars when deciding whether now’s the time to buy chicken (6% yield) or beef (2% yield).
Wade W. Slome, CFA, CFP®
Plan. Invest. Prosper.
DISCLOSURE: Sidoxia Capital Management (SCM) and some of its clients hold positions in certain exchange traded funds (ETFs) including AGG, but at the time of publishing had no direct position in any other security referenced in this article. No information accessed through the Investing Caffeine (IC) website constitutes investment, financial, legal, tax or other advice nor is to be relied on in making an investment or other decision. Please read disclosure language on IC Contact page.
Financial Markets Recharge with a Nap…Zzzzzz

This article is an excerpt from a previously released Sidoxia Capital Management complimentary newsletter (January 4, 2016). Subscribe on the right side of the page for the complete text.
Did you enjoy your New Year’s festivities? If you were like me and ate excessively and drank too much egg nog, you may have decided along the line to take a nap. It’s not a bad idea to recharge those batteries before implementing those New Year’s resolutions and jumping on the treadmill. That’s exactly what happened in the financial markets this year. After six consecutive years of positive returns in the Dow Jones Industrial Average (2009 – 2014), stock markets took a snooze in 2015, as measured by the S&P 500 and Dow, which were each down -0.7% and -2.2%, respectively. And bonds didn’t fare any better, evidenced by the -1.9% decline in the Aggregate Bond ETF (AGG), over the same time period. Given the deep-seated fears about the Federal Reserve potentially catapulting interest rates higher in 2015, investors effectively took a big yawn by barely nudging the 10-year Treasury Note yield higher by +0.1% from 2.2% to 2.3%.
Even though 2015 ended up being a quiet year overall, there were plenty of sweet dreams mixed in with scary nightmares during the year-long nap:
INVESTMENT SWEET DREAMS
Diamonds in the Rough: While 2015 stock prices were generally flat to down around the globe (Vanguard Total Word -4.2%), there was some sunshine and rainbows gleaming for a number of segments in the market. For example, handsome gains were achieved in the NASDAQ index (+5.7%); Biotech Index – BTK (+10.9%); Consumer Discretionary ETF – XLY (+8.3%); Health Care ETF – VHT (+5.8%); Information Technology ETF – VGT (+4.6%); along with numerous other investment areas.
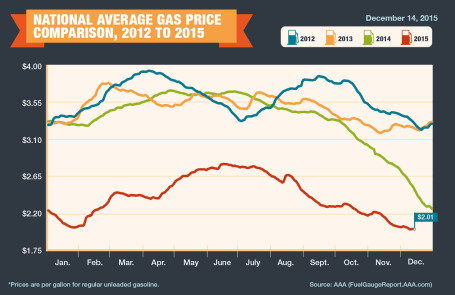
Fuel Fantasy Driven by Low Gas Prices: Gas prices averaged $2.01 per gallon nationally in December (see chart below), marking the lowest prices seen since 2009. Each penny in lower gas prices roughly equates to $1 billion in savings, which has strengthened consumers’ balance sheets and contributed to the multi-year economic expansion. Although these savings have partially gone to pay down personal debt, these gas reserves have also provided a financial tailwind for record auto sales (estimated 17.5million in 2015) and a slow but steady recovery in the housing market. The outlook for “lower-for-longer” oil prices is further supported by an expanding oil glut from new, upcoming Iranian supplies. Due to the lifting of economic sanctions related to the global nuclear deal, Iran is expected to deliver crude oil to an already over-supplied world energy market during the first quarter of 2016. Additionally, the removal of the 40-year ban on U.S. oil exports -could provide a near-term ceiling on energy prices as well.
Counting Cash Cows
Catching some shut-eye after reading frightening 2015 headlines on the China slowdown, $96 billion Greek bailout/elections, and Paris/San Bernardino terrorist attacks forced some nervous investors to count sheep to fall asleep. However, long-term investors understand that underpinning this long-lived bull market are record revenues, profits, and cash flows. The record $4.7 trillion dollars in 2015 estimated mergers along with approximately $1 trillion in dividends and share buybacks (see chart below) is strong confirmation that investors should be concentrating on counting more cash cows than sheep, if they want to sleep comfortably.
INVESTMENT NIGHTMARES
Creepy Commodities: Putting aside the -30% collapse in WTI crude oil prices last year, commodity investors overall were exhausted in 2015. The -24% decline in the CRB Commodity Index and the -11% weakening in the Gold Index (GLD) was further proof that a strong U.S. dollar, coupled with stagnant global growth, caused investors a lot of tossing and turning. While bad for commodity exporting countries, the collapse in commodity prices will ultimately keep a lid on inflation and eventually become stimulative for those consumers suffering from lower standards of living.
Dollar Dread: The +25% spike in the value of the U.S. dollar over the last 18 months has made life tough for multinational companies. If your business received approximately 35-40% of their profits overseas and suddenly your goods cost 25% more than international competitors, you might grind your teeth in your sleep too. Monetary policies around the globe, including the European Union, will have an impact on the direction of future foreign exchange rates, but after a spike in the value of the dollar in early 2015, there are signs this scary move may now be stabilizing. Although multinationals are getting squeezed, now is the time for consumers to load up on cheap imports and take that bargain foreign vacation they have long been waiting for.
January has been a challenging month the last couple years, and inevitably there will be additional unknown turbulence ahead – the opening day of 2016 not being an exception (i.e., China slowdown concerns and Mideast tensions). However, given near record-low interest rates, record corporate profits, and accommodative central bank policies, the 2015 nap taken by global stock markets should supply the necessary energy to provide a lift to financial markets in the year ahead.

Wade W. Slome, CFA, CFP®
Plan. Invest. Prosper.
DISCLOSURE: Sidoxia Capital Management (SCM) and some of its clients hold positions VHT, AGG, and in certain exchange traded funds (ETFs), but at the time of publishing had no direct position VT, BTK, XLY, VGT, GLD, or in any other security referenced in this article. No information accessed through the Investing Caffeine (IC) website constitutes investment, financial, legal, tax or other advice nor is to be relied on in making an investment or other decision. Please read disclosure language on IC Contact page.
March Madness – Dividend Grandness & Volatility Blandness

March Madness has arrived once again. This NCAA basketball event, which has been around since 1939, begins with a selection committee choosing the top 68 teams in the country. These teams are matched up against each other through a single-elimination tournament until a national champion is throned. The stock market does not have a selection committee that picks teams from conferences like the SEC, Big East, Pac-12, and ACC, but rather millions of investors select the best investments from asset classes like stocks, bonds, real estate, commodities, venture capital, and private equity.
In the investment world, there are no win-loss records, but rather there are risk-return profiles. Investors generally migrate towards the asset classes where they find the optimal trade-off between risk and return. Speculators, day-traders, and momentum traders may define risk differently, but regardless, over the long-run, capital goes where it is treated best. And over the last six years, the U.S. stock market hasn’t been a bad place to be (the S&P 500 has about tripled).
Why such outperformance in stocks? Besides a dynamic earnings recovery from the 2008-2009 financial crisis, another major factor has been the near-0% interest rate environment. When investors are earning near nothing in their bank and savings accounts, it is perfectly rational for savers to look for riskier options, if they are compensated for that risk. In addition to loose central bank and quantitative easing policies fueling demand for stocks, rising dividends have increased the attractiveness of the stock market. In fact, as you can see from the chart below, dividends have about doubled from 2008-2009 and about tripled from the year 2000.
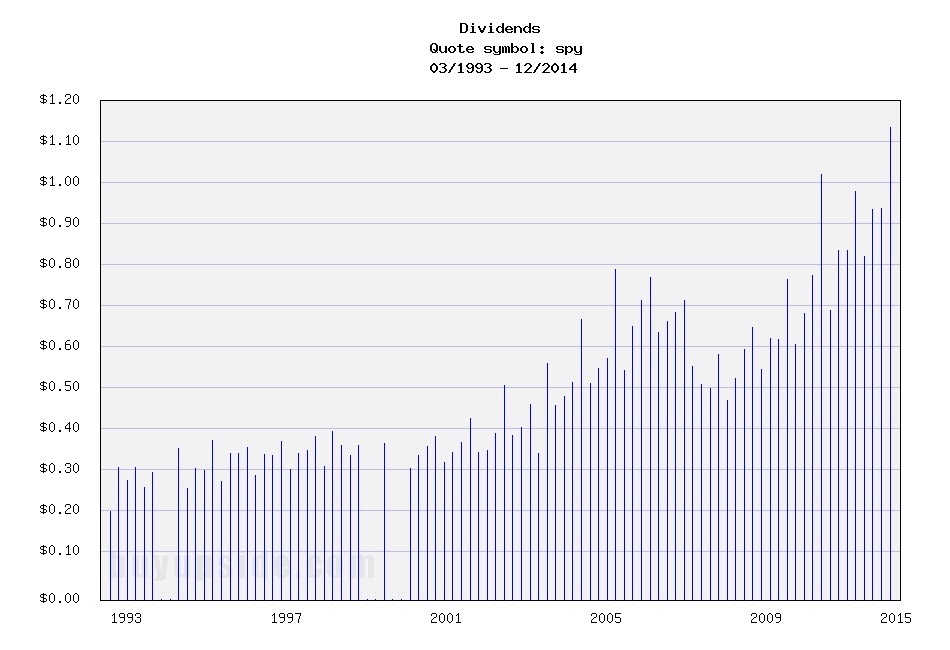
Source: Buy Upside
Stock prices have moved higher in concert with rising dividends, which, as you can see from the chart below, has kept the dividend yield flat at around 2% over the last few years. Treasury bond yields, on the other hand, have been on steady declining trend for the last 35 years. So, while coupons on newly issued bonds have been declining for virtually the last three and a half decades, stock dividends have been on a steadily upward moving rampage, excluding recessions (up +13% in the most recent reported period).
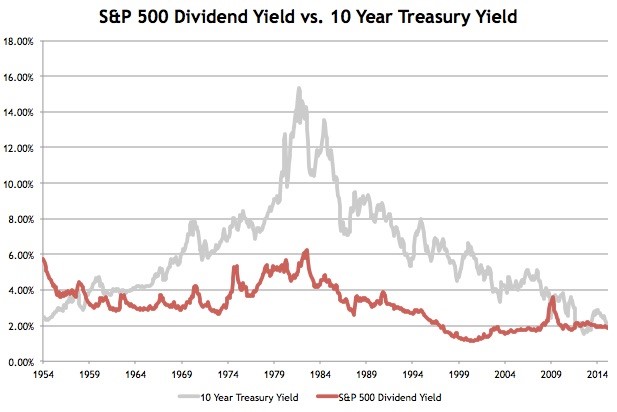
Source: Avondale Asset Management
Declining interest rates have made stocks look attractive relative to investment grade corporate bonds too as evidenced by the chart below. As you can see, over the last half-century, corporate bond yields have predominantly offered higher income yields than the earnings yield on stocks – that is not the case today.
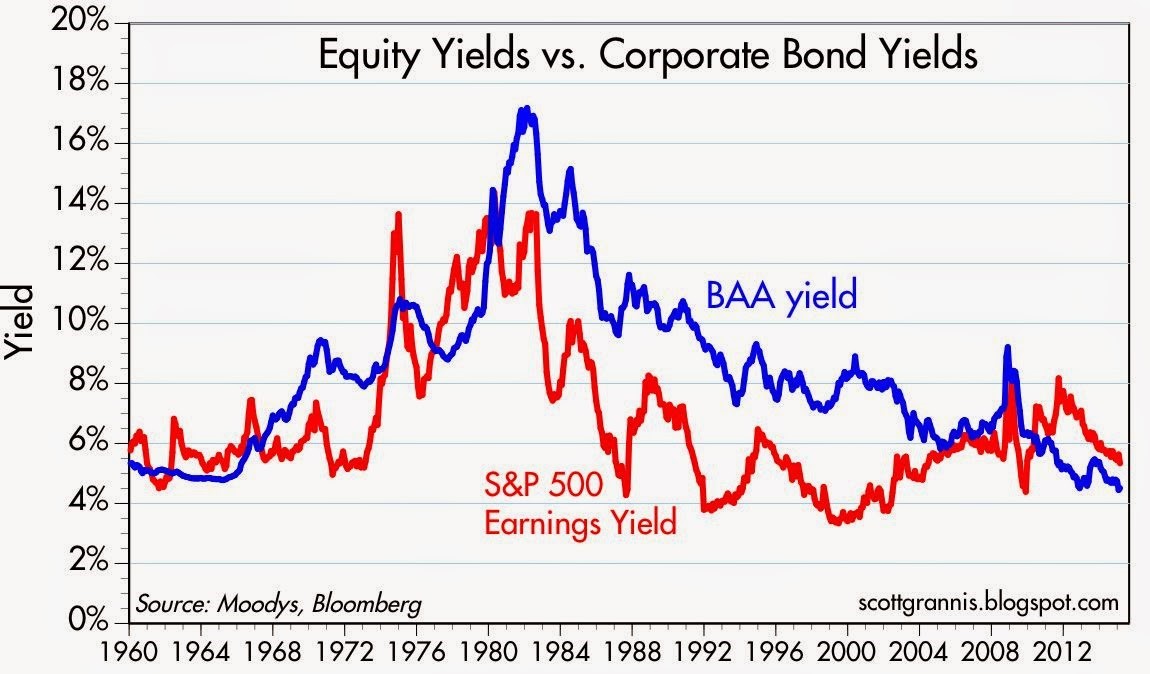
Source: Calafia Beach Pundit
What does all this stock dividend, earnings yield stuff mean? In the grand scheme of things, income starving Baby Boomers and retirees are slowly realizing that stocks in general stack up favorably in an environment in which interest payments are going down and dividend payments are going up. One of the areas highlighting the underlying demand for stocks is the Volatility Index (VIX) – a.k.a., the “Fear Gauge.” Despite Greece, Russia, ISIS, the Fed, and the Dollar dominating the headlines, the hunger for yield and growth in a declining interest rate environment is cushioning the blow during these heightened periods of volatility (see also A Series of Unfortunate Events).
Since the end of 2011, the monthly close of the VIX has stayed above its historical average of approximately 20 only two times (see chart below). In other words, over that timeframe, the VIX has remained below average about 95% of the time. When the VIX has spiked above 20, generally it has only been for brief periods, until cooler heads prevail and bargain hunters come in to buy depressed stock bargains.
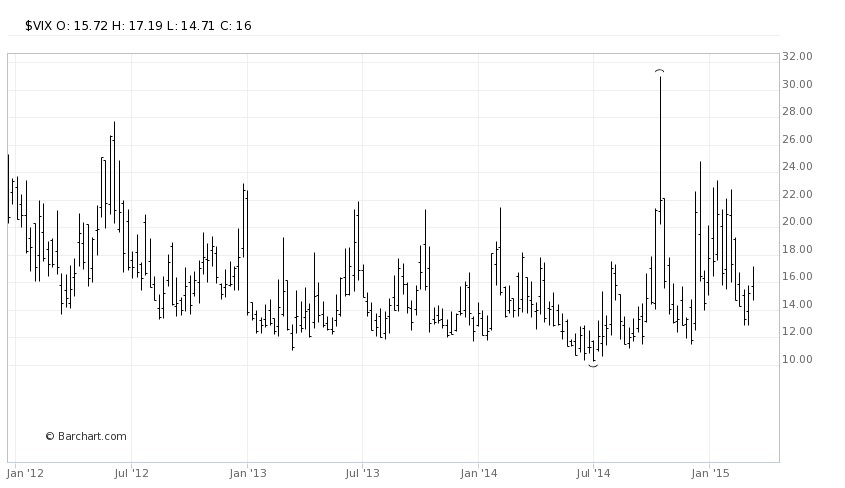
Source: Barchart
I’m not naïve enough to believe the bull market in stocks will last forever, but as long as interest rates don’t spike up and/or corporate earnings crater, underlying demand for yield should provide a floor for stocks during heightened periods of volatility. We may be in the midst of March Madness but volatility blandness is showing us that investors are paying attention to dividend grandness.

Wade W. Slome, CFA, CFP®
Plan. Invest. Prosper.
DISCLOSURE: Sidoxia Capital Management (SCM) and some of its clients hold positions in certain exchange traded funds (ETFs) and SPY, but at the time of publishing, SCM had no direct position in any other security referenced in this article. No information accessed through the Investing Caffeine (IC) website constitutes investment, financial, legal, tax or other advice nor is to be relied on in making an investment or other decision. Please read disclosure language on IC Contact page.
Why Buy at Record Highs? Ask the Fat Turkey

This article is an excerpt from a previously released Sidoxia Capital Management complementary newsletter (December 1, 2014). Subscribe on the right side of the page for the complete text.
I’ve fulfilled my American Thanksgiving duty by gorging myself on multiple helpings of turkey, mash potatoes, and pumpkin pie. Now that I have loosened my belt a few notches, I have had time to reflect on the generous servings of stock returns this year (S&P 500 index up +11.9%), on top of the whopping +104.6% gains from previous 5 years (2009-2013).
Conventional wisdom believes the Federal Reserve has artificially inflated the stock market. Given the perceived sky-high record stock prices, many investors are biting their nails in anticipation of an impending crash. The evidence behind the nagging investor skepticism can be found in the near-record low stock ownership statistics; dismal domestic equity fund purchases; and apathetic investor survey data (see Market Champagne Sits on Ice).
Turkey-lovers are in a great position to understand the predicted stock crash expected by many of the naysayers. As you can see from the chart below, the size of turkeys over the last 50+ years has reached a record weight – and therefore record prices per turkey:
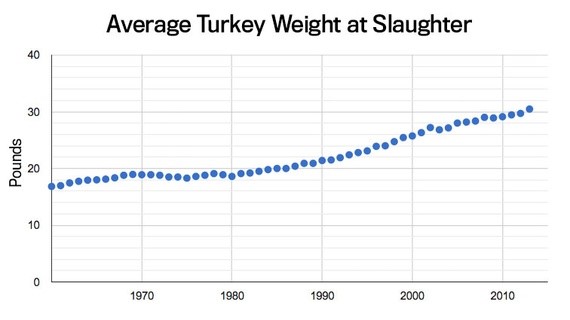
Source: The Atlantic
Does a record size in turkeys mean turkey meat prices are doomed for an imminent price collapse? Absolutely not. A key reason turkey prices have hit record levels is because Thanksgiving stomachs have been buying fatter and fatter turkeys every year. The same phenomenon is happening in the stock market. The reason stock prices have continued to move higher and higher is because profits have grown fatter and fatter every year (see chart below). Profits in corporate America have never been higher. CEOs are sitting on trillions of dollars of cash, and providing stock-investors with growing plump dividends (see also The Gift that Keeps on Giving), $100s of billions in shareholder friendly stock buybacks, while increasingly taking leftover profits to invest in growth initiatives (e.g., technology investments, international expansion, and job hiring).
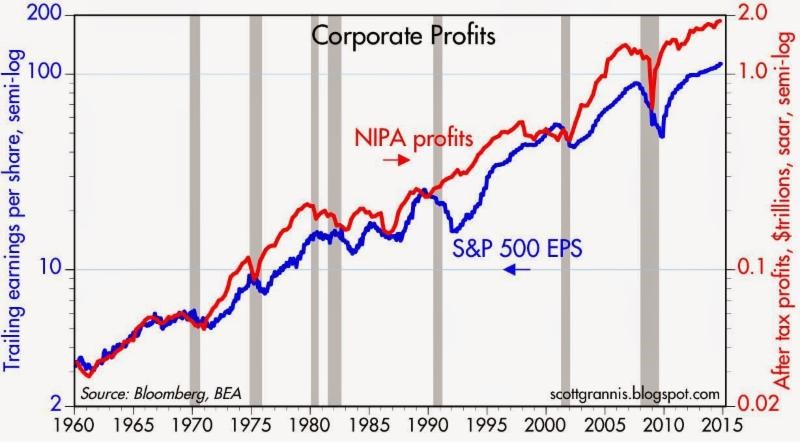
Source: Calafia Beach Pundit
Despite record turkey prices, I will make the bold prediction that hungry Americans will continue to buy turkey. More important than the overall price paid per turkey, the statistic that consumers should be paying more attention to is the turkey price paid per pound. Based on that more relevant metric, the data on turkey prices is less conclusive. In fact, turkey prices are estimated to be -13% cheaper this year on a per pound basis compared to last year ($1.58/lb vs. $1.82/lb).
The equivalent price per pound metric in the stock market is called the Price-Earnings (P/E) ratio, which is the price paid by a stock investor per $1 of profits (or earnings). Today that P/E ratio sits at approximately 17.5x. As you can see from the chart below, the current P/E ratio is reasonably near historical averages experienced over the last 50+ years. While, all else equal, anyone would prefer paying a lower price per pound (or price per $1 in earnings), any objective person looking at the current P/E ratio would have difficulty concluding recent stock prices are in “bubble” territory.
However, investor doubters who have missed the record bull run in stock market prices over the last five years (+210% since early 2009) have clung to a distorted, overpriced measurement called the CAPE or Shiller P/E ratio. Readers of my Investing Caffeine blog or newsletters know why this metric is misleading and inaccurate (see also Shiller CAPE Peaches Smell).
Don’t Be an Ostrich

While prices of stocks arguably remain reasonably priced for many Baby Boomers and retirees, the conclusion should not be to gorge 100% of investment portfolios into stocks. Quite the contrary. Everyone’s situation is unique, and every investor should customize a globally diversified portfolio beyond just stocks, including areas like fixed income, real estate, alternative investments, and commodities. But the exposures don’t stop there, because in order to truly have the diversified shock absorbers in your portfolio necessary for a bumpy long-term ride, investors need exposure to other areas. Such areas should include international and emerging market geographies; a diverse set of styles (e.g., Value, Growth, Blue Chip dividend-payers); and a healthy ownership across small, medium, and large equities. The same principles apply to your bond portfolio. Steps need to be taken to control credit risk and interest rate risk in a globally diversified fashion, while also providing adequate income (yield) in an environment of generationally low interest rates.
While I’ve spent a decent amount of time talking about eating fat turkeys, don’t let your investment portfolio become stuffed. The year-end time period is always a good time, after recovering from a food coma, to proactively review your investments. While most non-vegetarians love eating turkey, don’t be an investment ostrich with your head in the sand – now is the time to take actions into your own hands and make sure your investments are properly allocated.
Wade W. Slome, CFA, CFP®
Plan. Invest. Prosper.
DISCLOSURE: Sidoxia Capital Management (SCM) and some of its clients own a range of positions in certain exchange traded fund positions, but at the time of publishing SCM had no direct position in any other security referenced in this article. No information accessed through the Investing Caffeine (IC) website constitutes investment, financial, legal, tax or other advice nor is to be relied on in making an investment or other decision. Please read disclosure language on IC Contact page.
Nail Not in Emerging Market Coffin Yet

I wouldn’t say the nail is in the emerging market coffin quite yet. During the financial crisis, the EMSCI Emerging Market Index (EEM) was left for dead (down -50% in 2008) before resurrection in 2009 and 2010 (up +74% and +16%, respectively). For the last two years however, the EMSCI index has underperformed the S&P 500 Index massively by more than -30%. Included in this international index are holdings from China, Russia, India, Brazil, South Korea, and South Africa, among others.
The question now becomes, can the emerging markets resurrect themselves from the dead again? Recent signs are flashing “yes”. Over the last three months, the emerging markets have outperformed the S&P 500 by more than +8%, but these stocks still have a lot of ground to make up before reaching the peak levels of 2007. Last year’s slowing growth in China and a European recession, coupled with talks of the Federal Reserve’s “tapering” of monetary stimulus, didn’t provide the EMSCI index any help over the last few years.
With all the distracting drama currently taking place in Washington D.C., it’s a relief to see some other indications of improvement. For starters, China’s most recent PMI manufacturing index results showed continued improvement, reaching a level of 51.1 – up from August and signaling a reversal from contraction earlier this year (levels above 50 point to expansion). Chinese government leaders are continuing their migration from an externally export-driven economy to an internally consumer-driven economy. Despite the shift, China is still targeting a respectable +7.5% GDP economic growth target, albeit a slower level than achieved in the past.
Adding to emerging market optimism is Europe’s apparent economic turnaround (or stabilization). As you can see from the chart below, the European Institute for Supply Management (ISM) service sector index has lately shown marked improvement. If the European and Chinese markets can sustain these recovering trends, these factors bode well for emerging market financial returns.
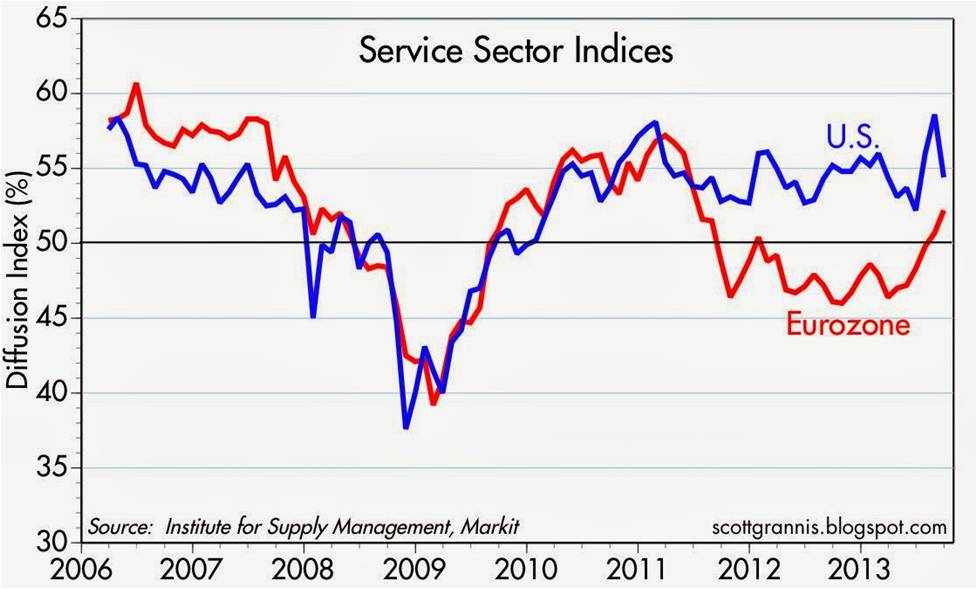
Source: Calafia Beach Pundit
While it is clear these developments are helping the rebound in emerging market indices, it is also clear the supply-demand relationship in commodities will coincide with the next big up or down move in developing markets. Ed Yardeni, strategist and editor of Dr. Ed’s Blog, recently wrote a piece showing the tight correlation between emerging market stock prices and commodity prices (CRB Index). His conclusions come as no surprise to me given these resource-rich markets and their dependence on Chinese demand along with commodity needs from other developed countries. Expanding populations and rising standards of living in emerging market countries have and will likely continue to position these countries well for long-term commodity price appreciation. The development of new, higher-value service and manufacturing sectors should also lead to sustainably improved growth in these emerging markets relative to developed economies.
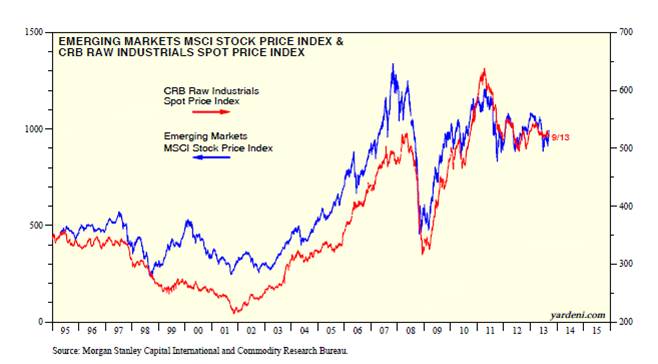
Source: Dr. Ed’s Blog
Adding fuel to the improving emerging market case is the advancement in the Baltic Dry Index (see chart below). The recent upward trajectory of the index is an indication that the price for moving major raw materials like coal, iron ore, and grains by sea is rising. This statistical movement is encouraging, but as you can see it is also very volatile.
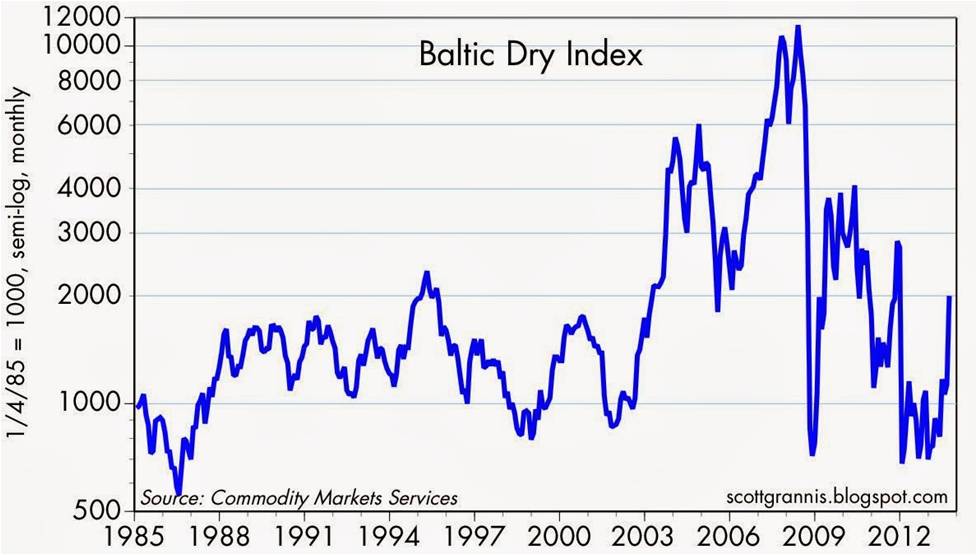
Source: Calafia Beach Pundit
While the emerging markets are quite unpredictable and have been out-of-favor over the last few years, a truly diversified portfolio needs a healthy dosage of this international exposure. You better check a pulse before you put a nail in the coffin – the emerging markets are not dead yet.
Wade W. Slome, CFA, CFP®
Plan. Invest. Prosper.
DISCLOSURE: Sidoxia Capital Management (SCM) and some of its clients hold positions in certain exchange traded funds (ETFs) including emerging market ETFs, but at the time of publishing, SCM had no direct position in EEM, or any other security referenced in this article. No information accessed through the Investing Caffeine (IC) website constitutes investment, financial, legal, tax or other advice nor is the information to be relied on in making an investment or other decision. Please read disclosure language on IC Contact page.
Organizing Your Investment Basket

With the Easter bunny relaxing after a busy holiday, kids from all over are given the task of organizing the candy and money collected during their hunts. Investors are also constantly reminded that their portfolio eggs should not be solely placed in one basket either. Instead, investors are told to diversify their investments across a whole host of asset classes, geographies, styles, and sizes. In other words, this means investors should be spreading their money across commodity, real estate, international, emerging market, value, growth, small-cap, and large-cap investments. As Jason Zweig, journalist from a the Wall Street Journal points out, much of the diversification benefits can be achieved with relatively small change in the position count of a portfolio:
“As many studies have shown, at least 40% of the variability in returns can be reduced by moving from a single company to 20. Once a portfolio contains 20 or 30 stocks, adding more does little to damp the fluctuations in wealth over time.”
But wait. Going from one banking stock to 20 banking stocks is not going to provide you with the proper diversification you want or need. Rather, what is as important as investing across asset class, geography, style, and size, is to follow the individual stock strategies of guru Peter Lynch. In order to put his performance into perspective, Lynch’s Fidelity Magellan fund averaged +29% per year from 1977 – 1990 – almost doubling the return of the S&P 500 index for that period.
More specifically, to achieve these heroic returns, Lynch divided the stocks in his fund into the following categories:
Slow Growers: This group of stocks wasn’t Lynch’s favorite because these companies typically operate in mature industries with limited expansion opportunities. For these single-digit EPS growers, Lynch focused more on identifying high dividend-paying stocks that were trading at attractive valuations. In particular, he paid attention to a dividend-adjusted PEG ratio (Price-to-Earnings Growth). A utility company would be an example of a “Slow Grower.”
Stalwarts: These are large established companies that still have the ability to achieve +10% to +12% annual earnings growth regardless of the economic cycle. Lynch liked these stocks especially during recessions and downturns. Valuations are still very important for Stalwarts, and many of them pay dividends. An investor may not realize a “home run” with respect to returns, but a +30% to 50% return over a few years is not out of the question, if selected correctly. Former examples of “Stalwarts” include Coca Cola (KO) and Procter & Gamble (PG).
Fast Growers: This categorization applies to small aggressive firms averaging about +20% to +25% annual earnings growth. While “Fast Growers” offer the most price appreciation potential, these stocks also offer the most risk, especially once growth/momentum slows. If timed correctly, as Lynch adeptly achieved, these stocks can increase multi-fold in value. The great thing about these “Fast Growers” is they don’t have to reside in fast growth industries. Lynch actually preferred market share gainers in legacy industries.
Cyclicals: These companies tend to see their sales and profits rise and fall with the overall economic cycle. The hyper-sensitivity to economic fluctuations makes the timing on these stocks extremely tricky, leading to losses and tears – especially if you get in too late or get out too late. To emphasize his point, Lynch states, “Cyclicals are like blackjack: stay in the game too long and it’s bound to take all your profit.” The other mistake inexperienced investors make is mistaking a “Cyclical” company as a “Stalwart” at the peak of a cycle. Examples of cyclical industries include airline, auto, steel, travel, and chemical industries.
Turnarounds: Lynch calls these stocks, “No Growers,” and they primarily of consist of situations like bail-outs, spin-offs, and restructurings. Unlike cyclical stocks, “Turnarounds” are usually least sensitive to the overall market. Even though these stocks are beaten down or depressed, they are enormously risky. Chyrysler, during the 1980s, was an example of a favorable Lynch turnaround.
Asset Plays: Overlooked or underappreciated assets such as real estate, oil reserves, patented drugs, and/or cash on the balance sheet are all examples of “Asset Plays” that Lynch would consider. Patience is paramount with these types of investments because it may take considerable time for the market to recognize such concealed assets.
Worth noting is that not all stocks remain in the same Lynch category. Apple Inc. (AAPL) is an example of a “Fast Grower” that has migrated to “Stalwart” or “Slow Grower” status, therefore items such as valuation and capital deployment (dividends and share buyback) become more important.
Peter Lynch’s heroic track record speaks for itself. Traditional diversification methods of spreading your eggs across various asset class baskets is useful, but this approach can be enhanced by identifying worthy candidates across Lynch’s six specific stock categories. Hunting for these winners is something Lynch and the Easter bunny could both agree upon.
Wade W. Slome, CFA, CFP®
Plan. Invest. Prosper.
DISCLOSURE: Sidoxia Capital Management (SCM) and some of its clients hold positions in certain exchange traded funds (ETFs) and AAPL, but at the time of publishing SCM had no direct position in KO, PG, Chrysler, Fidelity Magellan, or any other security referenced in this article. No information accessed through the Investing Caffeine (IC) website constitutes investment, financial, legal, tax or other advice nor is to be relied on in making an investment or other decision. Please read disclosure language on IC Contact page.
The European Dog Ate My Homework

I never thought my daily routine would be dominated by checking European markets before our domestic open, but these days it is appearing like the European tail is wagging the global dog. Tracking Spanish bond yields from the Tesoro Publico and the Italia Borsa index is currently having a larger bearing on my portfolio than U.S. fundamentals. When explaining short term performance to others, I feel a little like an elementary school student making an excuse that my dog ate my homework.
Although the multi-year European saga has gone on for years, this too shall pass. What’s more, despite the bailouts of Portugal, Ireland, and Greece in recent years, the resilient U.S. economy has recorded 11 consecutive quarters of GDP (Gross Domestic Product) growth and added more than 4 million jobs, albeit at a less than desirable pace.
Could it get worse? Certainly. Will it get worse before it gets better? Probably. Is worsening European fundamentals and a potential Greek eurozone exit already factored into current stock prices? Possibly. The truth of the matter is that nobody knows the answers to these questions with certainty. At this point, the probability of an unknown or unexpected event in a different geography is more likely to be the cause of our economic downfall than a worsening European crisis. As sage investor and strategist Don Hays aptly points out, “When everyone is concerned about a problem, that problem is solved.” That may be overstating the truth a bit, but I do believe the issues absent from current headlines are the matters we should be most concerned about.
The European financial crisis may drag on for a while longer, but nothing lasts forever. Years from now, worries about the PIIGS countries (Portugal, Ireland, Italy, Greece, Spain) will switch to others, like the BRICs (Brazil, Russia, India, China) or other worry geography du jour. The issues of greatest damage in 2008-2009, like Bear Stearns, Lehman Brothers, AIG, CDS (credit default swaps), and subprime mortgages, didn’t dominate the headlines for years like the European crisis stories of today. As compared to Europe’s problems, these prior pains felt like Band Aids being quickly ripped off.
Correlation Conundrum
Eventually European worries will be put on the backburner, but until some other boogeyman dominates the daily headlines, our financial markets will continue to correlate tightly with European security prices. How does one fight these tight correlations? For starters, the correlations will not stay tight forever. If an investor can survive through the valley of strong security association, then the benefits will eventually accrue.
Although the benefits from diversification may disappear in the short-run, they should not be fully forgotten. Bonds, cash, and precious metals (i.e., gold) proved to be great portfolio diversifiers in 2008 and early 2009. Commodities, inflation protection, floating rate bonds, real estate, and alternative investments, are a few asset classes that will help diversify portfolios. Risk is defined in many circles as volatility (i.e., standard deviation) and combining disparate asset classes can lower volatility. But risk, defined as the potential of experiencing permanent losses, can also be controlled by focusing on valuation. By in large, large cap dividend paying stocks have struggled for more than a decade, despite equity dividend yields for the S&P 500 exceeding 10-year Treasury yields (the first time in more than 50 years). Investing in large companies with strong balance sheets and attractive growth prospects is another strategy of lowering portfolio risk.
Politics & Winston Churchill
Some factors however are out of shareholders hands, such as politics. As we know from last year’s debt ceiling melee and credit downgrade debacle, getting things done in Washington is very challenging. If you think achieving consensus in one country is difficult, imagine what it’s like in herding 17 countries? That’s the facts of life we are dealing with in the eurozone right now.
Although I am optimistic something will eventually get done, I consider myself a frustrated optimist. I am frustrated because of the gridlock, but optimistic because these problems are not rocket science. Rather these challenges are concepts my first grade child could understand:
• Expenses are running higher than revenues. You must cut expenses, increase revenues, or a combination thereof.
• Adding debt can support growth, but can lead to inflation. Cutting debt can hinder growth, but leads to a more sustainable fiscal state of wellbeing.
Relieving all the excess global leverage is a long, tortuous process. We saw firsthand here in the U.S. what happened to the U.S. real estate market and associated financial institutions when irresponsible debt consumption took place. Fortunately, corporations and consumers adjusted their all-you-can-eat debt buffet habits by going on a diet. As a matter of fact, corporations today are holding records amounts of cash and debt service loads for consumers has been reduced to levels not seen in decades (see chart below). Unlike governments, luckily CEOs and individuals do not need Congressional approval to adapt to a world of reality – they can simply adjust spending habits.

Source: Calafia Beach Pundit (Scott Grannis)
Governments, on the other hand, generally do need legislative approval to adjust spending habits. Regrettably, cutting the benefits of your constituents is not a real popular political strategy for accumulating votes or brownie points. If you don’t believe me, see what voters are doing to their leaders in Europe. Nicolas Sarkozy is the latest European leader to be booted from office due to austerity backlash and economic frustration. No less than nine European leaders have been cast aside since the financial crisis began.
The fate for U.S. politicians is less clear as we enter into a heated presidential election over the next six months. We do however know how the mid-term Congressional elections fared for the incumbents…not all sunshine and roses. Until elections are completed, we are resigned to the continued mind-numbing political gridlock, with no tangible resolutions to the trillion dollar deficits and gargantuan debt load. Obviously, most citizens would prefer a forward looking strategic plan from politicians (rather than a reactive one), but there are no signs that this will happen anytime soon…in either party.
Realistically though, tough decisions made by politicians only occur during crises, and if this slow-motion train wreck continues along this same path, then at least we have something to look forward to – forced resolution. We are seeing this firsthand in Greece. The “bond vigilantes” (see Plumbers & Cops) and responsible parents (i.e., Germany) have given Greece two options:
1.) Fix your financial problems and receive assistance; or
2.) Leave the EU (return to the Drachma currency) and figure your problems out yourself.
Panic has a way of forcing action, and we are approaching that “when push comes to shove” moment very quickly. I believe the Europeans are currently taking a note from our strategic playbook, which basically is the spaghetti approach – throw lots of things up on the wall and see what sticks. Or as Winston Churchill stated, “You can always count on Americans to do the right thing – after they’ve tried everything else.”
There is no question, the European sovereign debt issue is a complete mess, and there are no clear paths to a quick solution. Until voters force politicians into making tough unpopular decisions, or leaders come together with forward looking answers, the default position will be to keep kicking the fiscal can issues down the road. In the absence of political leadership, eventually the crisis will naturally force tough decisions to be made. Until then, I will go on explaining to others how the European dog ate my homework.
Wade W. Slome, CFA, CFP®
Plan. Invest. Prosper.
DISCLOSURE: Sidoxia Capital Management (SCM) and some of its clients own certain exchange traded funds (including commodities, inflation protection, floating rate bonds, real estate, dividend, and alternative investment ETFs), but at the time of publishing SCM had no direct position in AIG, JNJ, Bear Stearns, Lehman Brothers, or any other security referenced in this article. No information accessed through the Investing Caffeine (IC) website constitutes investment, financial, legal, tax or other advice nor is to be relied on in making an investment or other decision. Please read disclosure language on IC “Contact” page.


