Posts tagged ‘Case Shiller’
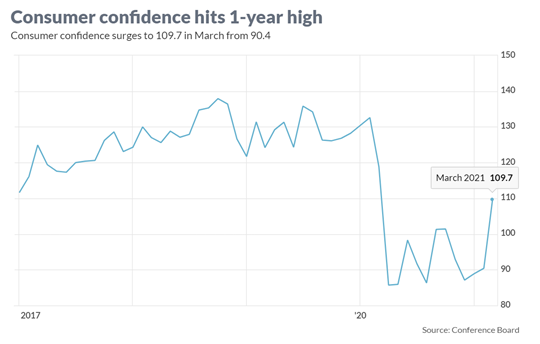
Consumer Confidence Flies as Stock Market Hits New Highs

As the economy starts reopening from a global pandemic that is improving, consumers and businesses are beginning to see a light at the end of the tunnel. The surge in the recently reported Consumer Confidence figures to a new one-year high (see chart below) is evidence the recovery is well on its way. A stock market reaching new record highs is further evidence of the reopening recovery. More specifically, the Dow Jones Industrial Average catapulted 2,094 points higher (+6.2%) for the month to 32,981 and the S&P 500 index soared +4.2%. A rise in interest rate yields on the 10-Year Treasury Note to 1.7% from 1.4% last month placed pressure on technology growth stocks, which led to a more modest gain of +0.4% in the tech-heavy NASDAQ index during March.
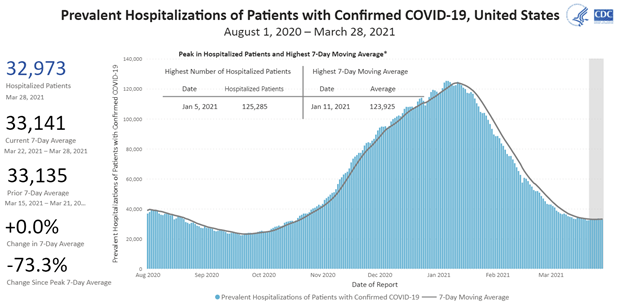
Comeback from COVID
With a combination of 150 million vaccine doses administered and 30 million cumulative COVID cases, the U.S. population has creeped closer toward herd immunity protection against the virus and pushed down hospitalizations dramatically (see chart below).
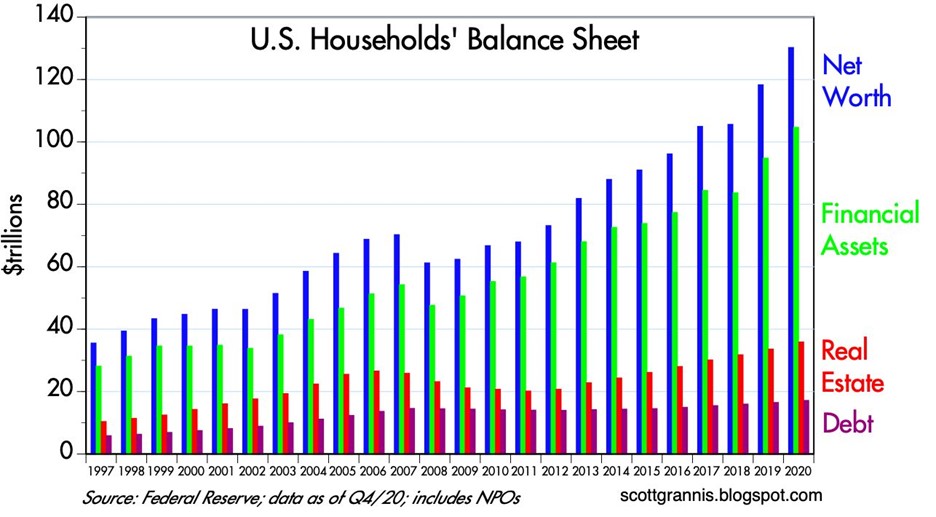
Also contributing to investor optimism have been the rising values of investments and real estate assets thanks to an improving economy and COVID case count. As you can see from the chart below, the net worth of American households has more than doubled from the 2008-2009 financial crisis to approximately $130 trillion dollars, which in turn has allowed consumers to responsibly control and manage their personal debt. Unfortunately, the U.S. government hasn’t been as successful in keeping debt levels in check.
Spending and Paying for Infrastructure Growth
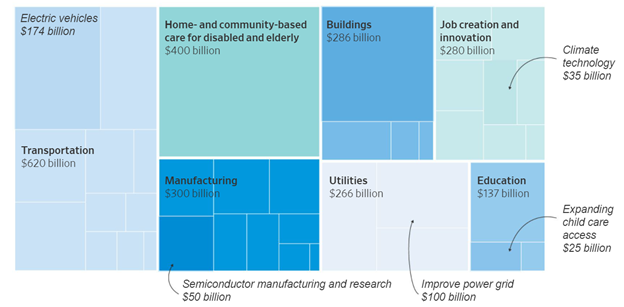
Besides focusing on positive COVID trends, investors have also centered their attention on the passage of a $1.9 trillion stimulus bill last month and a new proposed $2.3 trillion infrastructure bill that President Biden unveiled details on yesterday. At the heart of the multi-trillion dollar spending are the following components (see also graphic below):
- $621 billion modernize transportation infrastructure
- $400 billion to assist the aging and disabled
- $300 billion to boost the manufacturing industry
- $213 billion to build and retrofit affordable housing
- $100 billion to expand broadband access
With over $28 trillion in government debt, how will all this spending be funded? According to The Fiscal Times, there are four main tax categories to help in the funding:
Corporate Taxes: Raising the corporate tax rate to 28% from 21% is expected to raise $730 billion over 10 years
Foreign Corporate Subsidiary Tax: A new global minimum tax on foreign subsidiaries of American corporations is estimated to raise $550 billion
Capital Gains Tax on Wealthy: Increasing income tax rates on capital gains for wealthy individuals is forecasted to raise $370 billion
Income Tax on Wealthy: Lifting the top individual tax rate back to 39.6% for households earning more than $400,000 per year is seen to bring in $110 billion
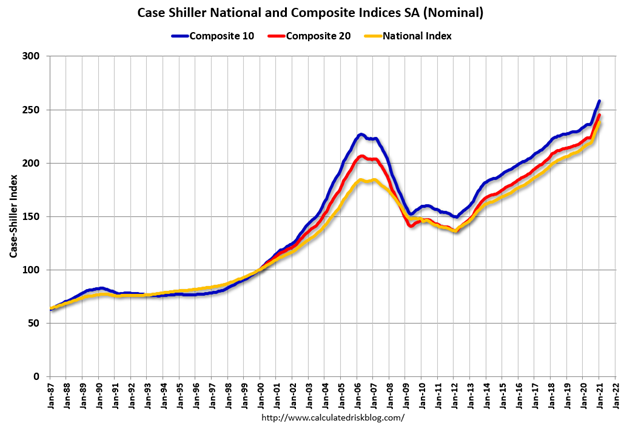
Besides the economy being supported by government spending, growth and appreciation in the housing market are contributing to GDP growth. The recently released housing data shows housing prices accelerating significantly above the peak levels last seen before the last financial crisis (see chart below).
Although the economy appears to be on solid footing and stock prices have marched higher to new record levels, there are still plenty of potential factors that could derail the current bull market advance. For starters, increased debt and deficit spending could lead to rising inflation and higher interest rates, which could potentially choke off economic growth. Bad things can always happen when large financial institutions take on too much leverage (i.e., debt) and speculate too much (see also Long-Term Capital Management: When Genius Failed). The lesson from the latest, crazy blow-up (Archegos Capital Management) reminds us of how individual financial companies can cause billions in losses and cause ripple-through effects to the whole financial system. And if that’s not enough to worry about, you have rampant speculation in SPACs (Special Purpose Acquisition Companies), Reddit meme stocks (e.g., GameStop Corp. – GME), cryptocurrencies, and NFTs (Non-Fungible Tokens).
Successful investing requires a mixture of art and science – not everything is clear and you can always find reasons to be concerned. At Sidoxia Capital Management, we continue to find attractive opportunities as we strive to navigate through areas of excess speculation. At the end of the day, we remain disciplined in following our fundamental strategy and process that integrates the four key legs of our financial stool: corporate profits, interest rates, valuations, and sentiment (see also Don’t Be a Fool, Follow the Stool). As long as the balance of these factors still signal strength, we will remain confident in our outlook just like consumers and investors are currently.

Wade W. Slome, CFA, CFP®
Plan. Invest. Prosper.
This article is an excerpt from a previously released Sidoxia Capital Management complimentary newsletter (April 1, 2021). Subscribe on the right side of the page for the complete text.
DISCLOSURE: Sidoxia Capital Management (SCM) and some of its clients hold positions in certain exchange traded funds (ETFs), but at the time of publishing had no direct position in GME or any other security referenced in this article. No information accessed through the Investing Caffeine (IC) website constitutes investment, financial, legal, tax or other advice nor is to be relied on in making an investment or other decision. Please read disclosure language on IC Contact page.
Stock Market at Record Highs…April Fool’s?

Article is an excerpt from previously released Sidoxia Capital Management’s complementary April 1, 2013 newsletter. Subscribe on right side of page.
April Fool’s Day has been around for centuries and has provided an opportunity for foolish pranks to be played on the masses around the world. Evidence of the global practice can be found from the bumper spaghetti harvest in Switzerland filmed by the BBC in 1957. The video footage (click here) was so convincing, viewers called and asked how they could grow their own spaghetti.
A cruel prank has also been played on investing skeptics as they have watched the S&P 500 and Dow Jones Industrials indexes catapult to new record highs over the last five quarters (up +25% & +19%, respectively). How can the stock market be setting new records when we have recently experienced a fiscal cliff, sequestration, a deepening European recession, slowing corporate profit growth, anemic GDP (Gross Domestic Product) expansion (0.4% last quarter), and a $13 billion Cyprus bailout?
The short answer is the economy continues to improve at a steady pace; stock prices are attractive; and gloomy headlines sell more advertisements in newspapers, magazines and on television. Is this wealth explosion a practical joke, or how can we help better explain this surprising phenomenon?
1) Record Corporate Profits
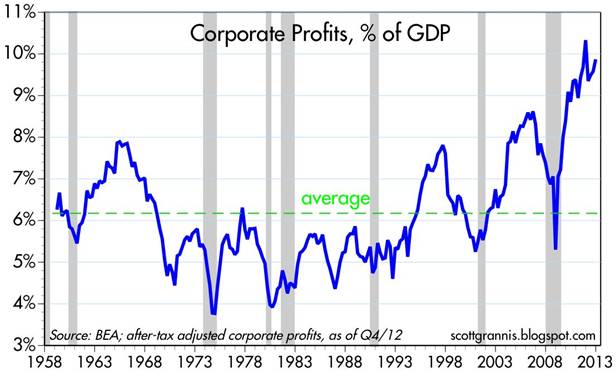
Source: Scott Grannis
Corporate profits are at record levels. After the worst financial crisis in a generation, companies have become mean and lean. They are hiring cautiously to maintain healthy profit margins, but also investing into productivity-improving technology and equipment.
2) Record Dividends and Share Buybacks Galore
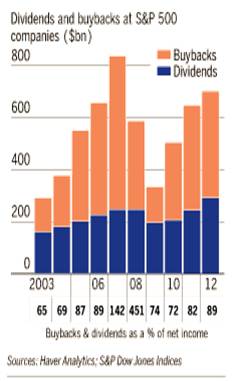
Source: WSJ
Annual dividend payments have reached a record level of more than $300 billion for S&P 500 companies, and there are no signs of this trend slowing down. This is occurring just as interest rates on bonds have been continuing to decline. Tack on a few hundred billion dollars in share buybacks to boost stock prices, and you get a recipe investors are enjoying.
3) Housing on the Comeback Trail
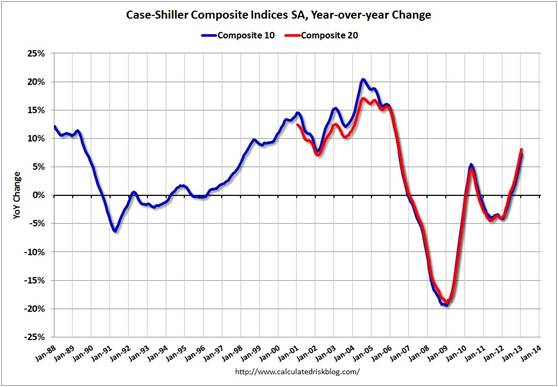
Source: Calculated Risk
Housing accounts for a significant portion of our economy. After several years of depression-like activity, this sector is on the comeback trail. In fact, the S&P/Case-Shiller index, that measures home prices in 20 major metropolitan cities, rose by +8.1% in the most recent reported figure. This increase was the largest gain in six-and-a-half years. This is important because the improvement in housing filters through to other major sectors of the economy, such as retail (e.g., furniture), banking (e.g., mortgages), and government (e.g., property taxes).
4) Consumer Spending Can’t be Killed
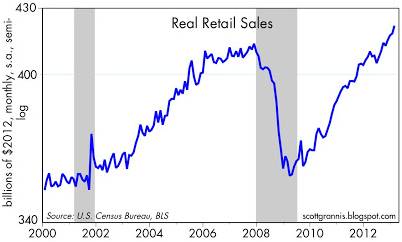
Source: Scott Grannis
Like a cockroach, the consumer is tough to exterminate. Consumer spending accounts for roughly 70% of the economy’s goods and services, and as you can see from the chart above, people are still shopping – despite domestic and international challenges.
The net result of all these trends is that the economic picture continues to improve and consumers and investors alike are beginning to feel better about themselves. And how could they not? As evidenced by the chart below, household net worth has reached a record level of about $66 trillion dollars, thanks to rallies in the stock market and home process, combined with a renewed conviction of keeping debt in check.
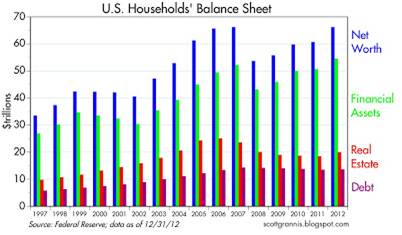
Source: Scott Grannis
Cyprus Side Notes

Over the last month, an avalanche of headlines, relating to the dire financial condition of Cyprus and Cypriot banks, has cascaded across the major media outlets. In analyzing the situation, there were two major questions I wanted answered:
Question #1: What is going on in Cyprus?
As it relates to this tiny island, approximately the size of Puerto Rico (east of Greece and south of Turkey), the first thing I learned is that the Cyprus situation is another example of a country’s financial sector gone wild. By some estimates the size of Cypriot bank deposits were more than 4x’s the size of its GDP. A key driving force behind the oversized banking industry is Russian depositors, who make up about 1/3 of overall Cypriot banking deposits. Cyprus acted as a sort of Cayman Islands in the Mediterranean for these wealthy Russians, who moved billions of dollars to the island after the Soviet Union broke apart in the early 1990s. The main attraction for the Russians were the lax banking laws and generous tax advantages.
In order to clean up this financial mess, the so-called adults or Troika, made up of the European Central Bank (ECB), International Monetary Fund (IMF), and European Commission (EU legislative body), approved a $13 billion bailout for Cyprus on the condition they restructured their main banks (Laiki Bank to be merged into Bank of Cyprus). The end result is that Cyprus (like Greece) chose to take the harsh medicine and stay in the eurozone by combining/closing banks and instituting significant losses on those depositors with more than $130,000 in their accounts (with some depositors expected to lose -60% of their money).
Question #2: Should I care?
The short answer is “No”. With a population of about 850,000 people, Cyprus is home to about the same number of folks who live in Birmingham, Alabama. Moreover, the size of Cyprus’ economy is barely 0.2% of euro-land GDP. Many pessimistic bears acknowledge the infinitesimal size of the Cypriot economy, but position the country as the domino about to topple the rest of Europe, including the much more important countries of Spain and Italy. The fact that private depositors are feeling a larger brunt of the pain rather than public taxpayers is actually a healthy long-term trend that will force more responsible behavior by other European financial institutions outside Cyprus.
In the face of the noisy Cyprus sideshow and endless economic/political worries, our corporate profit machine continues to churn out escalating profits,
as our stock markets set new record highs and our economy gains momentum. Today may be April Fool’s Day, but don’t become bamboozled by silly diversions, this stock market is no joke.
Wade W. Slome, CFA, CFP®
Plan. Invest. Prosper.
DISCLOSURE: Sidoxia Capital Management (SCM) and some of its clients hold positions in certain exchange traded funds (ETFs), but at the time of publishing SCM had no direct position in any security referenced in this article. No information accessed through the Investing Caffeine (IC) website constitutes investment, financial, legal, tax or other advice nor is to be relied on in making an investment or other decision. Please read disclosure language on IC Contact page.
P/E Binoculars, Not Foggy Rearview Mirror

Robert Shiller is best known for his correctly bearish forecasts on the housing market, which we are continually reminded of through the ubiquitous Case-Shiller housing index, and his aptly timed 2000 book entitled Irrational Exuberance. Shiller is also well known for his cyclically adjusted 10-year price-earnings tool, also known as P/E-10. This tool chooses to take a rearview mirror look at the 10-year rolling average of the S&P composite stock index to determine whether the equity market is currently a good or bad buy. Below average multiples are considered to be predictive of higher future returns, and higher than average multiples are considered to produce lower future returns (see scatterplot chart).

Source: http://www.mebanefaber.com (June 2010)
Foggy Mirror
If you were purchasing a home, would the price 10 years ago be a major factor in your purchase decision? Probably not. Call me crazy, but I would be more interested in today’s price and even more interested in the price of the home 10 years into the future. The financial markets factor in forward looking data (not backward looking data). Conventional valuation techniques applied to various assets, take for example a bond, involve the discounting of future cash flow values back to the present – in order to determine the relative attractiveness of today’s asset price. The previous 10-years of data are irrelevant in this calculation.
Although I believe current and future expectations are much more important than stale historical data, I can appreciate the insights that can be drawn by comparing current information with historical averages. In other words, if I was purchasing a house, I would be interested in comparing today’s price to the historical 10-year average price. Currently, the P/E-10 ratio stands at a level around 22x – 38% more expensive than the 16x average value for the previous decade. That same 22x current P/E-10 ratio compares to a current forward P/E ratio of 13x. A big problem is the 22x P/E-10 is not adequately taking into account the dramatic growth in earnings that is taking place (estimated 2010 operating earnings are expected to register in at a whopping +45% growth).

Mean P/E 10 Value is 16.4x Source: http://www.multpl.com
Additional problems with P/E-10:
1) The future 10 years might not be representative of the extreme technology and credit bubble we experienced over the last 10 years. Perhaps excluding the outlier years of 2000 and 2009 would make the ratio more relevant.
2) The current P/E-10 ratio is being anchored down by extreme prices from a narrow sector of technology a decade ago. Value stocks significantly outperformed technology over the last 10 years, much like small cap stocks outperformed in the 1970s when the Nifty Fifty stocks dominated the index and then unraveled.
3) Earnings are rising faster than prices are increasing, so investors waiting for the P/E-10 to come down could be missing out on the opportunity cost of price appreciation. The distorted P/E ratios earlier in the decade virtually guarantee the P/E-10 to drop, absent a current market melt-up, because P/E ratios were so high back then.
4) The tool has been a horrible predictor over very long periods of time. For example, had you followed the tool, the red light would have caused you to miss the massive appreciation in the 1990s, and the green light in the early 1970s would have led to little to no appreciation for close to 10 years.
Shiller himself understands the shortcomings of P/E-10:
“It is also dangerous to assume that historical relations are necessarily applicable to the future. There could be fundamental structural changes occurring now that mean that the past of the stock market is no longer a guide to the future.”
How good an indicator was P/E-10 for the proponent himself at the bottom of the market in February 2009? Shiller said he would get back in the market after another 30% drop in the ratio (click here for video). As we know, shortly thereafter, the market went on a near +70% upwards rampage. I guess Shiller just needs another -55% drop in the ratio from here to invest in the market?
Incidentally, Shiller did not invent the cyclically adjusted P/E tool, as famed value investor Benjamin Graham also used a similar tool. The average investor loves simplicity, but what P/E-10 offers with ease-of-use, it lacks in usefulness. I agree with the P/E-10 intent of smoothing out volatile cycle data (artificially inflated in booms and falsely depressed in recessions), but I recommend investors pull out a pair of binoculars (current and forward P/Es) rather than rely on a foggy rearview mirror.
Wade W. Slome, CFA, CFP®
Plan. Invest. Prosper.
DISCLOSURE: Sidoxia Capital Management (SCM) and some of its clients own certain exchange traded funds, but at the time of publishing SCM had no direct position in any other security referenced in this article. No information accessed through the Investing Caffeine (IC) website constitutes investment, financial, legal, tax or other advice nor is to be relied on in making an investment or other decision. Please read disclosure language on IC “Contact” page.


