Posts tagged ‘bonds’
Wiping Your Financial Slate Clean

This article is an excerpt from a previously released Sidoxia Capital Management complimentary newsletter (January 3, 2017). Subscribe on the right side of the page for the complete text.
The page on the calendar has turned, and we now have a new year, and will shortly have a new president, and new economic policies. Although there is nothing magical about starting a fresh, new year, the annual rites of passage also allow investors to start with a clean slate again and reflect on their personal financial situation. Before you reach a desired destination (i.e., retirement), it is always helpful to know where you have been and where are you currently. Achieving this goal requires filtering through a never-ending avalanche of real-time data flooding through our cell phones, computers, TVs, radios, and Facebook accounts. This may seem like a daunting challenge, but that’s where I come in!
Distinguishing the signals from the noise is tough and there was plenty of noise in 2016 – just like there is every year. Before the S&P 500 stock index registered a +9.5% return in 2016, fears of a China slowdown blanketed headlines last January (the S&P 500 fell -15% from its highs and small cap stocks dropped -26%), and the Brexit (British exit) referendum caused a brief 48-hour -6% hiccup in June. Oil was also in the news as prices hit a low of $26 a barrel early in the year, before more than doubling by year-end to $54 per barrel (still well below the high exceeding $100 in 2014). On the interest rate front, 10-Year Treasury rates bottomed at 1.34% in July, while trillions of dollars in global bonds were incomprehensibly paying negative interest rates. However, fears of inflation rocked bond prices lower (prices move inversely to yields) and pushed bond yields up to 2.45% today. Along these lines, the Federal Reserve has turned the tide on its near-0% interest rate policy as evidenced by its second rate hike in December.
Despite the abbreviated volatility caused by the aforementioned factors, it was the U.S. elections and surprise victory of President-elect Donald Trump that dominated the media airwaves for most of 2016, and is likely to continue as we enter 2017. In hindsight, the amazing Twitter-led, Trump triumph was confirmation of the sweeping global populism trend that has also replaced establishment leaders in the U.K., France, and Italy. There are many explanations for the pervasive rise in populism, but meager global economic growth, globalization, and automation via technology are all contributing factors.
The Trump Bump
Even though Trump has yet to accept the oath of Commander-in-Chief, recent investor optimism has been fueled by expectations of a Republican president passing numerous pro-growth policies and legislation through a Republican majority-controlled Congress. Here are some of the expected changes:
- Corporate/individual tax cuts and reform
- Healthcare reform (i.e., Obamacare)
- Proposed $1 trillion in infrastructure spending
- Repatriation tax holiday for multinational corporate profits
- Regulatory relief (e.g., Dodd-Frank banking and EPA environmental reform)
The chart below summarizes the major events of 2016, including the year-end “Trump Bump”:

While I too remain optimistic, I understand there is no free lunch as it relates to financial markets (see also Half Trump Full). While tax cuts, infrastructure spending, and regulatory relief should positively contribute to economic growth, these benefits will have to be weighed against the likely costs of higher inflation, debt, and deficits.
Over the 25+ years I have been investing, the nature of the stock market and economy hasn’t changed. The emotions of fear and greed rule the day just as much today as they did a century ago. What has changed today is the pace, quality, and sheer volume of news. In the end, my experience has taught me that 99% of what you read, see or hear at the office is irrelevant as it relates to your retirement and investments. What ultimately drives asset prices higher or lower are the four key factors of corporate profits, interest rates, valuations, and sentiment (contrarian indicator) . As you can see from the chart below, corporate profits are at record levels and forecast to accelerate in 2017 (up +11.9%). In addition, valuations remain very reasonable, given how low interest rates are (albeit less low), and skeptical investor sentiment augurs well in the short-run.

Source: FactSet
Regardless of your economic or political views, this year is bound to have plenty of ups and downs, as is always the case. With a clean slate and fresh turn to the calendar, now is a perfect time to organize your finances and position yourself for a better retirement and 2017.

Wade W. Slome, CFA, CFP®
DISCLOSURE: Sidoxia Capital Management (SCM) and some of its clients hold positions in FB and certain exchange traded funds (ETFs), but at the time of publishing had no direct position in TWTR or any other security referenced in this article. No information accessed through the Investing Caffeine (IC) website constitutes investment, financial, legal, tax or other advice nor is to be relied on in making an investment or other decision. Please read disclosure language on IC Contact page.
Half Trump Empty, or Half Trump Full?

This article is an excerpt from a previously released Sidoxia Capital Management complimentary newsletter (December 1, 2016). Subscribe on the right side of the page for the complete text.
It was a bitter U.S. presidential election, but fortunately, the nastiest election mudslinging has come to an end…at least until the next political contest. Unfortunately, like most elections, even after the president-elect has been selected, almost half the country remains divided and the challenges facing the president-elect have not disappeared.
While some non-Trump voters have looked at the glass as half empty, since the national elections, the stock market glass has been overflowing to new record highs. Similar to the unforeseen British Brexit outcome in which virtually all pollsters and pundits got the results wrong, U.S. experts and investors also initially took a brief half-glass full view of the populist victory of Donald Trump. More specifically, for a few hours on Election Day, stock values tied to the Dow Jones Industrial Average index collapsed by approximately -5%.
It didn’t take long for stock prices to quickly reverse course, and when all was said and done, the Dow Jones Industrial Average finished the month higher by almost +1,000 points (+5.4%) to finish at 19,124 – a new all-time record high (see chart below). Worth noting, stocks have registered a very respectable +10% return during 2016, and the year still isn’t over.
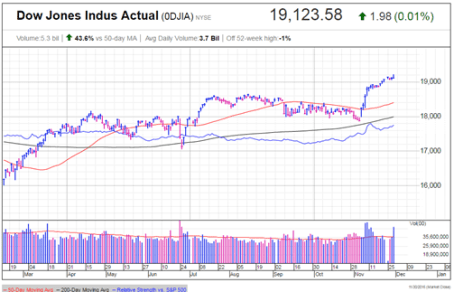
Source: Investors.com (IBD)
Drinking the Trump Egg Nog
Why are investors so cheery? The proof will be in the pudding, but current optimism is stemming from a fairly broad list of anticipated pro-growth policies.
At the heart of the reform is the largest expected tax reform since Ronald Reagan’s landmark legislation three decades ago. Not only is Trump proposing stimulative tax cuts for corporations, but also individual tax reductions targeted at low-to-middle income taxpayers. Other facets of the tax plan include simplification of the tax code; removal of tax loopholes; and repatriation of foreign cash parked abroad. Combined, these measures are designed to increase profits, wages, investment spending, productivity, and jobs.
On the regulatory front, the President-elect has promised to repeal the Obamacare healthcare system and also overhaul the Dodd-Frank financial legislation. These initiatives, along with talk of dialing back other regulatory burdensome laws and agencies have many onlookers hopeful such policies could aid economic growth.
Fueling further optimism is the prospect of a trillion dollar infrastructure spending program created to fix our crumbling roads and bridges, while simultaneously increasing jobs.
No Free Lunch
As is the case with any economic plan, there is never a free lunch. Every cost has a benefit, and every benefit has a cost. The cost of the 2008-2009 Financial crisis is reflected in the sluggish economic growth seen in the weak GDP (Gross Domestic Product) statistics, which have averaged a modest +1.6% growth rate over the last year. Scott Grannis points out how the slowest recovery since World War II has resulted in a $3 trillion economic gap (see chart below).
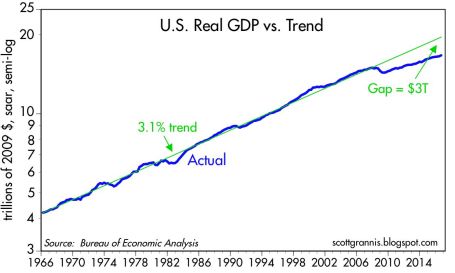
Source: Calafia Beach Pundit
The silver lining benefit to weak growth has been tame inflation and the lowest interest rate levels experienced in a generation. Notwithstanding the recent rate rise, this low rate phenomenon has spurred borrowing, and improved housing affordability. The sub-par inflation trends have also better preserved the spending power of American consumers on fixed incomes.
If executed properly, the benefits of pro-growth policies are obvious. Lower taxes should mean more money in the pockets of individuals and businesses to spend and invest on the economy. This in turn should create more jobs and growth. Regulatory reform and infrastructure spending should have similarly positive effects. However, there are some potential downside costs to the benefits of faster growth, including the following:
- Higher interest rates
- Rising inflation
- Stronger dollar
- Greater amount of debt
- Larger deficits (see chart below)
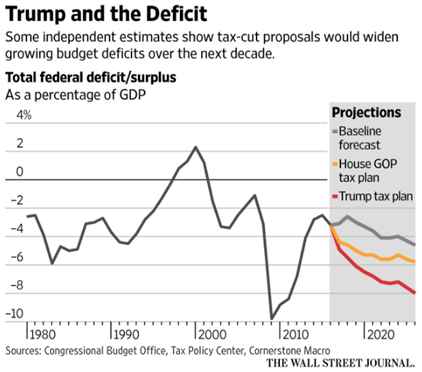
Source: The Wall Street Journal
Even though President-elect Trump has not even stepped foot into the Oval Office yet, signs are already emerging that we could face some or all of the previously mentioned headwinds. For example, just since the election, the yield on 10-Year Treasury Notes have spiked +0.5% to 2.37%, and 30-Year Fixed Rate mortgages are flirting with 4.0%. Social and economic issues relating to immigration legislation and Supreme Court nominations are likely to raise additional uncertainties in the coming months and years.
Attempting to anticipate and forecast pending changes makes perfect sense, but before you turn your whole investment portfolio upside down, it’s important to realize that actions speak louder than words. Even though Republicans have control over the three branches of government (Executive, Legislative, Judicial), the amount of control is narrow (i.e., the Senate), and the nature of control is splintered. In other words, Trump will still have to institute the “art of the deal” to persuade all factions of the Republicans (including establishment, Tea-Party, and rural) and Democrats to follow along and pass his pro-growth policies.
Although I do not agree with all of Trump’s policies, including his rhetoric on trade (see Free Trade Boogeyman), I will continue paying closer attention to his current actions rather than his past words. Until proven otherwise, I will keep on my rose colored glasses and remain optimistic that the Trump glass is half full, not half empty.
Wade W. Slome, CFA, CFP®
Plan. Invest. Prosper.
DISCLOSURE: Sidoxia Capital Management (SCM) and some of its clients hold positions in certain exchange traded funds (ETFs), but at the time of publishing had no direct position in any other security referenced in this article. No information accessed through the Investing Caffeine (IC) website constitutes investment, financial, legal, tax or other advice nor is to be relied on in making an investment or other decision. Please read disclosure language on IC Contact page.
Sleeping and Napping Through Bubbles

We have lived through many investment bubbles in our history, and unfortunately, most investors sleep through the early wealth-creating inflation stages. Typically, the average investor wakes up later to a hot idea once every man, woman, and child have identified the clear trend…right as the bubble is about burst. Sadly, the masses do a great job of identifying financial bubbles at the end of a cycle, but have a tougher time realizing the catastrophic consequences of exiting a tired winner. Or as strategist Jim Stack states, “Bubbles, for the most part, are invisible to those trapped inside the bubble.” The challenge of recognizing bubbles explains why they are more easily classified as bubbles after a colossal collapse occurs. For those speculators chasing a precise exit point on a bubblicious investment, they may be better served by waiting for the prick of the bubble, then take a decade long nap before revisiting the fallen angel investment idea.
Even for the minority of pundits and investors who are able to accurately identify these financial bubbles in advance, a much smaller number of these professionals are actually able to pinpoint when the bubble will burst. Take for example Alan Greenspan, the ex-Federal Reserve Chairman from 1987 to 2006. He managed to correctly identify the technology bubble in late-1996 when he delivered his infamous “irrational exuberance” speech, which questioned the high valuation of the frothy, tech-driven stock market. The only problem with Greenspan’s speech was his timing was massively off. Stated differently, Greenspan was three years premature in calling out the pricking of the bubble, as the NASDAQ index subsequently proceeded to more than triple from early 1997 to early 2000 (the index exploded from about 1,300 to over 5,000).
One of the reasons bubbles are so difficult to time during their later stages is because the deflation period occurs so quickly. As renowned value investor Howard Marks fittingly notes, “The air always goes out a lot faster than it went in.”
Bubbles, Bubbles, Everywhere
Financial bubbles do not occur every day, but thanks to the psychological forces of investor greed and fear, bubbles do occur more often than one might think. As a matter of fact, famed investor Jeremy Grantham claims to have identified 28 bubbles in various global markets since 1920. Definitions vary, but Webster’s Dictionary defines a financial bubble as the following:
A state of booming economic activity (as in a stock market) that often ends in a sudden collapse.
Although there is no numerical definition of what defines a bubble or collapse, the financial crisis of 2008 – 2009, which was fueled by a housing and real estate bubble, is the freshest example in most people minds. However, bubbles go back much further in time – here are a few memorable ones:
Dutch Tulip-Mania: Fear and greed have been ubiquitous since the dawn of mankind, and those emotions even translate over to the buying and selling of tulips. Believe it or not, some 400 years ago in the 1630s, individual Dutch tulip bulbs were selling for the same prices as homes ($61,700 on an inflation-adjusted basis). This bubble ended like all bubbles, as you can see from the chart below.

Source: The Stock Market Crash.net
British Railroad Mania: In the mid-1840s, hundreds of companies applied to build railways in Britain. Like all bubbles, speculators entered the arena, and the majority of companies went under or got gobbled up by larger railway companies.
Roaring 20s: Here in the U.S., the Roaring 1920s eventually led to the great Wall Street Crash of 1929, which finally led to a nearly -90% plunge in the Dow Jones Industrial stock index over a relatively short timeframe. Leverage and speculation were contributors to this bust, which resulted in the Great Depression.
Nifty Fifty: The so-called Nifty Fifty stocks were a concentrated set of glamor stocks or “Blue Chips” that investors and traders piled into. The group of stocks included household names like Avon (AVP), McDonald’s (MCD), Polaroid, Xerox (XRX), IBM and Disney (DIS). At the time, the Nifty Fifty were considered “one-decision” stocks that investors could buy and hold forever. Regrettably, numerous of these hefty priced stocks (many above a 50 P/E) came crashing down about 90% during the 1973-74 period.
Japan’s Nikkei: The Japanese Nikkei 225 index traded at an eye popping Price-Earnings (P/E) ratio of about 60x right before the eventual collapse. The value of the Nikkei index increased over 450% in the eight years leading up to the peak in 1989 (from 6,850 in October 1982 to a peak of 38,957 in December 1989).

Source: Thechartstore.com
The Tech Bubble: We all know how the technology bubble of the late 1990s ended, and it wasn’t pretty. PE ratios above 100 for tech stocks was the norm (see table below), as compared to an overall PE of the S&P 500 index today of about 14x.

Source: Wall Street Journal – March 14, 2000
The Next Bubble
What is/are the next investment bubble(s)? Nobody knows for sure, but readers of Investing Caffeine know that long-term bonds are one fertile area. Given the generational low in yields and rates, and the 35-year bull run in bond prices, it can be difficult to justify heavy allocations of inflation losing bonds for long time-horizon investors. Commercial real estate and Silicon Valley unicorns could be other potential over-heated areas. However, as we discussed earlier, identifying and timing bubble bursts is extremely challenging. Nevertheless, the great thing about long-term investing is that probabilities and valuations ultimately do matter, and therefore a diversified portfolio skewed away from extreme valuations and speculative sectors will pay handsome dividends over the long-run.
Many traders continue to daydream as they chase performance through speculative investment bubbles, looking to squeeze the last ounce of an easily identifiable trend. As the lead investment manager at Sidoxia Capital Management, I spend less time sucking the last puff out of a cigarette, and spend more time opportunistically devoting resources to valuation-sensitive growth trends. As demonstrated with historical examples, following the popular trend du jour eventually leads to financial ruin and nightmares. Avoiding bubbles and pursuing fairly priced growth prospects is the way to achieve investment prosperity…and provide sweet dreams.
Wade W. Slome, CFA, CFP®
Plan. Invest. Prosper.
DISCLOSURE: Sidoxia Capital Management (SCM) and some of its clients hold positions in certain exchange traded funds (ETFs), MCD, DIS and are short TLT, but at the time of publishing SCM had no direct positions in AVP, XRX, IBM,or any other security referenced in this article. No information accessed through the Investing Caffeine (IC) website constitutes investment, financial, legal, tax or other advice nor is to be relied on in making an investment or other decision. Please read disclosure language on IC Contact page.
Going Shopping: Chicken vs. Beef

The headlines haven’t been very rosy over the last week, but when is that ever not the case? Simply put, gloom and doom sells. The Chinese stock market is collapsing; the Yuan is plummeting; there are rising tensions in the Middle East; terrorism is rising to the fore; and commodity prices are falling apart at the seams. This is only a partial snapshot of course, and does not paint a complete or accurate picture. Near record-low interest rates; record corporate profits (outside of energy); record-low oil prices; unprecedented accommodative central bank policies; and attractive valuations are but a few of the positive, countervailing factors that rarely surface through the media outlets.
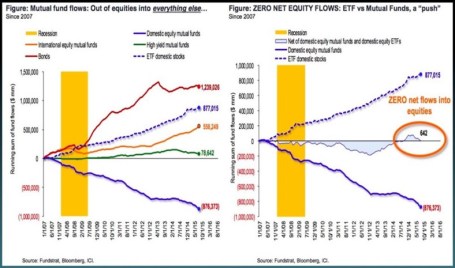
At the end of the day, smart long-term investors understand investing in financial markets is a lot like grocery store shopping. Similarly to stocks and bonds, prices at the supermarket fluctuate daily. Whether you’re comparing beef (bonds) and chicken (stocks) prices in the meat department (stock market), or apple (real estate) and orange (commodities) prices in the produce department (global financial markets), ultimately, shrewd shoppers eventually migrate towards purchasing the best values. Since the onset of the 2008-2009 financial crisis, risk aversion has dominated over value-based prudence as evidenced by investors flocking towards the perceived safety of cash, Treasury bonds, and other fixed income securities that are expensively priced near record highs. As you can see from the chart below, investors poured $1.2 trillion into bonds and effectively $0 into stocks. Consumers may still be eating lots of steaks (bonds) currently priced at $6.08/lb while chicken (stocks) is at $1.48/lb (see U.S. Department of Labor Data – Nov. 2015), but at some point, risk aversion will abate, and consumers will adjust their preferences towards the bargain product.
Some Shoppers Still Buying Chicken
While the general public may have missed the massive bull market in stocks, astute corporate executives and investment managers took advantage of the equity bargains in recent years, as seen by stock prices tripling from the March 2009 lows. As corporate profits and margins have marched to record levels, CEOs/CFOs put their money where their mouths are by investing trillions of dollars into share buybacks and mergers & acquisitions transactions.
Despite the advance in the multi-year bull market, with the recent sell-off, panic has once again dominated rational thinking. We see this rare phenomenon (a few times over the last century) manifest itself through a stock market dividend yield that exceeds the yield on Treasury bonds (2.2% S&P 500 vs 2.1% 10-Year Treasury). But if we are once again comparing beef vs. chicken prices (bonds vs stocks), the 6% earnings yield on stocks (i.e., Inverse P/E ratio or E/P) now looks even more compelling relative to the 2% yield on bonds. For example, the iShares Core U.S. Aggregate Bond ETF (AGG) is currently yielding a meager 2.3%.
For a general overview, Scott Grannis at Calafia Beach Pundit summarizes the grocery store flyer of investment options below:
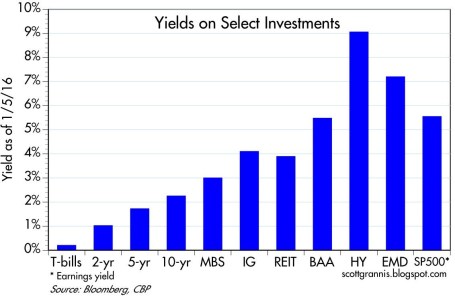
While these yield relationships can and will certainly change under various economic scenarios, there are no concrete signs of an impending recession. The recent employment data of 292,000 new jobs added during December (above the 200,000 estimate) is verification that the economy is not falling off a cliff into recession (see chart below). As I’ve written in the past, the positively-sloped yield curve also bolsters the case for an expansionary economy.

Source: Calafia Beach Pundit
While it’s true the Chinese economy is slowing, its rate is still growing at multiples of the U.S. economy. As a communist country liberalizes currency and stock market capital controls (i.e., adds/removes circuit breakers), and also attempts to migrate the economy from export-driven growth to consumer-driven expansion, periodic bumps and bruises should surprise nobody. With that said, China’s economy is slowly moving in the right direction and the government will continue to implement policies and programs to stimulate growth (see China Leaders Flag More Stimulus).
As we have recently experienced another China-driven correction in the stock market, and the U.S. economic expansion matures, equity investors must realize volatility is the price of admission for earning higher long-term returns. However, rather than panicking from fear-driven headlines, it’s times like these that should remind you to sharpen your shopping list pencil. You want to prudently allocate your investment dollars when deciding whether now’s the time to buy chicken (6% yield) or beef (2% yield).
Wade W. Slome, CFA, CFP®
Plan. Invest. Prosper.
DISCLOSURE: Sidoxia Capital Management (SCM) and some of its clients hold positions in certain exchange traded funds (ETFs) including AGG, but at the time of publishing had no direct position in any other security referenced in this article. No information accessed through the Investing Caffeine (IC) website constitutes investment, financial, legal, tax or other advice nor is to be relied on in making an investment or other decision. Please read disclosure language on IC Contact page.
Bargain Hunting for Doorbuster Discounts

This article is an excerpt from a previously released Sidoxia Capital Management complimentary newsletter (December 1, 2015). Subscribe on the right side of the page for the complete text.
It’s that time of year again when an estimated 135 million bargain shoppers set aside personal dignity and topple innocent children in the name of Black Friday holiday weekend, doorbuster discounts. Whether you are buying a new big screen television at Amazon for half-off or a new low-cost index fund, everyone appreciates a good value or bargain, which amplifies the importance of the price you pay. Even though consumers are estimated to have spent $83 billion over the post-turkey-coma, holiday weekend, this spending splurge only represents a fraction of the total 2015 holiday shopping season frenzy. When all is said and done, the average person is projected to dole out $805 for the full holiday shopping season (see chart below) – just slightly higher than the $802 spent over the same period last year.

While consumers have displayed guarded optimism in their spending plans, Americans have demonstrated the same cautiousness in their investing behavior, as evidenced by the muted 2015 stock market gains. More specifically, for the month of November, stock prices increased by +0.32% for the Dow Jones Industrial Average (17,720) and +0.05% for the S&P 500 index (2,080). For the first 11 months of the year, the stock market results do not look much different. The Dow has barely slipped by -0.58% and the S&P 500 has inched up by +1.01%.
Given all the negative headlines and geopolitical concerns swirling around, how have stock prices managed to stay afloat? In the face of significant uncertainty, here are some of the calming factors that have supported the U.S. financial markets:
- Jobs Piling Up: The slowly-but-surely expanding economy has created about 13 million new jobs since late 2009 and the unemployment rate has been chopped in half (from a peak of 10% to 5%).

Source: Calafia Beach Pundit
- Housing Recovery: New and existing home sales are recovering and home prices are approaching previous record levels, as the Case-Shiller price indices indicate below.

Source: Calculated Risk Blog
- Strong Consumer: Cars are flying off the shelves at a record annualized pace of 18 million units – a level not seen since 2000. Lower oil and gasoline prices have freed up cash for consumers to pay down debt and load up on durable goods, like some fresh new wheels.

Source: Calculated Risk Blog
Despite a number of positive factors supporting stock prices near all-time record highs and providing plenty of attractive opportunities, there are plenty of risks to consider. If you watch the alarming nightly news stories on TV or read the scary newspaper headlines, you’re more likely to think it’s Halloween season rather than Christmas season.
At the center of the recent angst are the recent coordinated terrorist attacks that took place in Paris, killing some 130 people. With ISIS (Islamic State of Iraq and Syria) claiming responsibility for the horrific acts, political and military resources have been concentrated on the ISIS occupied territories of Syria and Iraq. Although I do not want to diminish the effects of the appalling and destructive attacks in Paris, the events should be placed in proper context. This is not the first or last large terrorist attack – terrorism is here to stay. As I show in the chart below, there have been more than 200 terrorist attacks that have killed more than 10 people since the 9/11 attacks. Much of the Western military power has turned a blind eye towards these post-9/11 attacks because many of them have taken place off of U.S. or Western country soil. With the recent downing of the Russian airliner (killing all 224 passengers), coupled with the Paris terror attacks, ISIS has gained the full military attention of the French, Americans, and Russians. As a result, political willpower is gaining momentum to heighten military involvement.

Source: Wikipedia
Investor anxiety isn’t solely focused outside our borders. The never ending saga of when the Federal Reserve will initiate its first Federal Funds interest rate target increase could finally be coming to an end. According to the CME futures market, there currently is a 78% probability of a 0.25% interest rate increase on December 16th. As I have said many times before, interest rates are currently near generational lows, and the widely communicated position of Federal Reserve Chairwoman Yellen (i.e., shallow slope of future interest rate hike trajectory) means much of the initial rate increase pain has likely been anticipated already by market participants. After all, a shift in your credit card interest rate from 19.00% to 19.25% or an adjustment to your mortgage rate from 3.90% to 4.15% is unlikely to have a major effect on consumer spending. In fact, the initial rate hike may be considered a vote of confidence by Yellen to the sustainability of the current economic expansion.
Shopping Without My Rose Colored Glasses
Regardless of the state of the economic environment, proper investing should be instituted through an unemotional decision-making process, just as going shopping should be an unemotional endeavor. Price and value should be the key criteria used when buying a specific investment or holiday gift. Unfortunately for many, emotions such as greed, fear, impatience, and instant gratification overwhelm objective measurements such as price and value.
As I have noted on many occasions, over the long-run, money unemotionally moves to where it is treated best. From a long-term perspective, that has meant more capital has migrated to democratic and capitalistic countries with a strong rule of law. Closed, autocratic societies operating under corrupt regimes have been the big economic losers.
With all of that set aside, the last six years have created tremendous investment opportunities due to the extreme investor risk aversion created by the financial crisis – hence the more than tripling in U.S. stock prices since March 2009.
When comparing the yield (i.e., profit earned on an investment) between stocks and bonds, as shown in the chart below, you can see that stock investors are being treated significantly better than bond investors (6.1% vs. 4.0%). Not only are bond investors receiving a lower yield than stock investors, but bond investors also have no hope of achieving higher payouts in the future. Stocks, on the other hand, earn the opportunity of a double positive whammy. Not only are stocks currently receiving a higher yield, but stockholders could achieve a significantly higher yield in the future. For example, if S&P 500 earnings can grow at their historic rate of about 7%, then the current stock earnings yield of 6.1% would about double to 12.0% over the next decade at current prices. The inflated price and relative attractiveness of stocks looks that much better if you compare the 6.1% earnings yield to the paltry 2.2% 10-Year Treasury yield.

Source: Yardeni.com
This analysis doesn’t mean everyone should pile 100% of their portfolios into stocks, but it does show how expensively nervous investors are valuing bonds. Time horizon, risk tolerance, and diversification should always be pillars to a disciplined, systematic investment strategy, but as long as these disparities remain between the earnings yields on stocks and bonds, long-term investors should be able to shop for plenty of doorbuster discount bargain opportunities.
Wade W. Slome, CFA, CFP®
Plan. Invest. Prosper.
DISCLOSURE: Sidoxia Capital Management (SCM) and some of its clients hold positions in AMZN and certain exchange traded funds (ETFs), but at the time of publishing had no direct position in any other security referenced in this article. No information accessed through the Investing Caffeine (IC) website constitutes investment, financial, legal, tax or other advice nor is to be relied on in making an investment or other decision. Please read disclosure language on IC Contact page.
Supply & Demand: The Key to Oil, Stocks, and Pork Bellies

Commodity prices, including oil, are “crashing” according to the pundits and fears are building that this is a precursor to another stock market collapse. Are we on an irreversible path of repeating the bloodbath carnage of the 2008-2009 Great Recession?
Fortunately for investors, markets move in cycles and the fundamental laws of supply and demand hold true in both bull and bear markets, across all financial markets. Whether we are talking about stocks, bonds, copper, gold, currencies, or pork bellies, markets persistently move like a pendulum through periods of excess supply and demand. In other words, weakness in prices create stronger demand and less supply, whereas strength in prices creates weakening demand and more supply.
Since energy makes the world go round and the vast majority of drivers are accustomed to filling up their gas tanks, the average consumer is familiar with recent negative price developments in the crude oil markets. Eighteenth-century economist Adam Smith would be proud that the laws of supply and demand have help up just as well today as they did when he wrote Wealth of Nations in 1776.
It is true that overall stagnation in global economic demand in recent years, along with the strengthening of the U.S. dollar (because of better relative growth), has contributed to downward trending oil prices. It is also true that supply factors, such as Saudi Arabia’s insistence to maintain production and the boom in U.S. oil production due to new fracking technologies (see chart below), have arguably had a larger negative impact on the more than -50% deterioration in oil prices. Fears of additional Iranian oil supply hitting the global oil markets as a result of the Iranian nuclear deal have also added to the downward pressure on prices.
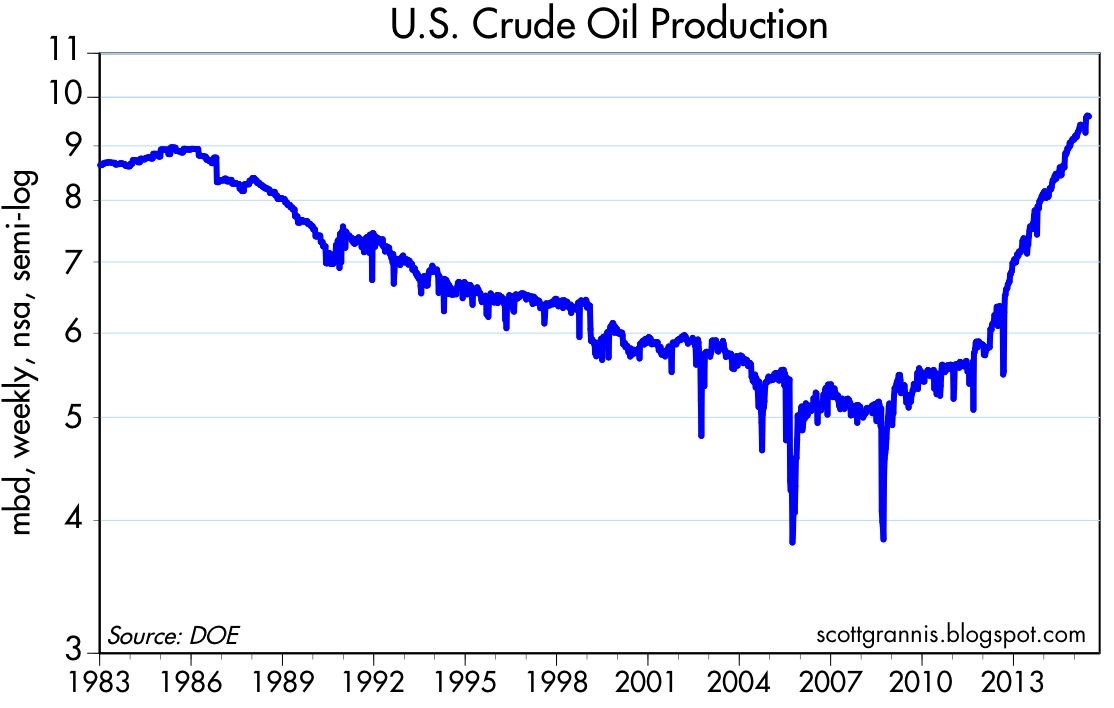
Source: Scott Grannis
What is bad for oil prices and the oil producers is good news for the rest of the economy. Transportation is the lubricant of the global economy, and therefore lower oil prices will act as a stimulant for large swaths of the global marketplace. Here in the U.S., consumer savings from lower energy prices have largely been used to pay down debt (deleverage), but eventually, the longer oil prices remain depressed, incremental savings should filter into our economy through increased consumer spending.
But prices are likely not going to stay low forever because producers are responding drastically to the price declines. All one needs to do is look at the radical falloff in the oil producer rig count (see chart below). As you can see, the rig count has fallen by more than -50% within a six month period, meaning at some point, the decline in global production will eventually provide a floor to prices and ultimately provide a tailwind.
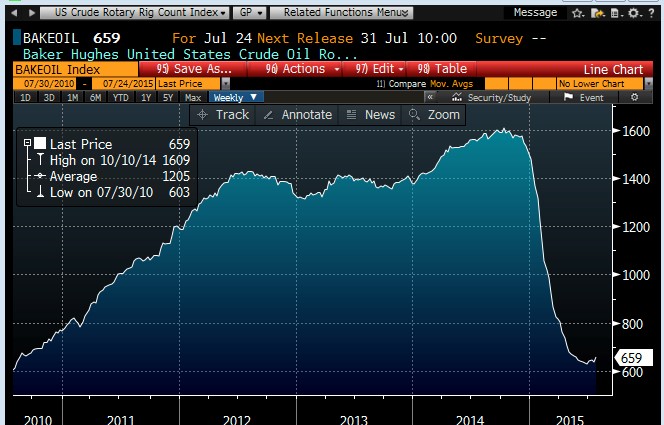
Source: Scott Grannis
If we broaden our perspective beyond just oil, and look at the broader commodity complex, we can see that the recent decline in commodity prices has been painful, but nowhere near the Armageddon scenario experienced during 2008-2009 (see chart below – gray areas = recessions).
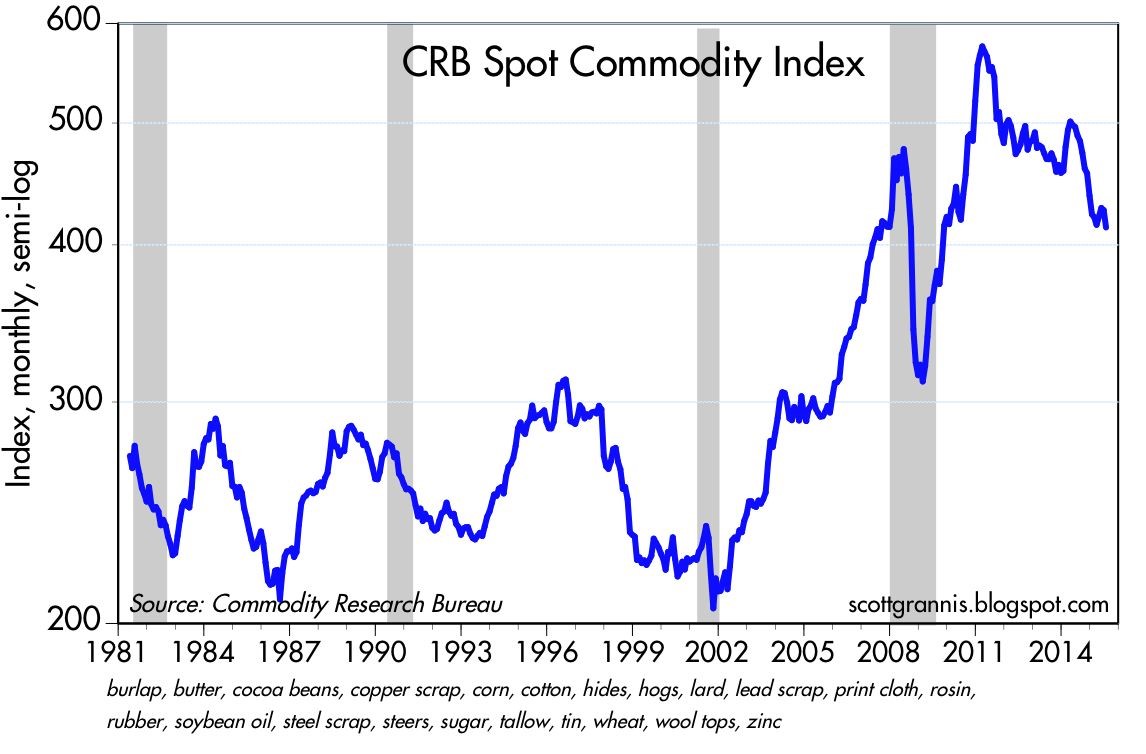
Source: Scott Grannis
Although this conversation has focused on commodities, the same supply-demand principles apply to the stock market as well. Stock market prices as measured by the S&P 500 index have remained near record levels, but as I have written in the past, the records cannot be attributed to the lackluster demand from retail investors (see ICI fund flow data).
Although U.S. stock fundamentals remain relatively strong (e.g., earnings, interest rates, valuations, psychology), much of the strength can be explained by the constrained supply of stocks. How has stock supply been constrained? Some key factors include the trillions in dollars of supply soaked up by record M&A activity (mergers and acquisition) and share buybacks.
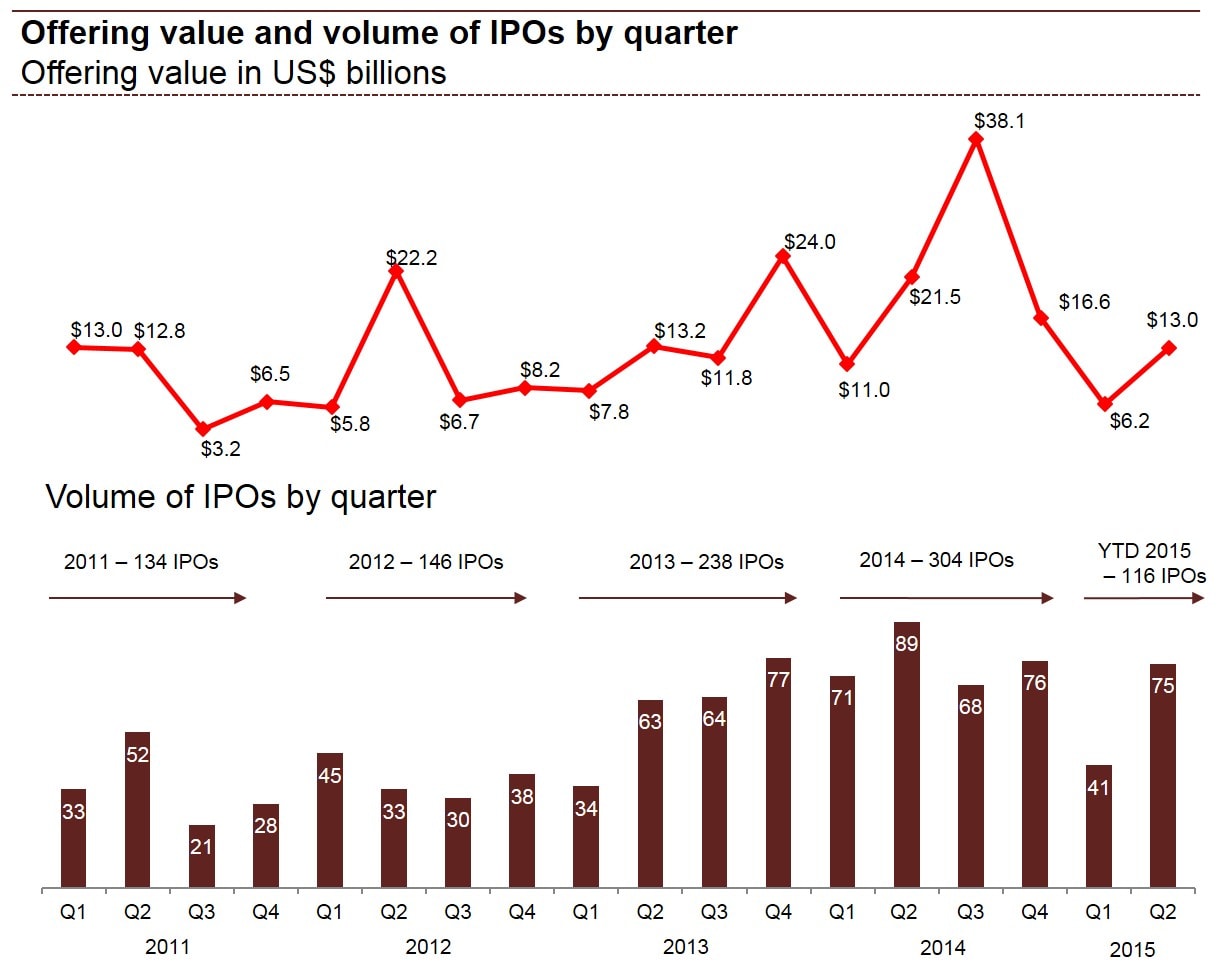
In addition to the declining stock supply from M&A and share buybacks, there has been limited supply of new IPO issues (initial public offerings) coming to market, as evidenced by the declines in IPO dollar and unit volumes in the first half of 2015, as compared to last year. More specifically, first half IPO dollar volmes were down -41% to $19.2 billion and the number of 2015 IPOs has declined -27% to 116 from 160 for the same time period.
Price cycles vary dramatically in price and duration across all financial markets, including stocks, bonds, oil, interest rates, currencies, gold, and pork bellies, among others. Not even the smartest individual or most powerful computer on the planet can consistently time the short-term shifts in financial markets, but using the powerful economic laws of supply and demand can help you profitably make adjustments to your investment portfolio(s).

See Also – The Lesson of a Lifetime (Investing Caffeine)
Wade W. Slome, CFA, CFP®
Plan. Invest. Prosper.
DISCLOSURE: Sidoxia Capital Management (SCM) and some of its clients hold positions in certain exchange traded funds (ETFs), but at the time of publishing, SCM had no direct position in any other security referenced in this article. No information accessed through the Investing Caffeine (IC) website constitutes investment, financial, legal, tax or other advice nor is to be relied on in making an investment or other decision. Please read disclosure language on IC Contact page.
The Bunny Rabbit Market

This article is an excerpt from a previously released Sidoxia Capital Management complementary newsletter (April 1, 2015). Subscribe on the right side of the page for the complete text.
With spring now upon us, we can see the impact the Easter Bunny has had on financial markets…a lot of bouncing around. More specifically, stocks spent about 50% of the first quarter in negative territory, and 50% in positive territory. With interest rates gyrating around the 2% level for the benchmark 10-Year Treasury Note for most of 2015, the picture looked much the same. When all was said and done, after the first three months of the year, stocks as measured by the S&P 500 finished +0.4% and bonds closed up a similarly modest amount of +1.2%, as measured by the Total Bond Market ETF (BND).
Why all the volatility? The reasons are numerous, but guesswork of when the Federal Reserve will reverse course on its monetary policy and begin raising interest rates has been (and remains) a dark cloud over investment strategies for many short-term traders and speculators. In order to provide some historical perspective, the last time the Federal Reserve increased interest rates (Federal Funds rate) was almost nine years ago in June 2006. It’s important to remember, as this bull market enters its 7th consecutive year of its advance, there has been no shortage of useless, negative news headlines to keep investors guessing (see also a Series of Unfortunate Events). Over this period, ranging concerns have covered everything from “Flash Crashes” to “Arab Springs,” and “Ukraine” to “Ebola”.
Last month, the headline pessimism persisted. In the Middle East we witnessed a contentious re-election of Israeli Prime Minister Benjamin Netanyahu; Saudi Arabia led airstrikes against Iranian-backed, Shi’ite Muslim rebels (Houthis) in Yemen; controversial Iranian nuclear deal talks; and President Barack Obama directed airstrikes against ISIS fighters in the Iraqi city of Tikrit, while he simultaneously announced the slowing pace of troop withdrawals from Afghanistan.
Meanwhile in the global financial markets, investors and corporations continue to assess capital allocation decisions in light of generationally low interest rates, and a U.S. dollar that has appreciated in value by approximately +25% over the last year. In this low global growth and ultra-low interest rate environment (-0.12% on long-term Swiss bonds and 1.93% for U.S. bonds), what are corporations choosing to do with their trillions of dollars in cash? A picture is worth a thousand words, and in the case of companies in the S&P 500 club, share buybacks and dividends have been worth more than $900,000,000,000.00 over the last 12 months (see chart below).

Source: Financial Times
Case in point, Apple Inc (AAPL) has been the poster child for how companies are opportunistically boosting stock prices and profitability metrics (EPS – Earnings Per Share) by borrowing cheaply and returning cash to shareholders via stock buybacks and dividend payments. More specifically, even though Apple has been flooded with cash (about $178 billion currently in the bank), Apple decided to accept $1.35 billion in additional money from bond investors by issuing bonds in Switzerland. The cost to Apple was almost free – the majority of the money will be paid back at a mere rate of 0.28% until November 2024. What is Apple doing with all this extra cash? You guessed it…buying back $45 billion in stock and paying $11 billion in dividends, annually. No wonder the stock has sprung +62% over the last year. Apple may be a unique company, but corporate America is following their shareholder friendly buyback/dividend practices as evidenced by the chart below. By the way, don’t be surprised to hear about an increased dividend and share buyback plan from Apple this month.

Source: Investors Business Daily
Despite all the turmoil and negative headlines last month, the technology-heavy NASDAQ Composite index managed to temporarily cross the psychologically, all-important 5,000 threshold for the first time since the infamous tech-bubble burst in the year 2000, more than 15 years ago. The Dow Jones Industrial also cracked a numerically round threshold (18,000) last month, before settling down at 17,779 at month’s end.
While the S&P 500 and NASDAQ indexes have posted their impressive 9th consecutive quarter of gains, I don’t place a lot of faith in dubious, calendar-driven historical trends. With that said, as I eat jelly beans and hunt for Easter eggs this weekend, I will take some solace in knowing April has historically been the most positive month of the year as it relates to direction of stock prices (see chart below). Over the last 20 years, stocks have almost averaged a gain of +3% over this 30-day period. Perhaps investors are just in a better mood after paying their taxes?
Source: Bespoke
Even though April has historically been an outperforming month, banker and economist Robert Rubin stated it best, “Nothing is certain – except uncertainty.” We’ve had a bouncing “Bunny Market” so far in 2015, and chances are this pattern will persist. Rather than fret whether the Fed will raise interest rates 0.25% or agonize over a potential Greek exit (“Grexit”) from the EU, you would be better served by constructing an investment and savings plan to meet your long-term financial goals. That’s an eggstra-special idea that even the Easter Bunny would want to place in the basket.
Wade W. Slome, CFA, CFP®
Plan. Invest. Prosper.
DISCLOSURE: Sidoxia Capital Management (SCM) and some of its clients hold positions in certain exchange traded funds (ETFs) including BND and AAPL (stock), but at the time of publishing, SCM had no direct position in any other security referenced in this article. No information accessed through the Investing Caffeine (IC) website constitutes investment, financial, legal, tax or other advice nor is to be relied on in making an investment or other decision. Please read disclosure language on IC Contact page.
March Madness – Dividend Grandness & Volatility Blandness

March Madness has arrived once again. This NCAA basketball event, which has been around since 1939, begins with a selection committee choosing the top 68 teams in the country. These teams are matched up against each other through a single-elimination tournament until a national champion is throned. The stock market does not have a selection committee that picks teams from conferences like the SEC, Big East, Pac-12, and ACC, but rather millions of investors select the best investments from asset classes like stocks, bonds, real estate, commodities, venture capital, and private equity.
In the investment world, there are no win-loss records, but rather there are risk-return profiles. Investors generally migrate towards the asset classes where they find the optimal trade-off between risk and return. Speculators, day-traders, and momentum traders may define risk differently, but regardless, over the long-run, capital goes where it is treated best. And over the last six years, the U.S. stock market hasn’t been a bad place to be (the S&P 500 has about tripled).
Why such outperformance in stocks? Besides a dynamic earnings recovery from the 2008-2009 financial crisis, another major factor has been the near-0% interest rate environment. When investors are earning near nothing in their bank and savings accounts, it is perfectly rational for savers to look for riskier options, if they are compensated for that risk. In addition to loose central bank and quantitative easing policies fueling demand for stocks, rising dividends have increased the attractiveness of the stock market. In fact, as you can see from the chart below, dividends have about doubled from 2008-2009 and about tripled from the year 2000.
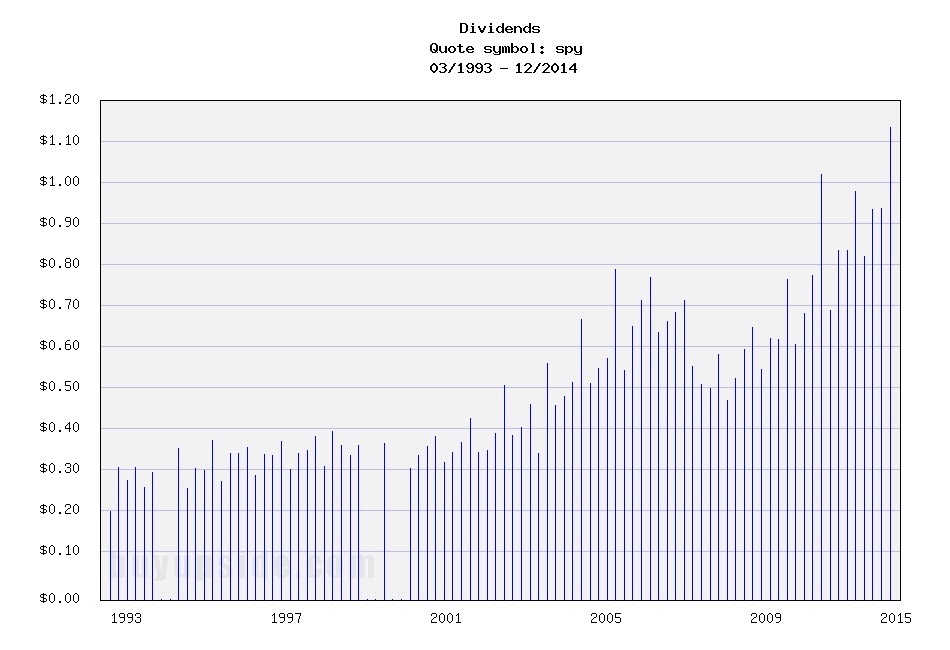
Source: Buy Upside
Stock prices have moved higher in concert with rising dividends, which, as you can see from the chart below, has kept the dividend yield flat at around 2% over the last few years. Treasury bond yields, on the other hand, have been on steady declining trend for the last 35 years. So, while coupons on newly issued bonds have been declining for virtually the last three and a half decades, stock dividends have been on a steadily upward moving rampage, excluding recessions (up +13% in the most recent reported period).
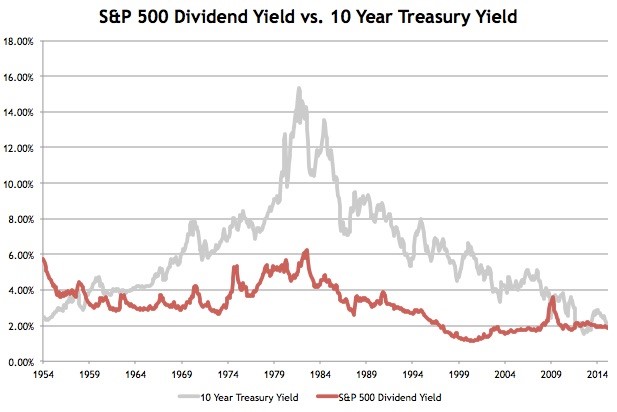
Source: Avondale Asset Management
Declining interest rates have made stocks look attractive relative to investment grade corporate bonds too as evidenced by the chart below. As you can see, over the last half-century, corporate bond yields have predominantly offered higher income yields than the earnings yield on stocks – that is not the case today.
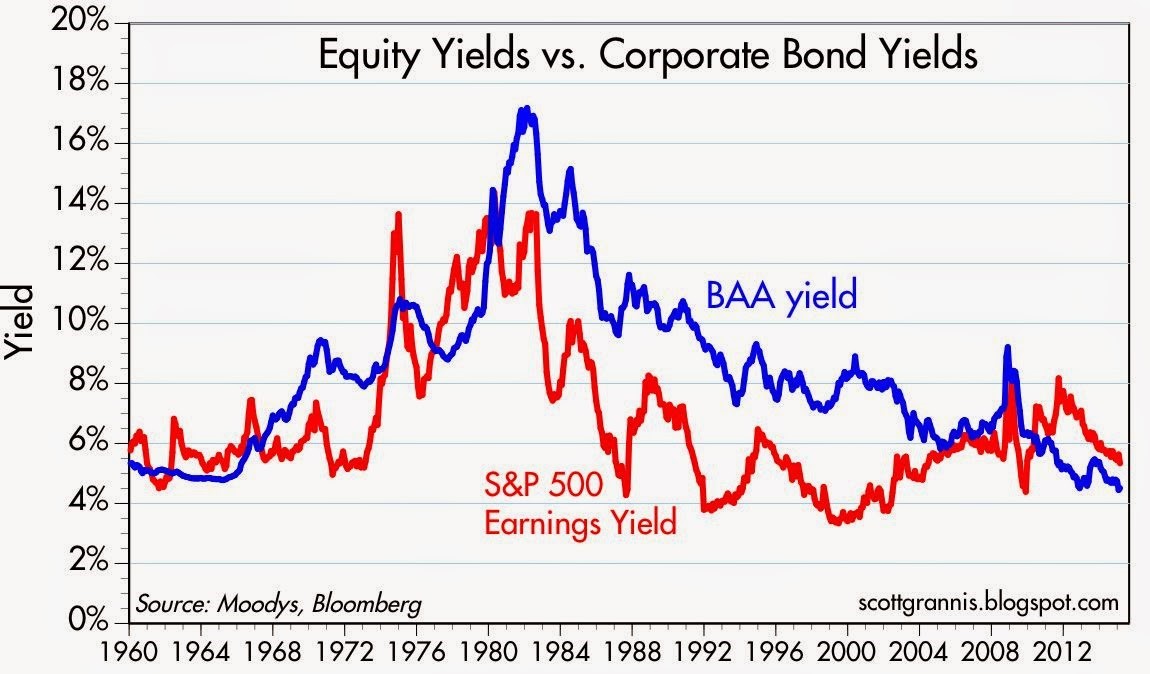
Source: Calafia Beach Pundit
What does all this stock dividend, earnings yield stuff mean? In the grand scheme of things, income starving Baby Boomers and retirees are slowly realizing that stocks in general stack up favorably in an environment in which interest payments are going down and dividend payments are going up. One of the areas highlighting the underlying demand for stocks is the Volatility Index (VIX) – a.k.a., the “Fear Gauge.” Despite Greece, Russia, ISIS, the Fed, and the Dollar dominating the headlines, the hunger for yield and growth in a declining interest rate environment is cushioning the blow during these heightened periods of volatility (see also A Series of Unfortunate Events).
Since the end of 2011, the monthly close of the VIX has stayed above its historical average of approximately 20 only two times (see chart below). In other words, over that timeframe, the VIX has remained below average about 95% of the time. When the VIX has spiked above 20, generally it has only been for brief periods, until cooler heads prevail and bargain hunters come in to buy depressed stock bargains.
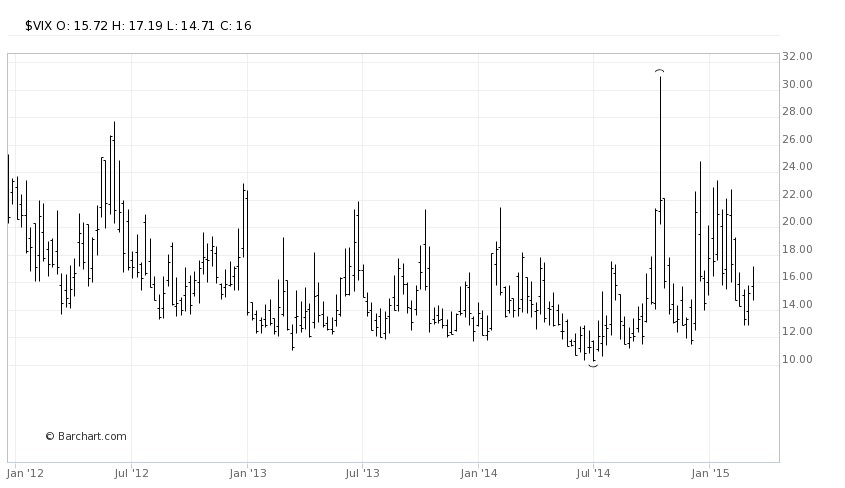
Source: Barchart
I’m not naïve enough to believe the bull market in stocks will last forever, but as long as interest rates don’t spike up and/or corporate earnings crater, underlying demand for yield should provide a floor for stocks during heightened periods of volatility. We may be in the midst of March Madness but volatility blandness is showing us that investors are paying attention to dividend grandness.
Wade W. Slome, CFA, CFP®
Plan. Invest. Prosper.
DISCLOSURE: Sidoxia Capital Management (SCM) and some of its clients hold positions in certain exchange traded funds (ETFs) and SPY, but at the time of publishing, SCM had no direct position in any other security referenced in this article. No information accessed through the Investing Caffeine (IC) website constitutes investment, financial, legal, tax or other advice nor is to be relied on in making an investment or other decision. Please read disclosure language on IC Contact page.
Is Good News, Bad News?

The tug-of-war is officially on as investors try to decipher whether good news is good or bad for the stock market? On the surface, the monthly January jobs report released by the Bureau of Labor Statistics (BLS) appeared to be welcomed, positive data. Total jobs added for the month tallied +257,000 (above the Bloomberg consensus of +230,000) and the unemployment rate registered 5.7% thanks to the labor participation rate swelling during the month (see chart below). More specifically, the number of people looking for a job exceeded one million, which is the largest pool of job seekers since 2000.
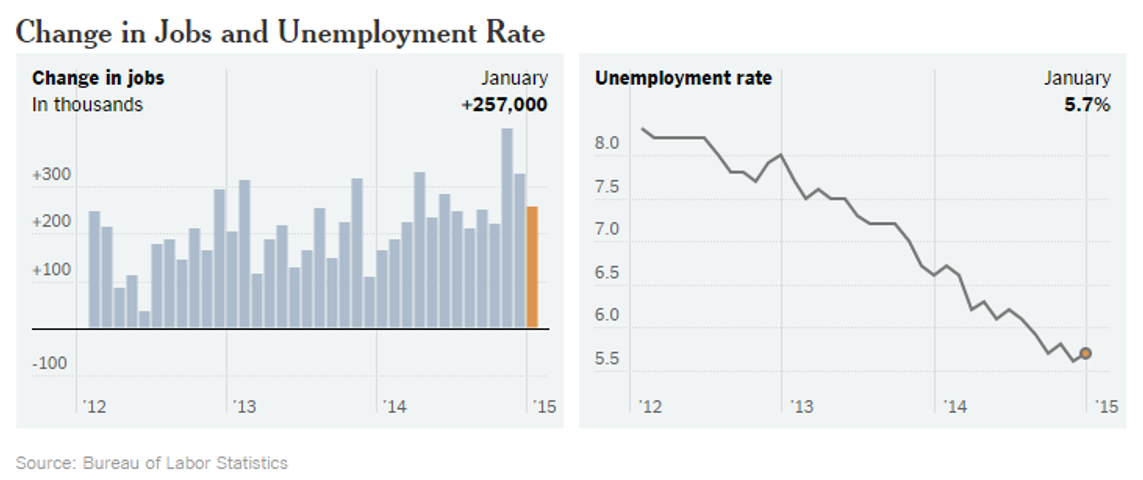
Source: BLS via New York Times
Initially the reception by stocks to the jobs numbers was perceived positively as the Dow Jones Industrial index climbed more than 70 points on Friday. Upon further digestion, investors began to fear an overheated employment market could lead to an earlier than anticipated interest rate hike by the Federal Reserve, which explains the sell-off in bonds. The yield on the 10-Year Treasury proceeded to spike by +0.13% before settling around 1.94% – that yield compares to a recent low of 1.65% reached last week. The initial euphoric stock leap eventually changed direction with the Dow producing a -180 point downward reversal, before the Dow ended the day down -62 points for the session.
Crude Confidence?
The same confusion circling the good jobs numbers has also been circulating around lower oil prices, which on the surface should be extremely positive for the economy, considering consumer spending accounts for roughly 70% of our country’s economic output. Lower gasoline prices and heating bills means more discretionary spending in the pockets of consumers, which should translate into more economic activity. Furthermore, it comes as no surprise to me that oil is both figuratively and literally the lubricant for moving goods around our country and abroad, as evidenced by the Dow Jones Transportation index that has handily outperformed the S&P 500 index over the last 18 months. While this may truly be the case, many journalists, strategists, economists, and analysts are nevertheless talking about the harmful deflationary impacts of declining oil prices. Rather than being viewed as a stimulative lubricant to the economy, many of these so-called pundits point to low oil prices as a sign of weak global activity and an omen of worse things to come.
This begs the question, as I previously explored a few years ago (see Good News=Good News?), is it possible that good news can actually be good news? Is it possible that lower energy costs for oil importing countries could really be stimulative for the global economy, especially in regions like Europe and Japan, which have been in a decade-long funk? Is it possible that healthier economies benefiting from substantial job creation can cause a stingy, nervous, and scarred corporate boardrooms to finally open up their wallets to invest more significantly?
Interest Rate Doom May Be Boom?
Quite frankly, all the incessant, never-ending discussions about an impending financial market Armageddon due to a potential single 0.25% basis point rate hike seem a little hyperbolic. Could I be naively whistling past the graveyard? From my perspective, although it is a foregone conclusion the Fed will have to increase interest rates above 0%, this is nothing new (I’m really putting my neck out there on this projection). Could this cause some volatility when it finally happens…of course. Just look at what happened to financial markets when former Federal Reserve Chairman Ben Bernanke merely threatened investors with a wind-down of quantitative easing (QE) in 2013 and investors had a taper tantrum. Sure, stocks got hit by about -5% at the time, but now the S&P 500 index has catapulted higher by more than +25%.
Looking at how stocks react in previous rate hike cycles is another constructive exercise. The aggressive +2.50% in rate hikes by former Fed Chair Alan Greenspan in 1995 may prove to be a good proxy (see also 1994 Bond Repeat?). After suffering about a -10% correction early in 1994, stocks rallied in the back-half to end the year at roughly flat.
And before we officially declare the end of the world over a single 0.25% hike, let’s not forget that the last rate hike cycle (2004 – 2006) took two and a half years and 17 increases in the targeted Federal Funds rate (1.00% to 5.25%). Before the rate increases finally broke the stock market’s back, the bull market moved about another +40% higher…not too shabby.
Lastly, before writing the obituary of this bull market, it’s worth noting the yield curve has been an incredible leading indicator and currently this gauge is showing zero warnings of any dark clouds approaching on the horizon (see chart below). As a matter of fact, over the last 50 years or so, the yield curve has turned negative (or near 0%) before every recession.
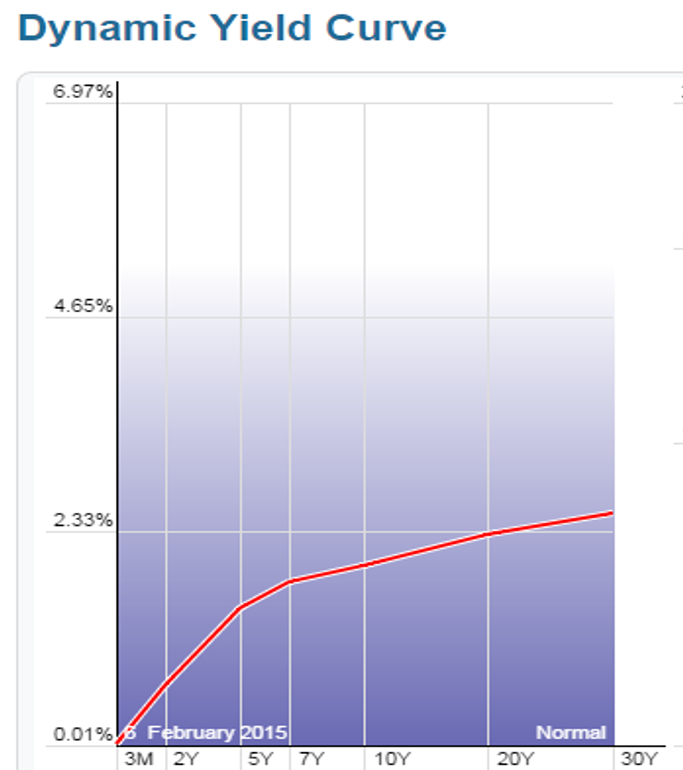
Source: StockCharts.com
As the chart above shows, the yield curve remains very sloped despite modest flattening in recent quarters.
While many skeptics are having difficulty accepting the jobs data and declining oil prices as good news because of rate hike fears, history shows us this position could be very misguided. Perhaps, once again, this time around good news may actually be good news.
Wade W. Slome, CFA, CFP®
Plan. Invest. Prosper.
DISCLOSURE: Sidoxia Capital Management (SCM) and some of its clients hold positions in certain exchange traded funds (ETFs), but at the time of publishing SCM had no direct position in any other security referenced in this article. No information accessed through the Investing Caffeine (IC) website constitutes investment, financial, legal, tax or other advice nor is to be relied on in making an investment or other decision. Please read disclosure language on IC Contact page.
The Gift that Keeps on Giving

There have been numerous factors contributing to this bull market, even in the face of a slew of daunting and exhausting headlines. Contributing to the advance has been a steady stream of rising earnings; a flood of price buoying stock buybacks; and the all-important gift of growing dividends that keep on giving. Bonds have benefited to a lesser extent than stocks over the last five years in part because bonds lack the gift of rising dividend payouts. Life would be grander for bondholders, if the issuers had the heart to share generous news like this:
“Good day Mr. & Mrs. Jones. As your bond issuer, we value our mutually beneficial relationship so much that we would like to reward you as a bond investor. In addition to the 2.5% we are paying you now, we have decided to increase your annual payments by 6% per year for the next 20 years. In other words, we will increase your $2,500 in annual interest payments to over $8,000 per year. But wait…there’s more! You are such great people, we are going to increase the value of your initial $100,000 investment to $450,000.”
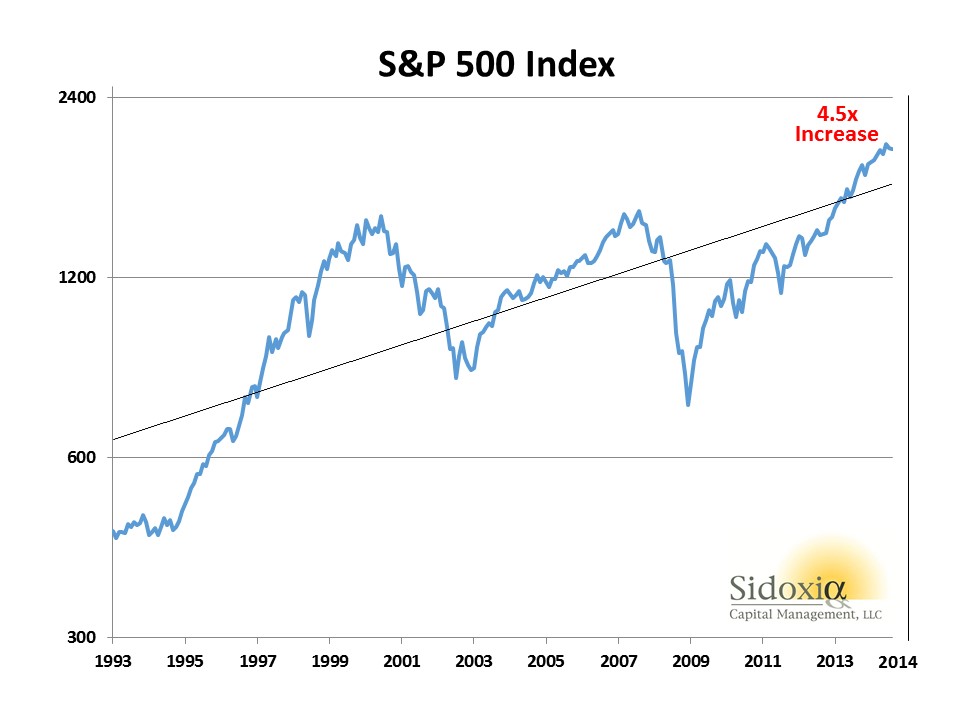
Does this sound too good to be true? Well, it’s not…sort of. However, the scenario is absolutely true, if you invested $100,000 in S&P 500 stocks during 1993 and held that investment until today. Unfortunately, the gift giving conversation above would be unattainable and the furthest from the truth, if you invested $100,000 into bonds. Today, if you decided to invest $100,000 in 20-year government bonds paying 2.5%, your $2,500 in annual payments will never increase over the next two decades. What’s more, by 2034 your initial principal of $100,000 won’t increase by a penny, while inflation slowly but surely crushes your investment’s purchasing power.
To illustrate the magical power of dividend compounding at a 6% CAGR, here is a chart of the S&P 500 dividend stream over the 21-year period of 1993 – 2014:

The trend of increasing dividends doesn’t appear to be slowing either. Here is a table showing the number of S&P 500 companies increasing their dividend payouts:
| COUNT OF DIVIDEND ACTIONS YEAR-TO-DATE | INCREASING THEIR DIVIDEND |
| 2014 YTD | 292 |
| 2013 | 366 |
| 2012 | 333 |
| 2011 | 320 |
| 2010 | 243 |
| 2009 | 151 |
Source: Standard and Poor’s
As I mentioned before, while dividends have more than tripled over the last twenty years, stock prices have gone up even more – appreciating about 4.5x’s (see chart below):
With aging demographics increasing retirement income needs, it comes as no surprise to me that the percentage of S&P 500 companies paying dividends has increased from 71% (351 companies) in 2001 to 84% (423 companies) at the end of Q3 – 2014. Interestingly, all 30 members of the Dow Jones Industrial Average currently pay a dividend. If you broaden out the perspective to all S&P Dow Jones Indices, you will discover the strength of dividends is particularly evident over the last 12 months. During this period, dividends increased by a whopping +27%, or $55 billion.
This trend in increasing dividends can also be seen through the lens of the dividend payout ratio. It is true that over longer timeframes the dividend payout ratio has been coming down (see Dividend Floodgates Widen) because of share buyback tax efficiency. Nevertheless, more recently the dividend payout ratio has drifted upwards to a range of about 32% of profits since 2011 (see chart below):

Source: FactSet
There’s no disputing the benefit of rising stock dividends. Baby Boomers, retirees, and other long-term investors are increasingly reaping the rewards of these dividend gifts that keep on giving.
Other Investing Caffeine articles on dividends:
Dividends: From Sapling to Abundant Fruit Tree
Wade W. Slome, CFA, CFP®
Plan. Invest. Prosper.
DISCLOSURE: Sidoxia Capital Management (SCM) and some of its clients hold positions in certain exchange traded funds (ETFs) including SPY, but at the time of publishing SCM had no direct position in any other security referenced in this article. No information accessed through the Investing Caffeine (IC) website constitutes investment, financial, legal, tax or other advice nor is to be relied on in making an investment or other decision. Please read disclosure language on IC Contact page.


