Posts tagged ‘balance sheet’
A Sleepy Stock that Can Wake Up Your Portfolio

In over 35 years of investing, I have rarely encountered a company in such a unique – and frustrating – position as Harmony Biosciences (“Harmony” – HRMY). As a shareholder through my firm, Sidoxia Capital Management, I approach this analysis with a dual lens: as an investor seeing immense value, and as a fiduciary who expects corporate leadership to act in the best interest of its owners.
While Harmony’s executive team has executed brilliantly on its clinical mission, they are currently failing their fiduciary duty regarding capital allocation. Here is why Harmony is a “Diamond in the Rough” that needs a wake-up call.
Harmony Biosciences Overview – A Rare Disease Powerhouse
Harmony is a neuroscience-focused company targeting rare and underserved conditions such as narcolepsy, Prader-Willi Syndrome, and certain rare epilepsies—areas where treatment options are limited or nonexistent.
Today, the vast majority of revenue is driven by narcolepsy, a neurological disorder that disrupts sleep-wake cycles and leads to excessive daytime sleepiness and sudden sleep attacks. While approximately 135,000–200,000 Americans are diagnosed, the true number is likely higher due to underdiagnosis and misdiagnosis.
Harmony’s flagship drug, WAKIX (pitolisant), is on track to surpass $1 billion in annual revenue in 2026, achieving blockbuster status. Importantly, WAKIX is the only FDA-approved narcolepsy treatment that is not a controlled substance as defined by the U.S. Drug Enforcement Administration (DEA), providing a meaningful competitive advantage over alternative therapies.
Significant Growth Beyond WAKIX
Harmony’s long-term opportunity extends well beyond narcolepsy. The company is leveraging the pharmaceutical compound behind its franchise drug WAKIX (pitolisant) to expand and diversify its revenue base into additional CNS (Central Nervous System) indications, with five ongoing Phase 3 registrational programs (see below):
- Pitolisant HD (High Dose) – Idiopathic Hypersomnia (IH) – potential $1.5 billion – $2.0 billion market with possible FDA submission for approval in 2027.
- Pitolisant HD (High Dose) – Narcolepsy – potential to accelerate the growth of $1 billion WAKIX franchise (2026 estimate) by offering enhanced efficacy for fatigue. FDA submission for approval of Pitolisant HD could come in 2027.
- Pitolisant – Prader-Willi Syndrome (PWS) – There are an estimated 15,000–20,000 people in the U.S. with PWS. Over half of these targeted patients suffer from EDS, which is effectively treated with Pitolisant. PWS has a potential of reaching $300 million – $500 million in revenue and receiving FDA submission for approval during the 2nd half of 2026.
- EPX-100 (Clemizole HCl) – Dravet Syndrome (epilepsy with onset at infancy) – expands Harmony into a potential $800 million global market by 2030 with possible FDA submission for approval in the 1st half of 2027.
- EPX-100 (Clemizole HCl) – Lennox-Gastaut Syndrome (LGS) (epilepsy with multiple seizure types) – opens the company to a potential $1 billion market globally.
Collectively, this pipeline has the potential to generate billions in incremental revenue.
A Diamond in the Rough

There are many ways to value a stock, but one common approach is to compare a company’s price-to-earnings ratio (P/E) to that of the S&P 500. Generally, stocks trading below the market’s average P/E are considered cheap, while those above it are viewed as more expensive.
Harmony shares currently trade at approximately 8x trailing twelve-month earnings and 7x its 2026 earnings forecast. By comparison, this represents roughly a -70% discount to the average S&P 500 stock. Based on these metrics, Harmony appears dramatically undervalued—assuming the company’s fundamentals remain intact.
Of course, valuation must be considered alongside growth and execution. On that front, management continues to emphasize strong underlying performance.
And the results support that claim. In less than three years, CEO Dr. Jeffrey Dayno has grown revenue by approximately 74%, from roughly $500 million in April 2023 to over $860 million today, with expectations to exceed $1 billion in annual sales by the end of the year.
But wait, there’s more. The balance sheet tells a similarly compelling story. Over that same period, Harmony’s net cash position (gross cash minus debt) has increased from approximately $201 million to $719 million, even after completing two acquisitions totaling about $69 million (Zynerba and Epygenix). During this time, quarterly revenue growth has averaged roughly +23%, while cash has more than tripled, despite the acquisitions.
What’s more, Harmony’s cash profitability is equally impressive. In 2025, Harmony generated a 40% free cash flow margin, meaning $0.40 of every $1 of revenue converted into free cash flow. That level of efficiency would rank among the top two percent of companies in the S&P 500, placing Harmony alongside some of the most profitable behemoths in the market, including NVIDIA Corp.
Which brings us to the key question: If the stock is this inexpensive and the fundamentals are this strong, why isn’t the company aggressively repurchasing its own shares hand-over-fist? To date, management has not provided a clear or credible answer to this question.
What is the Downside to Harmony?
All this fundamental strength and financial momentum sounds like great news for shareholders—but where’s the risk and bad news? Regrettably, despite strong execution under CEO Dr. Jeffrey Dayno over the past three years, the stock is down approximately -14% (from ~$32 to ~$28 per share).
If everything is going so well, why have investors been so spooked recently? The primary concern centers on potential generic competition for WAKIX, the company’s key drug. To Harmony’s credit, it has already settled litigation with six of seven generic challengers, but one holdout—AET Pharma—has taken the case to trial. Some Wall Street analysts and investors believe the judge may rule in favor of AET, which contributed to a sharp decline in the stock last month.
If Harmony loses, WAKIX’s patent protection—currently expected to extend through 2030—could be materially weakened, potentially allowing generic competition to enter the market as early as late 2026 or early 2027, depending on the timing of the ruling and subsequent developments.
Fear not, says management. They remain confident in their defense strategy. As CEO Dr. Dayno stated, “Pitolisant GR will extend the WAKIX franchise and our leadership in narcolepsy as a line extension of WAKIX with its broad clinical utility. We are on track for NDA submission in Q2 this year with a target PDUFA date in Q1 2027.”
Management believes this next-generation formulation, Pitolisant GR, could significantly mitigate—or even eliminate—the impact of generic competition. Unlike WAKIX, which faces potential patent challenges, Pitolisant GR is expected to have patent protection through 2044.
If the timeline holds, the company expects a substantial portion of WAKIX patients to transition to GR, reducing the impact of any generic entrants. Additionally, even in a worst-case scenario where AET prevails, the financial risk associated with launching an “at-risk” generic—particularly if Harmony were to win on appeal—could be significant enough to deter entry and easily push AET towards a settlement with Harmony.
Am I Missing Something?
When a stock trades at such an egregiously low valuation, I inevitably ask myself, “Am I missing something?” If management is sitting on its hands doing nothing, perhaps Harmony’s fundamental outlook is worse than they are leading investors to believe. If management is unwilling to deploy even a portion of its inefficient, over-bloated cash hoard toward share repurchases – especially with the stock arguably at its cheapest level in history – why should investors commit their hard-earned capital to what could be a sinking ship?
Is it possible that management lacks confidence in the Pitolisant GR NDA data, or that the Q2 NDA timeline could slip? If so, and if AET prevails in court, Harmony’s entire $1 billion franchise revenue base could be at risk.
Management has dismissed these concerns and continues to insist that everything is on track. If that’s truly the case, then – with a clear line of sight into the company’s prospects – Harmony should be aggressively buying back its stock if the outlook is as strong and rosy as they claim.
Actions Speak Louder than Words

According to management, Harmony’s fundamentals remain robust. Not only does Harmony have five late-stage, phase three indications in the pipeline, it also claims to have a near bullet-proof generic competition protection strategy. Yet, with the stock down around -33% from its 52-week high, it is difficult to justify why management is not forcefully repurchasing shares at prices that are currently highly accretive to EPS.
I have raised this issue with senior management multiple times, but unfortunately my concerns have fallen on deaf ears. I’m hardly alone – other investors have voiced similar frustrations but inaction remains the default stance of management. The company’s response to this elephant in the room remains perplexing.
On the most recent fourth quarter conference call with investors, CFO Sandip Kapadia stated, “Business development is a high priority, and our intention is to deploy capital to expand our pipeline and commercial portfolio.” CEO Dr. Jeffrey Dayno echoed this sentiment, emphasizing a “commitment to generate even greater value through the pursuit of smart business development opportunities.”
It’s great that Harmony “intends” to deploy capital and “pursue” opportunities, but the fact remains, Harmony effectively has not devoted a penny over the last two years to capital deployment, and the company has spent next-to-nothing on capital deployment since the company’s IPO (Initial Public Offering) in August 2020.
Meanwhile, the company’s massive net cash balance – currently $719 million – is rapidly expanding by more than $100 million+ per quarter and is on track to swell to $1 billion this year. By the end of 2026, cash could represent as much as two-thirds of Harmony’s total market value, particularly if the share price remains depressed or declines further.
Walking and Chewing Gum

Can Harmony walk and chew gum at the same time? In other words, can the company allocate a portion of its gigantic cash balance toward a monumentally accretive share repurchase program while simultaneously pursuing business development (M&A – Mergers & Acquisitions) opportunities? The short answer is yes.
In fact, Harmony did exactly that in 2023 and 2024 – deploying nearly half of its cash toward share buybacks while ALSO completing two acquisitions that contributed to its expanding pipeline of promising new indications.
Management argues it’s currently evaluating a broad list of acquisition targets. However, one could reasonably contend that Harmony will be hard-pressed to find opportunities more attractive than its own stock. The bar is exceptionally high: identifying highly profitable companies with similarly robust pipelines, that are also trading at a steep discount and offering comparable growth characteristics.
By comparison, Harmony’s own shares appear to trade at roughly a -70% discount to the market, with approximately 50% of its market capitalization in cash, while delivering ~20% top-line growth, and securing a deep pipeline of five Phase 3 programs. Under these conditions, it seems like Harmony buying back their own stock is a no-brainer.
Where Is the Board and Why Are They Not Acting?

This is a question I’m asking, and I hope the board will answer the capital allocation question more thoughtfully. Ideally, the response will come in the form of a material share repurchase (i.e., action).
For those curious, I have identified the distinguished group of Harmony board members, and I intend to pursue an explanation relating to the board’s inaction. Here are Harmony’s current board members:
- Jeffrey S. Aronin (Executive Chairman) – Founder and CEO of Paragon Biosciences.
- Jeffrey M. Dayno, MD (President, CEO & Director) – Former CMO of Harmony; Board-certified neurologist.
- Peter Anastasiou (Independent Director) – CEO of Capsida Biotherapeutics; former Lundbeck executive.
- Antonio Gracias (Independent Director) – Founder/CEO of Valor Equity Partners and Director at Tesla.
- Mark Graf (Independent Director) – Former CFO of Discover Financial Services.
- Ron Philip (Independent Director) – CEO of Orbital Therapeutics and former CEO of Spark Therapeutics.
- Juan Sabater (Independent Director) – Partner at Valor Equity Partners and former Goldman Sachs MD.
- Gary Sender (Independent Director) – Former CFO of Nabriva Therapeutics and Shire PLC.
- Linda Szyper (Independent Director) – Former COO of McCann Health; pharmaceutical sales veteran.
- Andreas Wicki, PhD (Independent Director) – CEO of HBM Healthcare Investments.
I’m not sure whether the board is asleep at the switch, but it has a clear fiduciary duty to allocate capital efficiently and maximize shareholder value. Allowing the balance sheet to become excessively bloated while taking no meaningful action falls short of that responsibility. The company needs to act.
As Harmony’s share price remains stagnant and under pressure, management and the board continue to irresponsibly let cash accumulate. Net cash now represents approximately 45% of the company’s market capitalization. If Harmony were in the S&P 500, this would place it among the top 1% of companies by cash as a percentage of market value – all while trading at roughly a -70% discount to the broader market.
We remain long-term shareholders, but there are only two plausible explanations. Either management is correct, and this represents a generational buying opportunity—or the company knows something investors do not, which may explain the lack of action and the continued buildup of cash.
Bottom line: assuming a successful defense against generic competition and a conservative rollout of the pipeline—including Pitolisant GR and Pitolisant HD—$7 in EPS by 2030 at a 22x multiple implies a $154 price target, or roughly +450% upside from today’s ~$28 share price.
Harmony may be a sleepy stock today, but it has all the ingredients to wake up your portfolio. While management and the board have been slow to act and have yet to fully meet their fiduciary responsibility on capital allocation, I remain optimistic that they will ultimately do the right thing. By deploying capital more effectively – most notably through a meaningful share repurchase at today’s historically attractive valuation – Harmony has the opportunity to awaken significant shareholder value and live up to its full potential.
Wade W. Slome, CFA, CFP®
Plan. Invest. Prosper.
DISCLOSURE: Sidoxia Capital Management (SCM) and some of its clients hold positions in HRMY, NVDA, TSLA, GS, and certain exchange traded funds (ETFs), but at the time of publishing had no direct position in DFS, HBMN, HLUYY, or any other security referenced in this article. No information accessed through the Investing Caffeine (IC) website constitutes investment, financial, legal, tax or other advice nor is to be relied on in making an investment or other decision. Please read disclosure language on IC Contact page.
Consumer Confidence Flies as Stock Market Hits New Highs

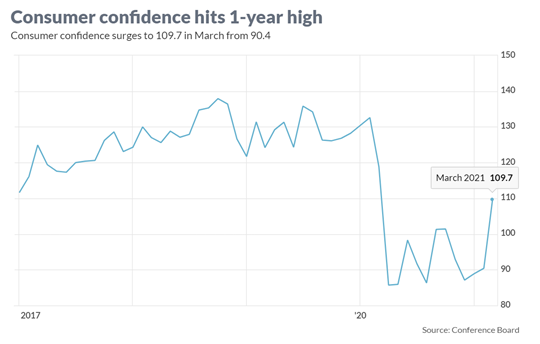
As the economy starts reopening from a global pandemic that is improving, consumers and businesses are beginning to see a light at the end of the tunnel. The surge in the recently reported Consumer Confidence figures to a new one-year high (see chart below) is evidence the recovery is well on its way. A stock market reaching new record highs is further evidence of the reopening recovery. More specifically, the Dow Jones Industrial Average catapulted 2,094 points higher (+6.2%) for the month to 32,981 and the S&P 500 index soared +4.2%. A rise in interest rate yields on the 10-Year Treasury Note to 1.7% from 1.4% last month placed pressure on technology growth stocks, which led to a more modest gain of +0.4% in the tech-heavy NASDAQ index during March.
Comeback from COVID
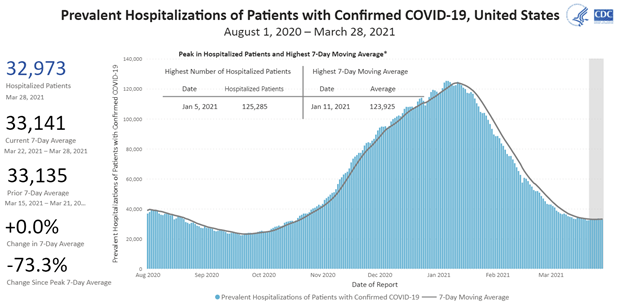
With a combination of 150 million vaccine doses administered and 30 million cumulative COVID cases, the U.S. population has creeped closer toward herd immunity protection against the virus and pushed down hospitalizations dramatically (see chart below).
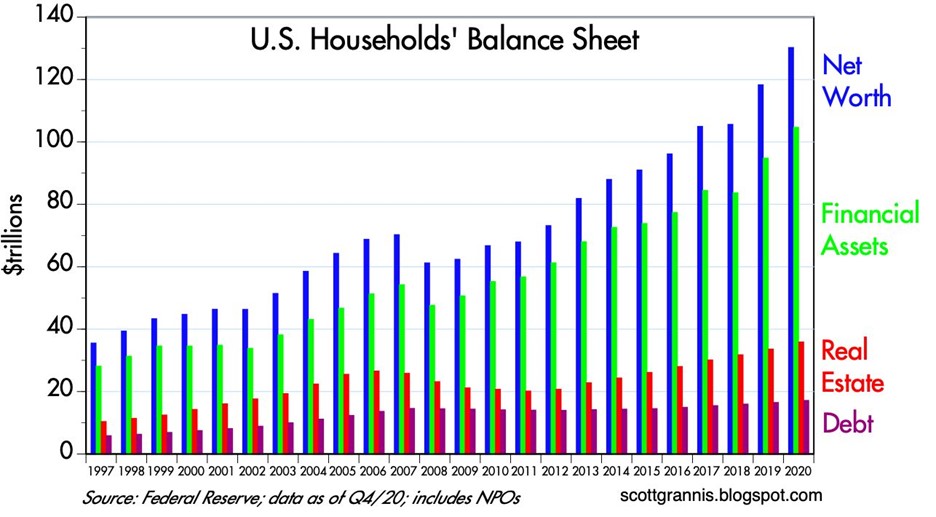
Also contributing to investor optimism have been the rising values of investments and real estate assets thanks to an improving economy and COVID case count. As you can see from the chart below, the net worth of American households has more than doubled from the 2008-2009 financial crisis to approximately $130 trillion dollars, which in turn has allowed consumers to responsibly control and manage their personal debt. Unfortunately, the U.S. government hasn’t been as successful in keeping debt levels in check.
Spending and Paying for Infrastructure Growth
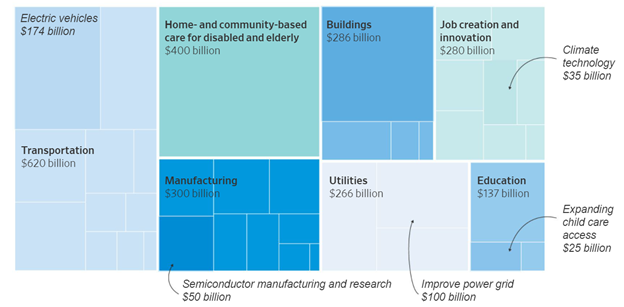
Besides focusing on positive COVID trends, investors have also centered their attention on the passage of a $1.9 trillion stimulus bill last month and a new proposed $2.3 trillion infrastructure bill that President Biden unveiled details on yesterday. At the heart of the multi-trillion dollar spending are the following components (see also graphic below):
- $621 billion modernize transportation infrastructure
- $400 billion to assist the aging and disabled
- $300 billion to boost the manufacturing industry
- $213 billion to build and retrofit affordable housing
- $100 billion to expand broadband access
With over $28 trillion in government debt, how will all this spending be funded? According to The Fiscal Times, there are four main tax categories to help in the funding:
Corporate Taxes: Raising the corporate tax rate to 28% from 21% is expected to raise $730 billion over 10 years
Foreign Corporate Subsidiary Tax: A new global minimum tax on foreign subsidiaries of American corporations is estimated to raise $550 billion
Capital Gains Tax on Wealthy: Increasing income tax rates on capital gains for wealthy individuals is forecasted to raise $370 billion
Income Tax on Wealthy: Lifting the top individual tax rate back to 39.6% for households earning more than $400,000 per year is seen to bring in $110 billion
Besides the economy being supported by government spending, growth and appreciation in the housing market are contributing to GDP growth. The recently released housing data shows housing prices accelerating significantly above the peak levels last seen before the last financial crisis (see chart below).
Although the economy appears to be on solid footing and stock prices have marched higher to new record levels, there are still plenty of potential factors that could derail the current bull market advance. For starters, increased debt and deficit spending could lead to rising inflation and higher interest rates, which could potentially choke off economic growth. Bad things can always happen when large financial institutions take on too much leverage (i.e., debt) and speculate too much (see also Long-Term Capital Management: When Genius Failed). The lesson from the latest, crazy blow-up (Archegos Capital Management) reminds us of how individual financial companies can cause billions in losses and cause ripple-through effects to the whole financial system. And if that’s not enough to worry about, you have rampant speculation in SPACs (Special Purpose Acquisition Companies), Reddit meme stocks (e.g., GameStop Corp. – GME), cryptocurrencies, and NFTs (Non-Fungible Tokens).
Successful investing requires a mixture of art and science – not everything is clear and you can always find reasons to be concerned. At Sidoxia Capital Management, we continue to find attractive opportunities as we strive to navigate through areas of excess speculation. At the end of the day, we remain disciplined in following our fundamental strategy and process that integrates the four key legs of our financial stool: corporate profits, interest rates, valuations, and sentiment (see also Don’t Be a Fool, Follow the Stool). As long as the balance of these factors still signal strength, we will remain confident in our outlook just like consumers and investors are currently.

Wade W. Slome, CFA, CFP®
Plan. Invest. Prosper.
This article is an excerpt from a previously released Sidoxia Capital Management complimentary newsletter (April 1, 2021). Subscribe on the right side of the page for the complete text.
DISCLOSURE: Sidoxia Capital Management (SCM) and some of its clients hold positions in certain exchange traded funds (ETFs), but at the time of publishing had no direct position in GME or any other security referenced in this article. No information accessed through the Investing Caffeine (IC) website constitutes investment, financial, legal, tax or other advice nor is to be relied on in making an investment or other decision. Please read disclosure language on IC Contact page.
Politics & COVID Tricks

Thanks to a global epidemic, trillions of dollars instantly disappeared during the first quarter of this year, and then, abracadabra…the losses turned into gains and magically reappeared in the subsequent two quarters. After a stabilization in the spread of the COVID-19 virus earlier this year, the stock market rebounded for five consecutive months, at one point rebounding +64% (from late March to early September) – see chart below. However, things became a little bit trickier for the recent full month as concerns heightened over the outcome of upcoming elections; uncertainty over a potential coronavirus-related stimulus package agreement; and fears over a fall resurgence in COVID-19 cases. Although the S&P 500 stock index fell -3.9% and the Dow Jones Industrial Average slipped -2.3% during September, the same indexes levitated +8.5% and +7.6% for the third quarter, respectively.
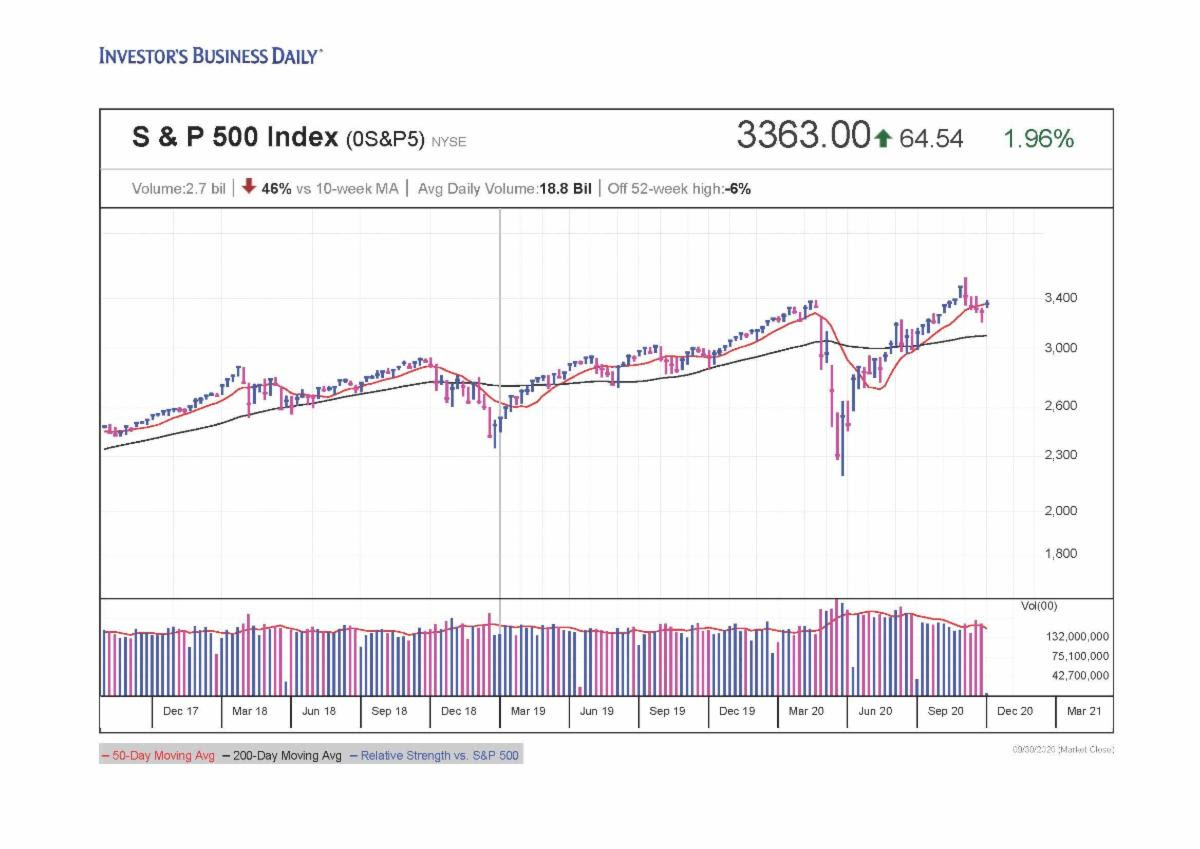
Source: Investors.com
Washington Worries
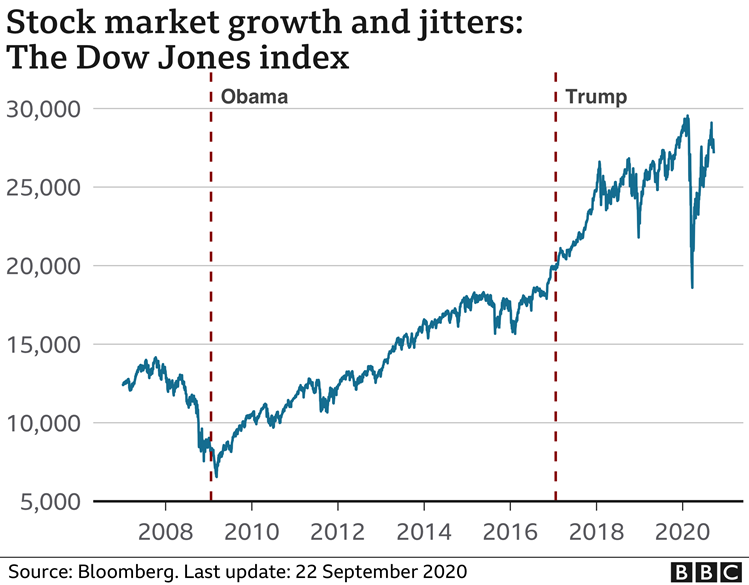
Anxiety over politics is nothing new, and as I’ve written extensively in my Investing Caffeine blog, history teaches us that politics have little to do with the long-term performance of the overall stock market (e.g., see Politics & Your Money). Nobody knows with certainty how the elections will impact the financial markets and economy (myself included). But what I do know is that many so-called experts said the stock market would decline if Barack Obama won the presidential election…in reality the stock market soared. I also know the so-called experts said the stock market would decline if Donald Trump won the presidential election… in reality the stock market soared. So, suffice it to say, I don’t place a lot of faith into what any of the so-called political experts say about the outcome of upcoming elections (see the chart below).
COVID Coming Back?
One of the reasons stock prices have risen more than 50%+ is due to a stabilization in COVID-19 virus trends. As you can see from the charts below, new tests, hospitalizations, and death rates are generally on good trajectories, according to the COVID Tracking Project. However, new COVID cases have bumped higher in recent weeks. This recent, troubling trend has raised the question of whether another wave of cases is building in front of a dangerous, seasonally-cooler fall flu season. Traditionally, it’s during this fall period in which contagious viruses normally spread faster.
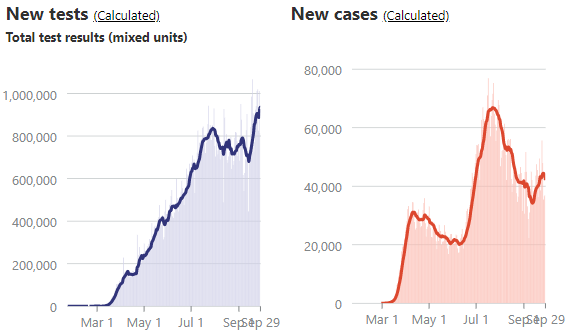
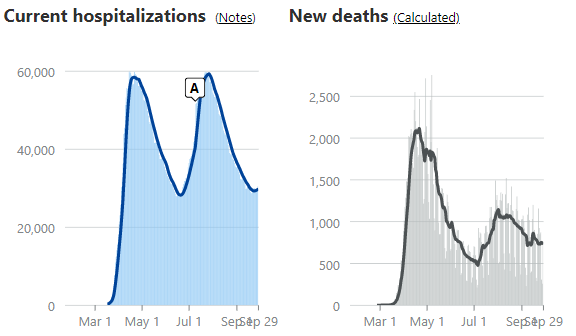
Source: The COVID Tracking Project
Regardless of the trendline in new cases, there is plenty of other promising COVID developments to help fight this pandemic, such as the pending approvals of numerous vaccines, along with improved therapies and treatments, such as therapeutics, steroids, blood thinners, ventilators, and monoclonal antibodies.
Business Bounce
From the 10,000-foot level, despite worries over various political outcomes, the economy is recovering relatively vigorously. As you can see from the chart below, the rebound in employment has been fairly swift. After peaking in April at 14.7%, the most recent unemployment rate has declined to 8.4%, and a closely tracked ADP National Employment Report was released yesterday showing a higher than expected increase in new private-sector monthly jobs (749,000 vs. 649,000 median estimate).
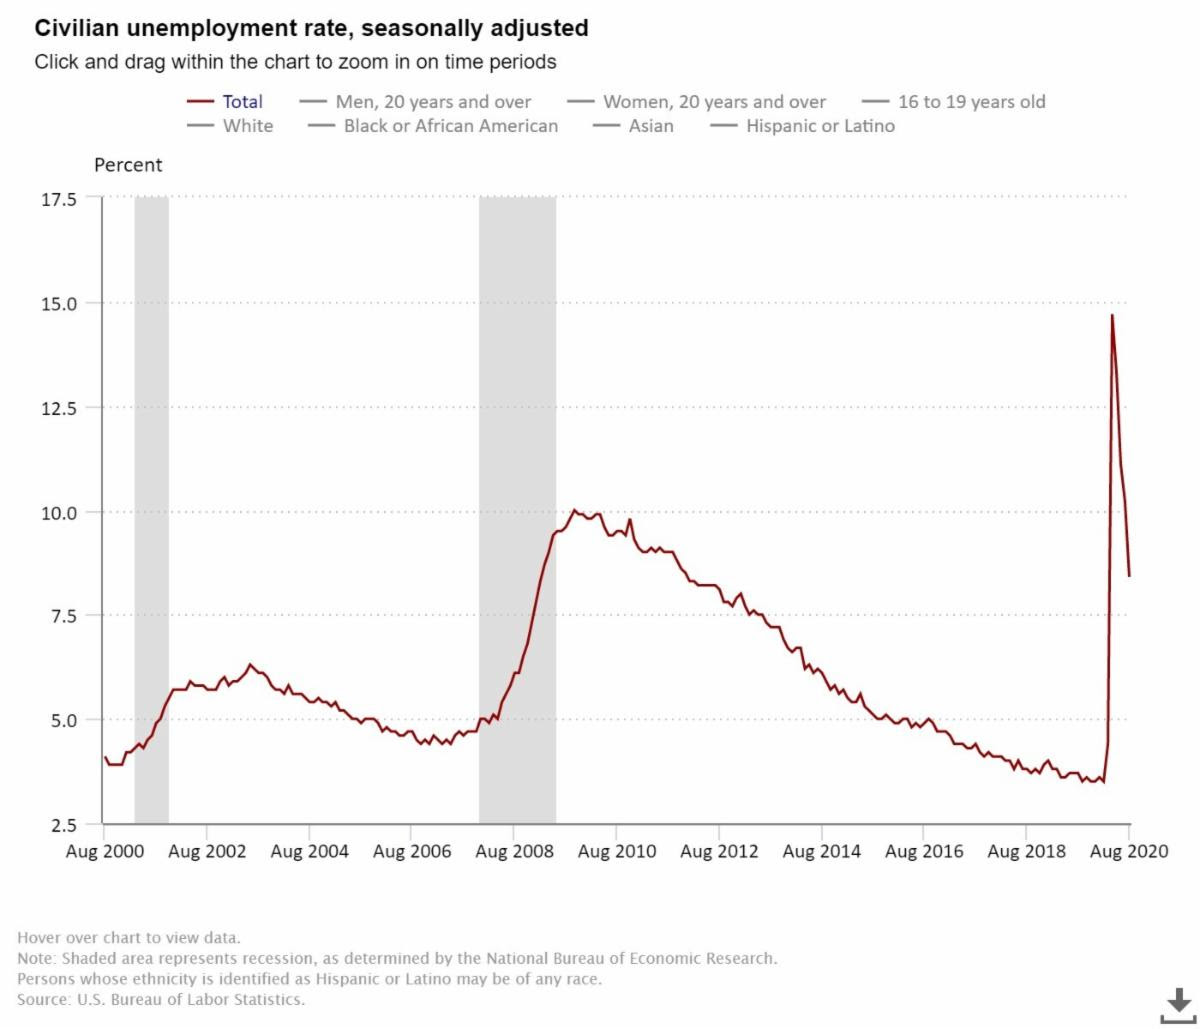
Source: U.S. Bureau of Labor Statistics
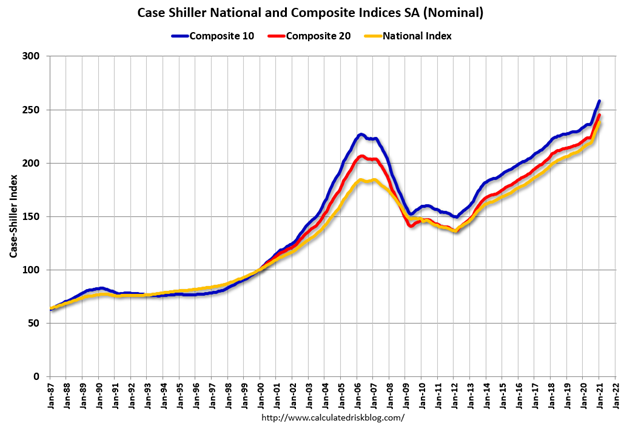
From a housing perspective, house sales have been on fire. Record-low interest rates, mortgage rates, and refinancing rates have been driving higher home purchases and rising prices. Urban flight to the suburbs has also been a big housing tailwind due to the desire for more socially distanced room, additional home office space, and expansive backyards. Adding fuel to the housing fire has been record low supply (i.e., home inventories). The robust demand is evident by the record Case-Shiller home prices (see chart below).
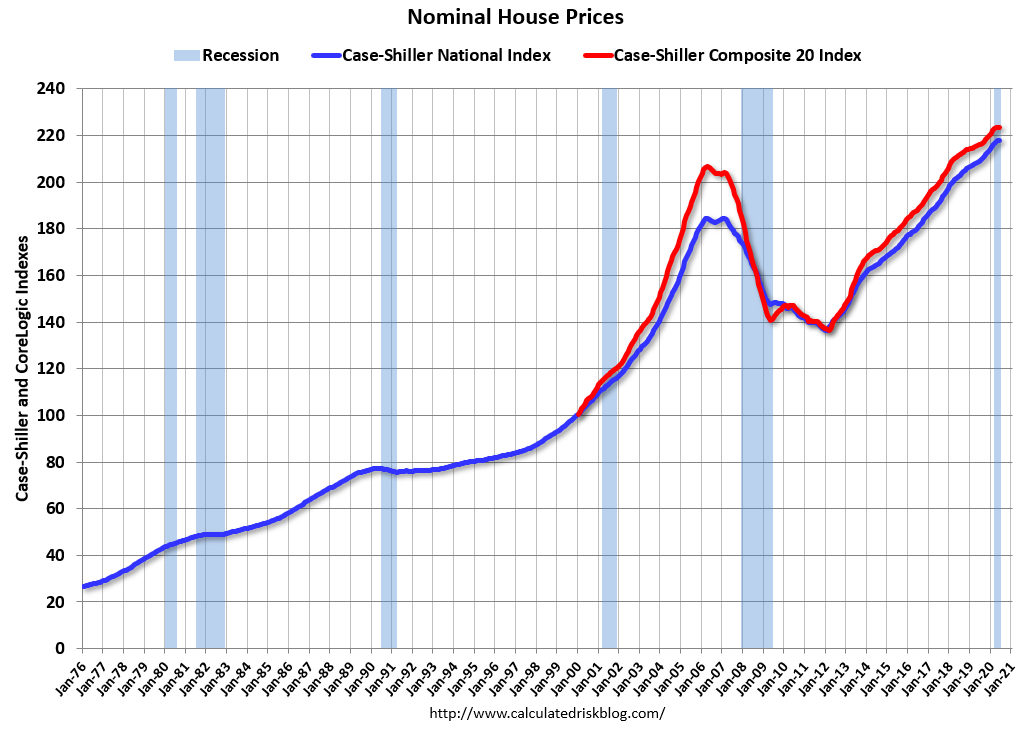
Source: Calculated Risk
There are plenty of industries hurting, including airlines, cruise lines, hotels, retailers, and restaurants but the economic rebound along with government stimulus (i.e., direct government checks and unemployment relief payments) have led to record retail sales (see chart below). Spending could cool if an additional coronavirus-related stimulus package agreement is not reached, but until the government checks stop flowing, consumers will keep spending.
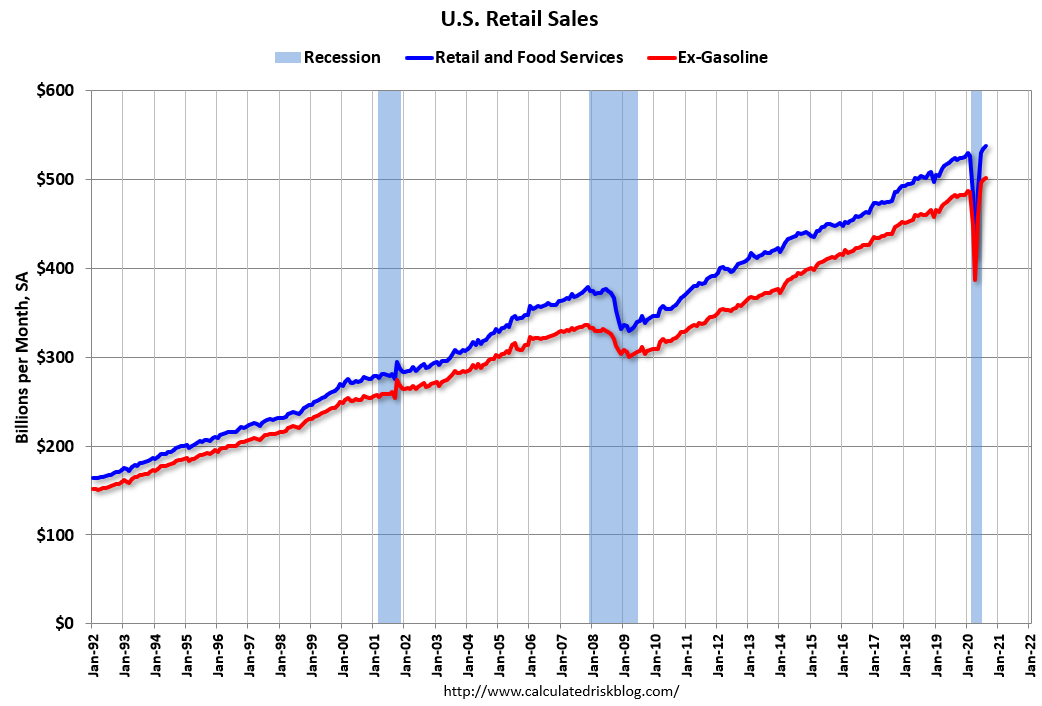
Source: Calculated Risk
Besides trillions of dollars in fiscal relief injected into the economy, the Federal Reserve has also provided trillions in unprecedented relief (see chart below) through its government and corporate bond buying programs, in addition to its Main Street Lending Program.
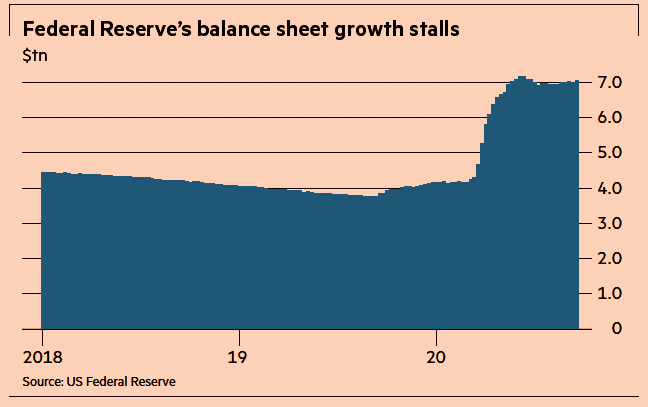
Source:The Financial Times
There has been a lot of political hocus pocus and COVID smoke & mirrors that have much of the population worried about their investments. In every presidential election, you have about half the population satisfied with the winner, and half the population disappointed in the winner…this election will be no different. The illusion of fear and chaos is bound to create some short-term financial market volatility over the next month, but behind the curtains there are numerous positive, contributing factors that are powering the economy and stock market forward. Do yourself a favor by focusing on your long-term financial future and don’t succumb to politics and COVID tricks.

Wade W. Slome, CFA, CFP®
Plan. Invest. Prosper.
This article is an excerpt from a previously released Sidoxia Capital Management complimentary newsletter (October 1, 2020). Subscribe on the right side of the page for the complete text.
DISCLOSURE: Sidoxia Capital Management (SCM) and some of its clients hold positions in certain exchange traded funds (ETFS), but at the time of publishing had no direct position in any other security referenced in this article. No information accessed through the Investing Caffeine (IC) website constitutes investment, financial, legal, tax or other advice nor is to be relied on in making an investment or other decision. Please read disclosure language on IC Contact page.
Investors Scared Silly While Stocks Enjoy Sugar High

China trade war, impeachment hearings, Brexit negotiations, changing Federal Reserve monetary policy, Turkish-Kurd battles in Syria, global slowdown fears, and worries over an inverted yield curve. Do these headlines feel like a conducive environment for stock market values to break out to new all-time, record highs? If you answered “no”, then you are not alone – investors have been scared silly despite stocks experiencing a sugar high.
For the month, the S&P 500 index climbed another +2.0% and set a new monthly-high record. The same can be said for the Dow Jones Industrial Average, which also set a new monthly record at 27,046, up +0.5% from the previous month. For the S&P 500, these monthly gains contributed to what’s become an impressive 2019 total appreciation of +21%. Normally, such heady gains would invoke broad-based optimism, however, the aforementioned spooky headlines have scared investors into a coffin as evidenced by the hundreds of billions of dollars that have poured out of stocks into risk-averse bonds. More specifically, ICI (Investment Company Institute) releases weekly asset flow figures, which show -$215 billion fleeing stock funds in 2018-2019 through the end of October, while over +$452 billion have flocked into the perceived safe haven of bonds. I emphasize the word “perceived” safe haven because many long duration (extended maturity) bonds can be extremely risky, if (when) interest rates rise materially and prices fall significantly.
Besides the data showing investors fleeing stocks and flocking to bonds, we have also witnessed the risk-averse saving behavior of individuals. When uncertainty rose in 2008 during the financial crisis, you can see how savings spiked (see chart below), even as the economy picked up steam. With the recent spate of negative headlines, you can see that savings have once again climbed and reached a record $1.3 trillion! All those consumer savings translate into dry powder spending dollars that can be circulated through the economy to extend the duration of this decade-long financial expansion.
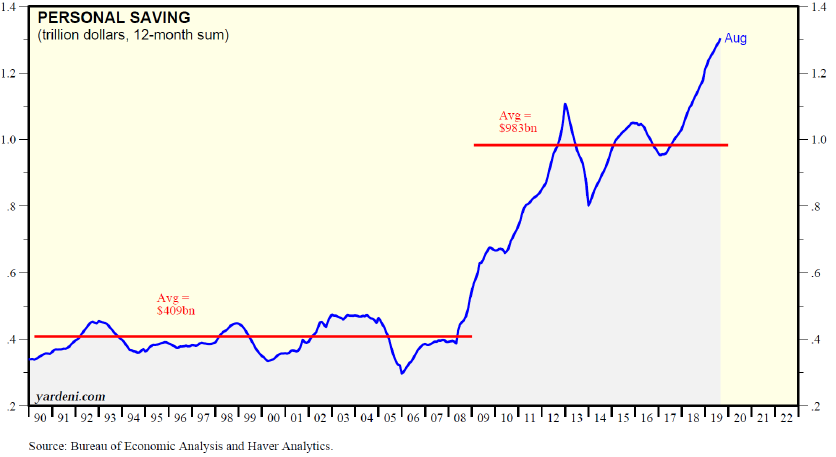
Source: Dr. Ed’s Blog
If you look at the same phenomenon through a slightly different lens, you can see that the net worth of consumer households has increased by 60% to $113 trillion from the 2007 peak of about $70 trillion (see chart below). This net worth explosion compares to only a 10% increase in household debt over the same timeframe. In other words, consumer balance sheets have gotten much stronger, which will likely extend the current expansion or minimize the blow from the next eventual recession.
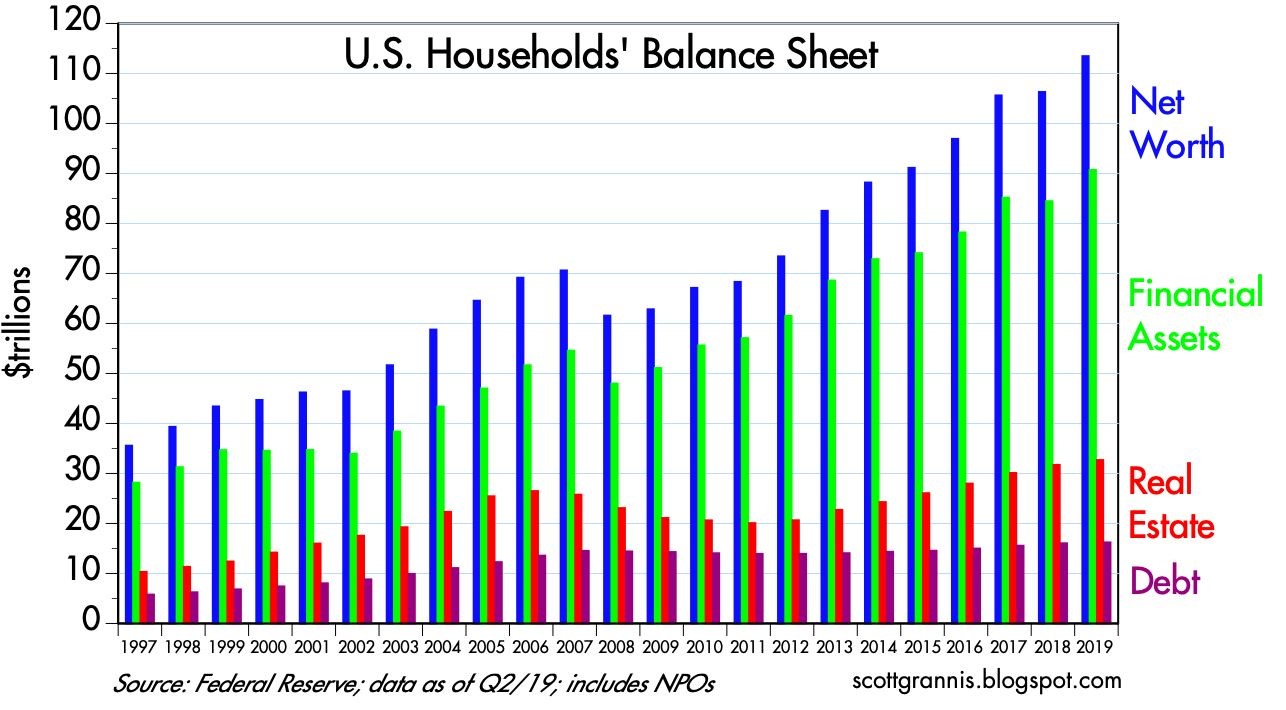
Source: Calafia Beach Pundit
If hard numbers are not good enough to convince you of investor skepticism, try taking a poll of your friends, family and/or co-workers at the office watercooler, cocktail party, or family gathering. Chances are a majority of the respondents will validate the current actions of investors, which scream nervousness and anxiety.
How does one reconcile the Armageddon headlines and ebullient stock prices? Long-time clients and followers of my blog know I sound like a broken record, but the factors underpinning the decade-long bull market bears repeating. What the stock market ultimately does care about are the level and direction of 1) corporate profits; 2) interest rates; 3) valuations; and 4) investor sentiment (see the Fool-Stool article). Sure, on any one day, stock prices may move up or down on any one prominent headline, but over the long run, the market cares very little about headlines. Our country and financial markets have survived handsomely through wars (military and trade), recessions, banking crises, currency crises, housing crises, geopolitical tensions, impeachments, assassinations, and even elections.
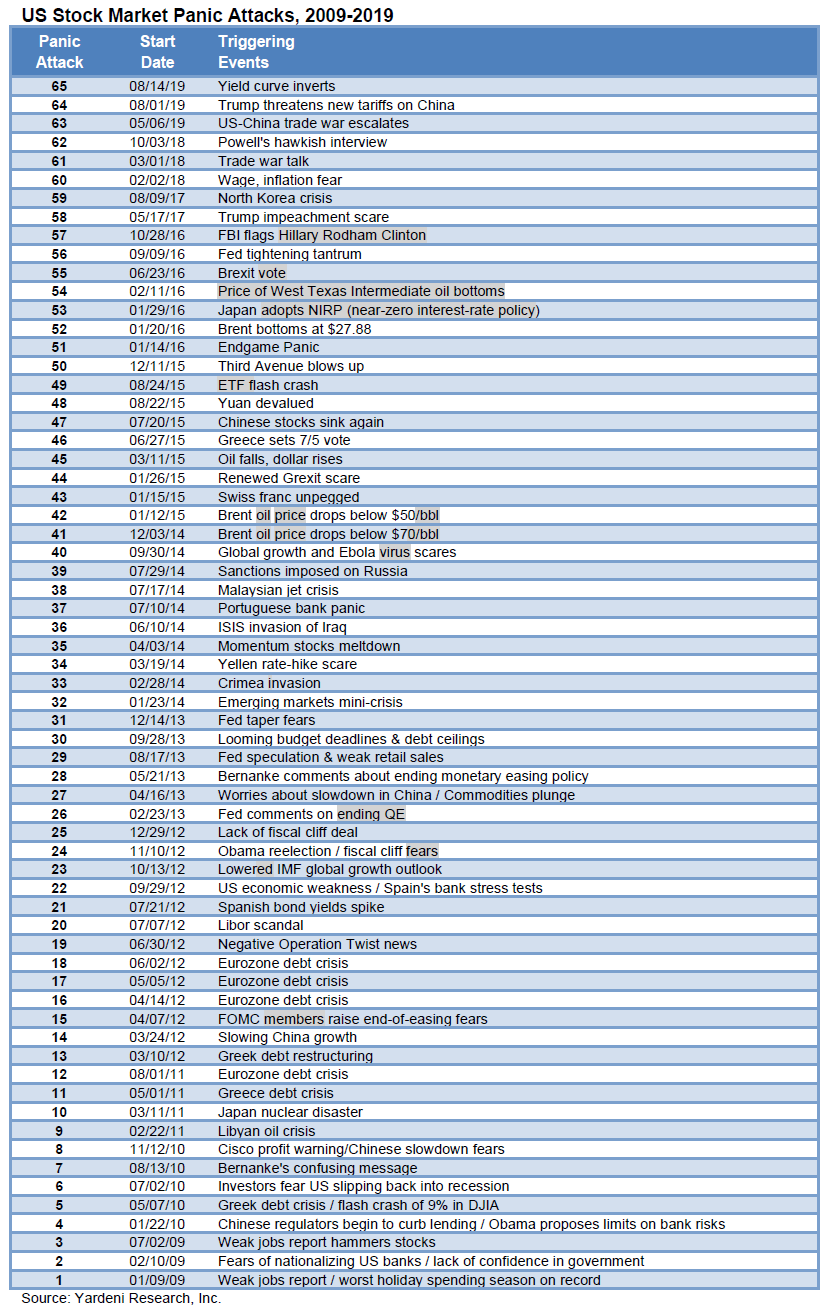
Case in point on a shorter period of time, Dr. Ed Yardeni, author of Dr. Ed’s Blog created list of 65 U.S. Stock Market Panic Attacks from 2009 – 2019 (see below). What have stock prices done over this period? From a low of 666 in 2009, the S&P 500 stock index has more than quadrupled to 3,030!
For the majority of this decade-long, rising bull market, the previously mentioned stool factors have created a tailwind for stock price appreciation (i.e., interest rates have moved lower, profits have moved higher, valuations have remained reasonable, and investors have stayed persistently nervous…a contrarian positive indicator). Investors may remain scared silly for a while, but as long as the four stock factors on balance remain largely constructive stock prices should continue experiencing a sugar high.
Wade W. Slome, CFA, CFP®
Plan. Invest. Prosper.
This article is an excerpt from a previously released Sidoxia Capital Management complimentary newsletter (November 1, 2019). Subscribe on the right side of the page for the complete text.
DISCLOSURE: Sidoxia Capital Management (SCM) and some of its clients hold positions and certain exchange traded funds (ETFs), but at the time of publishing had no direct position in any other security referenced in this article. No information accessed through the Investing Caffeine (IC) website constitutes investment, financial, legal, tax or other advice nor is to be relied on in making an investment or other decision. Please read disclosure language on IC Contact page.
Cash Flow Statement: Game of Cat & Mouse

Much like a game of a cat chasing a mouse, analyzing financial statements can be an endless effort of hunting down a company’s true underlying fundamentals. Publicly traded companies have a built in incentive to outmaneuver its investors by maximizing profits (or minimizing expenses). With the help of flexible GAAP (Generally Accepted Accounting Principles) system and loose estimation capabilities, company executives have a fair amount of discretion in reporting financial results in a favorable light. Through the appropriate examination of the cash flow statement, the cat can slow down the clever mouse, or the investor can do a better job in pinning down corporate executives in securing the truth.
Going back to 15th century Italy, users of financial statements have relied upon the balance sheet and income statement*. Subsequently, the almighty cash flow statement was introduced to help investors cut through a lot of the statement shortcomings – especially the oft flimsy income statement.
Beware of the Income Statement Cheaters
Did you ever play the game of Monopoly with that sneaky friend who seemed to win every time he controlled the money as the game’s banker? Well effectively, that’s what companies can do – they can adjust the rules of the game as they play. A few simple examples of how companies can potentially overstate earnings include the following:
- Extend Depreciation: Depreciation is an expense that is influenced by management’s useful life estimates. If a Chief Financial Officer doubles the useful life of an asset, the associated annual expense is cut in half, thereby possibly inflating earnings.
- Capitalize Expenses: How convenient? Why not just make an expense disappear by shifting it to the balance sheet? Many companies employ that strategy by converting what many consider a normal expense into an asset, and then slowly recognizing a depreciation expense on the income statement.
- Stuffing the Channel: This is a technique that forces customers to accept unwanted orders, so the company selling the goods can recognize phantom sales and income. For example, I could theoretically sell a $1 million dollar rubber band to my brother and recognize $1 million in profits (less 1-2 cents for the cost of the rubber band), but no cash will ever be collected. Moreover, as the seller of the rubber band, I will eventually have to fess-up to a $1 million uncollectible expense (“write-off”) on my income statement.
There are plenty more examples of how financial managers implement liberal accounting practices, but there is an equalizer…the cash flow statement.
Cash Flow Statement to the Rescue
Most of the accounting shenanigans and gimmicks used on the income statement (including the ones mentioned above) often have no bearing on the stream of cash payments. In order to better comprehend the fundamental actions behind a business (excluding financial companies), I firmly believe the cash flow statement is the best place to go. One way to think about the cash flow statement is like a cash register (see related cash flow article). Any business evaluated will have cash collected into the register, and cash disbursed out of it. Specifically, the three main components of this statement are Cash Flow from Operations (CFO), Cash Flow from Investing (CFI), and Cash Flow from Financing (CFF). For instance, let us look at XYZ Corporation that sells widgets produced from its manufacturing plant. The cash collected from widget sales flows into CFO, the capital cost of building the plant into CFI, and the debt proceeds to build the plant into CFF. By scrutinizing these components of the cash flow statement, financial statement consumers will gain a much clearer perspective into the pressure points of a business and have an improved understanding of a company’s operations.
Financial Birth Certificate
As an analyst, hired to babysit a particular company, the importance of determining the maturity of the client company is critical. We may know the numerical age of a company in years, however establishing the maturity level is more important (i.e., start-up, emerging growth, established growth, mature phase, declining phase)*. Start-up companies generally have a voracious appetite for cash to kick-start operations, while at the other end of the spectrum, mature companies generally generate healthy amounts of free cash flow, available for disbursement to shareholders in the form of dividends and share buybacks. Of course, some industries reach a point of decline (automobiles come to mind) at which point losses pile up and capital preservation increases in priority as an objective. Clarifying the maturity level of a company can provide tremendous insight into the likely direction of price competition, capital allocation decisions, margin trends, acquisition strategies, and other important facets of a company (see Equity Life Cycle article).
The complex financial markets game can be a hairy game of cat and mouse. Through financial statement analysis – especially reviewing the cash flow statement – investors (like cats) can more slyly evaluate the financial path of target companies (mice). Rather than have a hissy fit, do yourself a favor and better acquaint yourself with the cash flow statement.
Wade W. Slome, CFA, CFP®
Plan. Invest. Prosper.
*DISCLOSURE: Sidoxia Capital Management (SCM) and some of its clients own certain exchange traded funds, but at the time of publishing had no direct positions in any security mentioned in this article. References to content in Financial Statement Analysis (Martin Fridson and Fernando Alvarez) was used also. No information accessed through the Investing Caffeine (IC) website constitutes investment, financial, legal, tax or other advice nor is to be relied on in making an investment or other decision. Please read disclosure language on IC “Contact” page.
Balance Sheet: The Foundation for Value

Let’s talk balance sheets… how exciting! Most people would rather hear nails scratching against a chalkboard or pour lemon juice on a fresh paper-cut, rather than slice and dice a balance sheet. However, the balance sheet plays a critical role in establishing the foundational value of a business. As part of my financial statement analysis series of articles, today we will explore the balance sheet in more detail.
It’s not just legendary value investors like Warren Buffett and Benjamin Graham who vitally rely on a page filled with assets and liabilities. Modern day masters like Bill Ackman (CEO of Pershing Square Capital Management LP – read more about Bill Ackman) and Eddie Lampert (CEO of Sears Holdings – SHLD) have in recent years relied crucially on the balance sheet, and specifically on real estate values, when it came to defining investments in Target Corporation (TGT) and Sears, respectively.
Balance Sheet Description
What is the balance sheet? For starters, it is one of the three major financial statements (in addition to the “Income Statement” and “Cash Flow Statement”), which provides a snapshot summary of a company’s assets, liabilities, and shareholders’ equity on a specific date. One of the main goals of the balance sheet is to provide an equity value of the corporation (also called “book value”).
Conceptually the balance sheet concept is no different than determining the value of your home. First, a homeowner must determine the price (asset value) of the house – usually as a function of the sales price (estimated or actual). Next, the mortgage value (debt) is subtracted from the home price to arrive at the value (equity) of the homeowner’s position. The same principle applies to valuing corporations, but as you can imagine, the complexity can increase dramatically once you account for the diverse and infinite number of potential assets and liabilities a company can hold.
Metrics
Many key financial analysis metrics are derived directly from the balance sheet, or as a result of using some of its components. Here are a few key examples:
- ROE (Return on Equity): Derived by dividing the income from the income statement by the average equity value on the balance sheet. This indicator measures the profitability of a business relative to shareholders’ investments. All else equal, a higher ROE is preferred.
- P/B (Price to Book): A ratio comparing the market capitalization (total market price of all shares outstanding) of a company to its book value (equity). All else equal, a lower P/B is preferred.
- Debt/Equity or Debt/Capitalization: These ratios explain the relation of debt to the capital structure, indicating the overall amount of financial leverage a company is assuming. All else equal, lower debt ratios are preferred, however some businesses and industries can afford higher levels of debt due to a company’s cash flow dynamics.
There are many different ratios to provide insight into a company, nonetheless, these indicators provide a flavor regarding a company’s financial positioning. In addition, these ratios serve a valuable purpose in comparing the financial status of one company relative to others (inside or outside a primary industry of operation).
Balance Sheet Shortcomings
The balance sheet is primarily built upon a historical cost basis due to defined accounting rules and guidelines, meaning the stated value of an asset or liability on a balance sheet is determined precisely when a transaction occurs in time. Over time, this accounting convention can serve to significantly understate or overstate the value of balance sheet items.
Here are a few examples of how balance sheet values can become distorted:
- Hidden Assets: Not all assets are visible on the balance sheet. Certain intangible assets have value, but cannot be touched and are not recognized by accounting rules on this particular financial statement. Examples include: human capital (employees), research & development, brands, trademarks, and patents. All these items can have substantial value, yet show up nowhere on the balance sheet.
- Lack of Comparability: Comparability of balance sheet data can become fuzzy when certain accounting rules and assumptions are exercised by one company and not another. For instance, if two different companies purchased the same property, plant, and equipment at the same time and price, the values on the balance sheets may vary significantly in the future due to the application of different depreciation schedules (e.g., 10 years versus 20 years). Share repurchase is another case in point that can alter the comparison of equity values – in some cases resulting in a negative equity value.
- Goodwill & Distorted M&A Values: Companies that are active with mergers and acquisitions are forced to reprice assets and liabilities upwards and downwards (inflation, or the lack thereof, can lead to large balance sheet adjustments). Goodwill (asset) is the excess value paid over fair market value in an acquisition. Goodwill can be quite substantial in certain transactions, especially when a high premium price is paid.
- Write-offs and Write-ups: In 2001, telecom component maker JDS Uniphase (JDSU) slashed the value of its goodwill by a massive $44.8 billion. This is an extreme illustration of how the accounting-based values on the financial statement can exhibit significant differences from a company’s market capitalization. Often, the market value (the cumulative value of all outstanding market-priced shares) is a better indicator of a company’s true value – conceptually considered the present value of all future cash flows.
Some balance sheets are built on shaky foundations. A risky, debt-laden balance sheet can resemble a shoddy home foundation built on sand, along an earthquake fault-line. In other words, a small shock can lead to financial collapse. In the credit-driven global bubble we are currently working through, many companies that were built on shaky foundations (i.e., a lot of debt) are struggling to survive. Survival may be dependent on a company restructuring, selling assets, paying down debt, merging, or other tactic with the aim of shoring up the balance sheet. Using the balance sheet value of a company in conjunction with the marketplace price of the same business can be a valuable approach in establishing a more reliable valuation. Before you make an investment or valuation conclusion about a company, do yourself a favor and dig into the balance sheet to verify the condition and soundness of a company’s financial foundation.
Wade W. Slome, CFA, CFP®
Plan. Invest. Prosper.
DISCLOSURE: Sidoxia Capital Management (SCM) and some of its clients own certain exchange traded funds, but at time of publishing had no direct positions in TGT, SHLD, or JDSU. No information accessed through the Investing Caffeine (IC) website constitutes investment, financial, legal, tax or other advice nor is to be relied on in making an investment or other decision. Please read disclosure language on IC “Contact” page.
Financial Statements: Monetary X-Rays for Decision Makers

Virtually everyone has been to a doctor’s office or hospital, and at some point gotten an x-ray. Typically, multiple x-rays are taken to give the doctor adequate data for determining a patient’s health and well-being. For example, a dentist will take numerous views in searching for disease and cavities, above and below the surface of the mouth. When it comes to financial markets, the same diagnostic principles apply to securities analysis. But rather than x-rays, we have financial statements. The income statement, balance sheet, and cash flow statement provide analysts multiple angles for making a proper company diagnosis. Each financial statement provides the user a unique perspective, and together, the statements paint a more complete picture into the financial condition of a company. In the coming weeks (and months), I will take a deeper dive into the world of financial statement analysis.
Financial Statement Reporting
What is the purpose of financial statement analysis?
“The primary goal in financial reporting is the dissemination of financial statements that accurately measure the profitability and financial condition of a company.” -Howard Schilit (author of Financial Shenanigans)
Sounds simple and pure in its aim, but as we will find out, there can be more to financial statements than meets the eye (see also EPS Tricks of the Trade). In order to profit (and protect oneself), financial statement users need to read between the lines.
The Bookkeeper Police
Policing the integrity of the financial bookkeeping process are the FASB (Financial Accounting Standards Board) – the entity behind the creation of GAAP (Generally Accepted Accounting Principles) – and the SEC (Securities and Exchange Commission). Unfortunately the goals of management (maximize wealth and shareholder value) do not always align with the objectives of financial statement users (accuracy and transparency). As we found out from the case of Bernie Madoff, investors cannot always rely on the SEC for law enforcement. A deep-rooted foundation in financial statement analysis mixed in with some common sense may protect you from some major financial pitfalls.
Why are Financial Statements so Important?
Transparency of Capital Markets: Our capitalistic society is based on the trust and transparency of available financial information, so key decision makers can make informed decisions. In many emerging markets, standards are more lax and well-versed decisions are more difficult to make. Ultimately, if you believe in free markets, money migrates to where it is treated best. Reliable and transparent financial systems build investor confidence and make our system work. When companies like AIG and Enron have complex derivatives and opaque off balance sheet structures that are not clearly disclosed, then investors and key decision makers are at a disadvantage. The companies generally suffer as well, since investors afford lower valuations for complex organizations.
Investment Bankers / Sell Side Research: Investment bankers rely heavily on financial statements when determining the suitability of corporate marriage. A company cannot be bought or sold without determining an agreed-upon valuation. Financial statements help bankers establish an appropriate price for transactions.
Competitors: We live in a dog eat dog world. Assessing the strength and effectiveness of various competitor initiatives can lead to better decision making. For example, one can simply compare the revenue growth rates of two companies to determine who is gaining market share. In tough times like now, an analyst can look at items such as debt load on the balance sheet or cash generation on the cash flow statement to determine how a company is positioned to weather a potential cash crunch.
Employment/Compensation: Astute financial analysis by job seekers can lead to tremendous insights into a company’s financial condition. The process can also trigger shrewd questions to bounce back at the interviewers. Executives can also look at financial and proxy statements to uncover compensation practices of a company.
Fraud/Inaccuracies: The SEC and other regulatory agencies need tools to hunt down the bad guys and notify those stretching the letter of the law. The SEC and FASB are supposed to act as the industry financial cops. Our trust in these institutions took a deep hit when these organizations failed to catch the corrupt actions of Bernie Madoff, despite the multiple times outsiders waved red flags to the SEC.
IRS/Tax Collection: Uncle Sam wants to collect his revenue, especially in these times of large and expanding deficits. Verifying and auditing the correctness of a company’s tax liabilities can ensure correct tax revenues are accumulated.
Bankers/Creditors: Banks are becoming even more tight-fisted these days, and in order to provide loans to borrowers, financial statements become a key component of the loan equation.
Internal Finance Staff & Consultants: Chief Financial Officers and corporate finance department professionals need financial statements to steer strategy in the right direction. Many companies develop a six sigma type of approach whereby margin and cash flow improvements are targeted. In that vein, internal and external benchmarking can highlight areas of strengths and weaknesses.
For many, financial statement analysis is not the sexiest endeavor. However, I think when properly applied, the process engenders clearer and more confident decision-making. A doctor feels much the same way upon reviewing a set of accurate x-rays and making an informed patient diagnosis. Do yourself a favor and don’t ignore the financial statement components. With appropriate financial analysis, I am confident you can make healthy investment decisions too.
Wade W. Slome, CFA, CFP®
Plan. Invest. Prosper.
DISCLOSURE: Sidoxia Capital Management (SCM) and some of its clients own certain exchange traded funds, but at the time of publishing had no direct positions in AIG or other securities mentioned. No information accessed through the Investing Caffeine (IC) website constitutes investment, financial, legal, tax or other advice nor is to be relied on in making an investment or other decision. Please read disclosure language on IC “Contact” page.


