The Challenge of Defining Growth vs. Value

“A challenge only becomes an obstacle when you bow to it.”
― Ray Davis (Famous General in the Marines)
In the investing world, one major challenge is defining the differences between “growth” vs. “value”. Warren Buffett said it best when he described growth and value as two separate sides of the same coin. In general, low or declining growth will be valued less than a comparable company with faster growth. Often, most companies go through a life cycle just like a human would (see Equity Life Cycle). In other words, companies frequently start small, grow larger, mature, and then die. Of course, some companies never grow, or because of lack of funding or outsized losses, end up suffering an early death. It’s tough to generalize with companies, because some businesses are more cat-like than human. For example, Apple Inc. (AAPL) may not have had nine lives, but the stock has been left for dead several times during its lifespan, before managing to resurrect itself from value status to growth darling (with a little assistance from Steve Jobs). Whether Tim Cook can lead Apple back to the Promised Land of growth remains to be seen, but many investors still see value.
Fluctuating price and earnings trends over a company’s life cycle frequently create confusion surrounding the proper categorization of a stock as growth or value. The other frustrating aspect to this debate is the absence of a universally accepted definition of growth and value. A few specialty companies have chosen to address this challenge. Russell Investments in Seattle, Washington is a leader in the benchmark/index creation field. Russell tackles the definitional issue by creating quantitatively based definitions, tediously explained in a thrilling 44-page paper titled, “Construction and Methodology.” Here is an exhilarating excerpt:
“Russell Investments uses a ‘non-linear probability’ method to assign stocks to the growth and value style valuation indexes. Russell uses three variables in the determination of growth and value. On the value side, book-to-price is used, while on the growth side, the I/B/E/S long-term growth variable was replaced by two variables- I/B/E/S forecast medium-term growth (2 yr) and sales per share historical growth (5 yr).”
As I bite my tongue in sarcasm, I like to point out that these methodologies constantly change – Russell most recently changed their methodology in 2011. What’s more, there are numerous other indexing companies that define growth and value quite differently (e.g., Standard & Poor’s, Lipper, MSCI, etc.).
Like religious beliefs that are viewed quite differently and are prone to passionate arguments, so too can be the debates over growth vs. value categorization. I’ve been brainwashed by numerous great investors (see Investor Hall Fame), and underpinning my philosophy is the belief that price follows earnings (see It’s the Earnings Stupid). As a result, I am constantly on the lookout for attractively priced stocks that have strong growth prospects. If Russell or S&P looked under the hood of my client portfolios, I’m certain they would find a healthy mix of growth and value stocks, as they define it. If they looked in Warren Buffett’s portfolio, arguably similar conclusions could be made. Most observers call Buffett a value investor, but over Buffett’s career, he has owned some of the greatest growth stocks of all-time (e.g., Coca Cola (KO), American Express Co (AXP), and Procter & Gamble (PG)).
At the end of the day, expectations embedded in the value of share prices determine future appreciation or depreciation, depending on how actual results register relative to those expectations. If stock prices are too high (as measured by the P/E, Price/Free-Cash-Flow, or other valuation metrics), slowing growth can lead to sharp and painful price declines. On the flip side, cheap or reasonably priced stocks can experience significant price appreciation if earnings and cash flows sustainably improve or accelerate.
In my view, the greatest stock pickers think about investing like sports handicapping (see What Happens in Vegas, Stays in Las Vegas). The key isn’t buying fast growth (high P/E) or slow growth (low P/E) companies, but rather discovering which stocks are mispriced. Finding heavily shorted stocks that are poised for growth, or discovering unloved stocks with underappreciated potential are both ways to make money.
While defining growth vs. value is certainly difficult, the more important challenge is calibrating a company’s future growth expectations and determining the fair price to pay for a stock based on those prospects. Investing entails many difficulties, but categorizing investors or stocks as growth or value is a less important challenge than honing forecasting and valuation skills. Investing is challenging enough without worrying about superfluous growth vs. value definitions.
Wade W. Slome, CFA, CFP®
Plan. Invest. Prosper.
DISCLOSURE: Sidoxia Capital Management (SCM) and some of its clients hold positions in certain exchange traded funds (ETFs), and AAPL, but at the time of publishing SCM had no direct position in KO, AXP, PG, MHP, or any other security referenced in this article. No information accessed through the Investing Caffeine (IC) website constitutes investment, financial, legal, tax or other advice nor is to be relied on in making an investment or other decision. Please read disclosure language on IC Contact page.
Time to Trade in the Investment Tricycle

This article is an excerpt from a previously released Sidoxia Capital Management’s complementary newsletter (May 1, 2013). Subscribe on the right side of the page for an entire monthly update.
As the stock market continues to set new, all-time record highs and the Dow Jones Industrial index nears another historic milestone (15,000 level), investors remain cautiously skeptical of the rebound – like a nervous toddler choosing to ride a tricycle instead of a bicycle. Investors have been moving slowly, but stock prices have not – the Dow has risen +13% in 2013 alone. What’s more, over the last four years the S&P 500 index (which represents large companies) has climbed +140%; the S&P 400 (mid-sized companies) +195%; and the S&P 600 (small-sized companies) +200%.
The gains have been staggering, but like the experience of riding a bicycle, the bumps, scrapes, and bruises suffered during the 2008-2009 financial crash have caused investors to abandon their investment bikes for a perceived safer vehicle…a tricycle. What do I mean by that? Well, over the last six years, investors have pulled out more than -$521,000,000,000 from stock funds and piled those proceeds into bonds (Calafia Beach Pundit chart below). For retirees and billionaires this strategy may make sense in certain instances. But for millions of others, interest rate risk, inflation risk, and the risk of outliving your money can be more hazardous to financial well-being, than the artificially perceived safety expected from bonds. The fact of the matter is investing inefficiently in cash, money markets, CDs, and low-yielding fixed income securities can be riskier in the long-run than a globally diversified portfolio invested across a broad set of asset classes (including equities). The latter should be the strategy of choice, unless of course you are someone who yearns to work at Wal-Mart (WMT) as a greeter in your 80s!

Investor Training Wheels
 I don’t want to irresponsibly flog everyone, because investing attitudes have begun to change a little in 2013, as investors have added $66 billion to stock funds (data from ICI). Effectively, some investors have gone from riding their tricycle to hopping on a bike with training wheels. With this change in mindset, surely people have commenced selling bonds to buy stocks, right? Wrong! Investors have actually bought more bonds (+$69 billion) than stocks in the first three months of the year, which helps explain why interest rates on the 10-year Treasury are only yielding a paltry 1.67% (near last year’s record summer low) – remember, bond buying causes interest rates to go down. If you really want to do research, you could ask your parents when rates were ever this low, but some readers’ parents may not even had been born yet. The previous record low in interest rates, according to Bloomberg, at 1.95% was achieved in 1941.
Over the last five years the news has been atrocious, and as we have proven, investing based off of current headlines is a horrible investment strategy. As we’ve seen firsthand, there can be very long, multi-year periods when stock performance has absolutely no correlation with the positive or negative nature of news reports. To better make my point, I ask you, what types of headlines have you been reading over the last four years? I can answer the question for you with a few examples. For starters, we’ve endured financial collapses in Iceland, Ireland, Dubai, Greece, and now Cyprus. At home domestically, we’ve experienced a “flash crash” that temporarily evaporated about $1 trillion dollars in value (and 1,000 Dow points) within a few minutes due to high frequency algorithmic traders. How about unemployment data? We’ve witnessed the slowest, jobless U.S. recovery in a generation (since World War II), and European countries have it much worse than we do (e.g., Spain just registered a 27% unemployment rate). What about political gridlock and brinksmanship? We’ve seen debt ceiling stand-offs lead to a historic loss of our country’s AAA debt status; a partisan presidential election; a deafening fiscal cliff debate; and now mindless sequestration. Nevertheless, large cap stocks and small cap stocks have more than doubled and tripled, respectively.
Fear sells advertising, and sounds smarter than “everything is rosy,” but the fact remains, things are not as bad as many bears claim. Corporations are earning record profits, and hold trillions in cash (e.g., Apple Inc.’s recent announcement of more than $50 billion in share repurchase and $11 billion in annual dividend payments are proof). Moreover, central banks around the globe are doing whatever it takes to stimulate growth – most recently the Bank of Japan promised to inject $1.4 trillion into its economy by the end of 2014, in order to kick-start expansion. Lastly, the U.S. employment picture continues to improve, albeit slowly (7.6% unemployment in March), allowing consumers to pay down debt, buy more homes, and spend money to spur economic growth.
Dangers of Being Informed
 Hopefully this clarifies how useless and futile newspaper headlines are when it comes to effective investing. As Mark Twain astutely noted, “If you don’t read the newspaper, you are uninformed. If you do read the newspaper, you are misinformed.” It’s perfectly fine to remain in tune with current events, but shuffling around your life’s savings based on this information is a foolish plan.
If the concerns and worries du jour have you nervously riding a tricycle, just realize that you may not reach your investment destination with this mode of transportation. I understand that it is not all hearts and flowers in the financial markets, and there are plenty of legitimate risks to consider. However, excessive exposure in low-rate asset classes may be riskier than many realize. If you’re still riding your investment tricycle, you’re probably better off by grabbing a helmet and pads (i.e., globally diversified portfolio) and jumping on a bike – you are more likely to reach your financial destination.
Wade W. Slome, CFA, CFP®
Plan. Invest. Prosper.
DISCLOSURE: Sidoxia Capital Management (SCM) and some of its clients hold positions in certain exchange traded funds (ETFs), WMT and AAPL, but at the time of publishing SCM had no direct position in any other security referenced in this article. No information accessed through the Investing Caffeine (IC) website constitutes investment, financial, legal, tax or other advice nor is to be relied on in making an investment or other decision. Please read disclosure language on IC Contact page.
Bond-Choking Central Banks Expand Investment Menu

Central banks around the globe are choking on low-yielding bonds, and as result are now expanding their investment menu beyond Treasuries into equities. Expansionary monetary policies purchasing short-term, low-rate bonds means that central banks have been gobbling up securities on their balance sheets that are earning next to nothing. To counteract the bond-induced indigestion of the central banks, many of them are considering increasing their equity purchasing strategies. How can you blame them? With the 10-year U.S. Treasury notes yielding 1.66%; 10-year German bonds eking out 1.21%; and 10-year Japanese Government Bonds (JGBs) paying a paltry 0.59%, it’s no wonder central banks are looking for better alternatives.
More specifically, the Bank of Japan (BOJ) is planning to pump $1.4 trillion into its economy over the next two years to encourage some inflation through open-ended asset purchases. Earlier this month, the BOJ said it has a goal of more than doubling equity related exchange traded funds (ETFs) by the end of 2014. According to Business Insider, the BOJ is currently holding $14.1 billion in equity ETFs with an objective to reach $35.3 billion in 2014.
I can only imagine how stock market bears feel about this developing trend when they have already blamed central banks’ quantitative easing initiatives as the artificial support mechanism for stock prices (see also The Central Bank Dog Ate my Homework).
While expanded equity purchases could break the backs of bond bulls and stock naysayers, some smart people agree that this strategy makes sense. Take Jim O’Neill, the chairman of Goldman Sachs Asset Management, who is retiring next week. Here’s what he has to say about expanded central bank stock purchases:
“Frankly, it makes a huge amount of sense in a world of floating exchange rates and such incredible opportunity, why should central banks keep so much money in very short term, liquid things when they’re not going to ever need it? To help their future returns for their citizens, why would they not invest in equity?”
How big is this shift towards equities? The Royal Bank of Scotland conducted a survey of 60 central banks that have about $6.7 trillion in reserves. There were 13% of the central banks already invested in equities, and almost 25% of them said they are or will be invested in equities within the next five years.
While I may agree that stocks generally are a more attractive asset class than bubblicious bonds right now, I may draw the line once the Fed starts buying houses, gasoline, and groceries for all Americans. Until then, dividend yields remain higher than Treasury yields, and the earnings yields (earnings/price) on stocks will remain more attractive than bond yields. Once stocks gain more in price and/or bonds sell off significantly, it will be a more appropriate time to reassess the investment opportunity set. A further stock rise or bond selloff are both possible scenarios, but until then, central banks will continue to look to place its money where it is treated best.
The central bank menu has been largely limited to low-yielding, overpriced government bonds, but the appetite for new menu items has heightened. Stocks may be an enticing new option for central banks, but let’s hope they delay buying houses, gasoline, and groceries.
Wade W. Slome, CFA, CFP®
Plan. Invest. Prosper.
DISCLOSURE: Sidoxia Capital Management (SCM) and some of its clients hold positions in certain exchange traded funds (ETFs), but at the time of publishing SCM had no direct position in any other security referenced in this article. No information accessed through the Investing Caffeine (IC) website constitutes investment, financial, legal, tax or other advice nor is to be relied on in making an investment or other decision. Please read disclosure language on IC Contact page.
M&A Bankers Away as Elephant Hunters Play

With trillions in cash sitting in CEO and private equity wallets, investment bankers have been chasing mergers & acquisitions with a vengeance. Unfortunately for the bankers, investor skittishness has slowed merger activity in the boardroom. Rather than aggressively stalk corporate prey, bidders look more like deer in headlights. However, animal spirits are not completely dead. Some board members have seen the light and realize the value-destroying characteristics of idle cash in a near-zero interest rate environment, so they have decided to go elephant hunting. During a nine day period alone in the first quarter of 2013, a total of $87.7 billion in elephant deals were announced:
- HJ Heinz Company (HNZ – $27.4 billion) – February 14, 2013 – Bidder: Berkshire Hathaway (BRKA)/ 3G Capital Partners.
- Virgin Media Inc. (VMED – $21.9 billion) – February 6, 2013 – Bidder: Liberty Global Inc. (LBTYA).
- Dell Inc. (DELL – $21.8 billion) – February 5, 2013 – Bidder: Silver Lake Partners LP, Michael Dell, Carl Icahn.
- NBCUniversal Media LLC 49% Stake (GE- $17.6 billion) – February 12, 2013 – Bidder: Comcast Corp. (CMCSA).
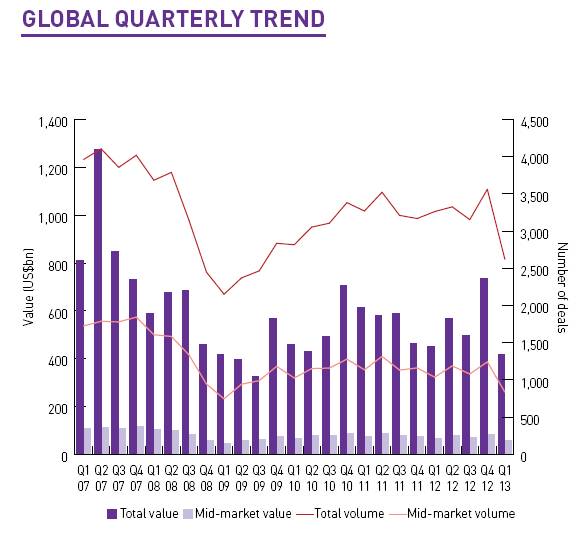
These elephant deals helped the overall M&A deal values in the United States increase by +34% in Q1 from a year ago to $167 billion (see Mergermarket report). Unfortunately, the picture doesn’t look so good on a global basis. The overall value for global M&A deals in Q1 registered $418 billion, down -7% from the first quarter of 2012. On a transaction basis, there were a total of 2,621 deals during the first three months of the year, down -20% from 3,262 deals in the comparable period last year.
Source: Mergermarket
With central banks across the globe pumping liquidity into the financial system and the U.S. stock market near record highs, one would think buyers would be writing big M&A checks as they wrote poems about rainbows, puppy dogs, and flowers. This is obviously not the case, so why such the sour mood?
The biggest scapegoat right now is Europe. While the U.S. economy appears to be slowly-but-surely plodding along on its economic recovery, Europe continues to dig a deeper recessionary hole. Austerity-driven fiscal policies are hindering growth, and concerns surrounding a Cypriot contagion continue to grab headlines. Although the U.S. dollar value of deals was up substantially in Q1, the number of transactions was down significantly to 703 deals from 925 in Q1-2012 (-24%). Besides buyer nervousness, unfriendly tax policy could have accelerated deals into 2012, and stole business from 2013.
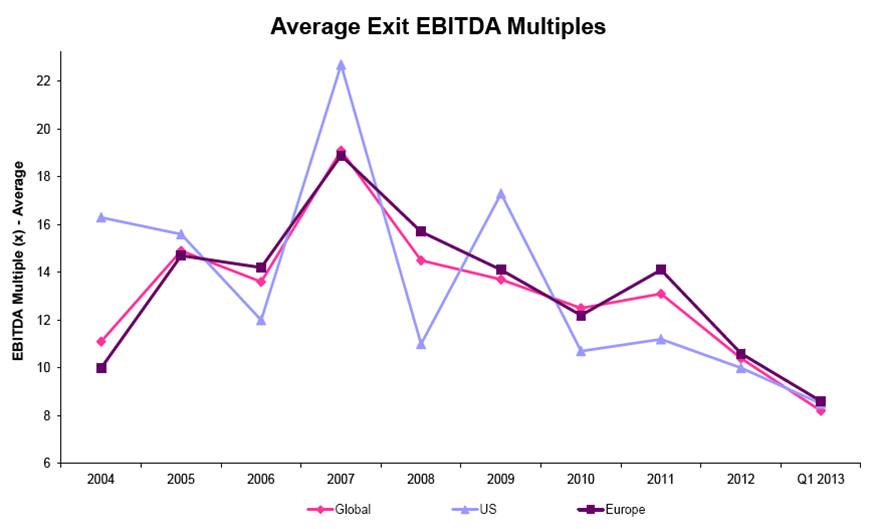
Besides lackluster global M&A volume, the record low EBITDA multiples on private equity exit prices is proof that skepticism on the sustainability of the economic recovery remains uninspired. With exit multiples at a meager level of 8.2x globally, many investors are holding onto their companies longer than they would like.
Source: Mergermarket
While merger activity has been a mixed bag, a bright spot in the M&A world has been the action in emerging markets. In 2012, the value of global transactions was essentially flat, yet emerging market deal values were up approximately +9% to $524 billion. This value exceeded the pre-crisis M&A activity level in 2007 by $73 billion, a feat not achieved in the other regions around the globe. Although emerging markets also pulled back in Q1, this region now account for 23% of total global M&A deal values.
Elephant buyout deals in the private equity space (skewed heavily by the Heinz & Dell deals) caused results to surge in this segment during the first quarter. Private equity related buyouts accounted for the highest share of global M&A activity (~21%) since 2007. However, like the overall U.S. M&A market, the number of Q1 transactions in the buyout space (372 transactions) declined to the lowest count in about four years.
Until skepticism turns into confidence, elephant deals will continue to distort results in the M&A sector (Echostar’s [DISH] play for Sprint [S] is further evidence). However, the existence of these giant transactions could be a leading indicator for more activity in the coming quarters. If bankers want to generate more fees, they may consider giving Warren Buffett a call. Here’s what he had to say after the announcement of the Heinz deal:
“I’m ready for another elephant. Please, if you see any walking by, just call me.”
Despite the weak overall M&A activity, the hunters are out there and they have plenty of ammunition (cash).
See also: Mergermarket Monthly M&A Insider Report (April 2013)
Wade W. Slome, CFA, CFP®
Plan. Invest. Prosper.
DISCLOSURE: Sidoxia Capital Management (SCM) and some of its clients hold positions in certain exchange traded funds (ETFs) and CMCSA, but at the time of publishing SCM had no direct position in HNZ, BRKA, VMED, LBTYA, DELL, GE, DISH, S or any other security referenced in this article. No information accessed through the Investing Caffeine (IC) website constitutes investment, financial, legal, tax or other advice nor is to be relied on in making an investment or other decision. Please read disclosure language on IC Contact page.
The Central Bank Dog Ate My Homework

It’s been a painful four years for the bears, including Peter Schiff, Nouriel Roubini, John Mauldin, Jimmy Rogers, and let’s not forget David Rosenberg, among others. Rosenberg was recently on CNBC attempting to clarify his evolving bearish view by explaining how central banks around the globe have eaten his forecasting homework. In other words, Ben Bernanke is getting blamed for launching the stock market into the stratosphere thanks to his quantitative easing magic. According to Rosenberg, and the other world-enders, death and destruction would have prevailed without all the money printing.
In reality, the S&P 500 has climbed over +140% and is setting all-time record highs since the market bottomed in early 2009. Despite the large volume of erroneous predictions by Rosenberg and his bear buddies, that development has not slowed the pace of false forecasts. When you’re wrong, one could simply admit defeat, or one could get creative like Rosenberg and bend the truth. As you can tell from my David Rosenberg article from 2010 (Rams Butting Heads), he has been bearish for years calling for outcomes like a double-dip recession; a return to 11% unemployment; and a collapse in the market. So far, none of those predictions have come to fruition (in fact the S&P is up about +40% from that period, if you include dividends). After being incorrect for so long, Rosenberg has switched his mantra to be bullish on pullbacks on selective dividend-paying stocks. When pushed whether he has turned bullish, here’s what Rosenberg had to say,
“So it’s not about is somebody bearish or is somebody bullish or whether you’re agnostic, it’s really about understanding what the principle driver of this market is…it’s the mother of all liquidity-driven rallies that I’ve seen in my lifetime, and it’s continuing.”
Rosenberg isn’t the only bear blaming central banks for the unexpected rise in equity markets. As mentioned previously, fear and panic have virtually disappeared, but these emotions have matured into skepticism. Record profits, cash balances, and attractive valuations are dismissed as artificial byproducts of a Fed’s monetary Ponzi Scheme. The fact that Japan and other central banks are following Ben Bernanke’s money printing lead only serves to add more fuel to the bears’ proverbial fire.
Speculative bubbles are not easy to identify before-the-fact, however they typically involve a combination of excessive valuations and/or massive amounts of leverage. In hindsight we experienced these dynamics in the technology collapse of the late-1990s (tech companies traded at over 100x’s earnings) and the leverage-induced housing crisis of the mid-2000s ($100s of billions used to speculate on subprime mortgages and real estate).
I’m OK with the argument that there are trillions of dollars being used for speculative buying, but if I understand correctly, the trillions of dollars in global liquidity being injected by central banks across the world is not being used to buy securities in the stock market? Rather, all the artificial, pending-bubble discussions should migrate to the bond market…not the stock market. All credit markets, to some degree, are tied to the trillions of Treasuries and mortgage-backed securities purchased by central banks, yet many pundits (i.e., see El-Erian & Bill Gross) choose to focus on claims of speculative buying in stocks, and not bonds.
While bears point to the Shiller 10 Price-Earnings ratio as evidence of a richly priced stock market, more objective measurements through FactSet (below 10-year average) and Wall Street Journal indicate a forward P/E of around 14. A reasonable figure if you consider the multiples were twice as high in 2000, and interest rates are at a generational low (see also Shiller P/E critique).
The news hasn’t been great, volatility measurements (i.e., VIX) have been signaling complacency, and every man, woman, and child has been waiting for a “pullback” – myself included. The pace of the upward advance we have experienced over the last six months is not sustainable, but when we finally get a price retreat, do not listen to the bears like Rosenberg. Their credibility has been shot, ever since the central bank dog ate their homework.
Wade W. Slome, CFA, CFP®
Plan. Invest. Prosper.
DISCLOSURE: Sidoxia Capital Management (SCM) and some of its clients hold positions in certain exchange traded funds (ETFs) , but at the time of publishing SCM had no direct position in any other security referenced in this article. No information accessed through the Investing Caffeine (IC) website constitutes investment, financial, legal, tax or other advice nor is to be relied on in making an investment or other decision. Please read disclosure language on IC Contact page.
Organizing Your Investment Basket

With the Easter bunny relaxing after a busy holiday, kids from all over are given the task of organizing the candy and money collected during their hunts. Investors are also constantly reminded that their portfolio eggs should not be solely placed in one basket either. Instead, investors are told to diversify their investments across a whole host of asset classes, geographies, styles, and sizes. In other words, this means investors should be spreading their money across commodity, real estate, international, emerging market, value, growth, small-cap, and large-cap investments. As Jason Zweig, journalist from a the Wall Street Journal points out, much of the diversification benefits can be achieved with relatively small change in the position count of a portfolio:
“As many studies have shown, at least 40% of the variability in returns can be reduced by moving from a single company to 20. Once a portfolio contains 20 or 30 stocks, adding more does little to damp the fluctuations in wealth over time.”
But wait. Going from one banking stock to 20 banking stocks is not going to provide you with the proper diversification you want or need. Rather, what is as important as investing across asset class, geography, style, and size, is to follow the individual stock strategies of guru Peter Lynch. In order to put his performance into perspective, Lynch’s Fidelity Magellan fund averaged +29% per year from 1977 – 1990 – almost doubling the return of the S&P 500 index for that period.
More specifically, to achieve these heroic returns, Lynch divided the stocks in his fund into the following categories:
Slow Growers: This group of stocks wasn’t Lynch’s favorite because these companies typically operate in mature industries with limited expansion opportunities. For these single-digit EPS growers, Lynch focused more on identifying high dividend-paying stocks that were trading at attractive valuations. In particular, he paid attention to a dividend-adjusted PEG ratio (Price-to-Earnings Growth). A utility company would be an example of a “Slow Grower.”
Stalwarts: These are large established companies that still have the ability to achieve +10% to +12% annual earnings growth regardless of the economic cycle. Lynch liked these stocks especially during recessions and downturns. Valuations are still very important for Stalwarts, and many of them pay dividends. An investor may not realize a “home run” with respect to returns, but a +30% to 50% return over a few years is not out of the question, if selected correctly. Former examples of “Stalwarts” include Coca Cola (KO) and Procter & Gamble (PG).
Fast Growers: This categorization applies to small aggressive firms averaging about +20% to +25% annual earnings growth. While “Fast Growers” offer the most price appreciation potential, these stocks also offer the most risk, especially once growth/momentum slows. If timed correctly, as Lynch adeptly achieved, these stocks can increase multi-fold in value. The great thing about these “Fast Growers” is they don’t have to reside in fast growth industries. Lynch actually preferred market share gainers in legacy industries.
Cyclicals: These companies tend to see their sales and profits rise and fall with the overall economic cycle. The hyper-sensitivity to economic fluctuations makes the timing on these stocks extremely tricky, leading to losses and tears – especially if you get in too late or get out too late. To emphasize his point, Lynch states, “Cyclicals are like blackjack: stay in the game too long and it’s bound to take all your profit.” The other mistake inexperienced investors make is mistaking a “Cyclical” company as a “Stalwart” at the peak of a cycle. Examples of cyclical industries include airline, auto, steel, travel, and chemical industries.
Turnarounds: Lynch calls these stocks, “No Growers,” and they primarily of consist of situations like bail-outs, spin-offs, and restructurings. Unlike cyclical stocks, “Turnarounds” are usually least sensitive to the overall market. Even though these stocks are beaten down or depressed, they are enormously risky. Chyrysler, during the 1980s, was an example of a favorable Lynch turnaround.
Asset Plays: Overlooked or underappreciated assets such as real estate, oil reserves, patented drugs, and/or cash on the balance sheet are all examples of “Asset Plays” that Lynch would consider. Patience is paramount with these types of investments because it may take considerable time for the market to recognize such concealed assets.
Worth noting is that not all stocks remain in the same Lynch category. Apple Inc. (AAPL) is an example of a “Fast Grower” that has migrated to “Stalwart” or “Slow Grower” status, therefore items such as valuation and capital deployment (dividends and share buyback) become more important.
Peter Lynch’s heroic track record speaks for itself. Traditional diversification methods of spreading your eggs across various asset class baskets is useful, but this approach can be enhanced by identifying worthy candidates across Lynch’s six specific stock categories. Hunting for these winners is something Lynch and the Easter bunny could both agree upon.
Wade W. Slome, CFA, CFP®
Plan. Invest. Prosper.
DISCLOSURE: Sidoxia Capital Management (SCM) and some of its clients hold positions in certain exchange traded funds (ETFs) and AAPL, but at the time of publishing SCM had no direct position in KO, PG, Chrysler, Fidelity Magellan, or any other security referenced in this article. No information accessed through the Investing Caffeine (IC) website constitutes investment, financial, legal, tax or other advice nor is to be relied on in making an investment or other decision. Please read disclosure language on IC Contact page.
Stock Market at Record Highs…April Fool’s?

Article is an excerpt from previously released Sidoxia Capital Management’s complementary April 1, 2013 newsletter. Subscribe on right side of page.
April Fool’s Day has been around for centuries and has provided an opportunity for foolish pranks to be played on the masses around the world. Evidence of the global practice can be found from the bumper spaghetti harvest in Switzerland filmed by the BBC in 1957. The video footage (click here) was so convincing, viewers called and asked how they could grow their own spaghetti.
A cruel prank has also been played on investing skeptics as they have watched the S&P 500 and Dow Jones Industrials indexes catapult to new record highs over the last five quarters (up +25% & +19%, respectively). How can the stock market be setting new records when we have recently experienced a fiscal cliff, sequestration, a deepening European recession, slowing corporate profit growth, anemic GDP (Gross Domestic Product) expansion (0.4% last quarter), and a $13 billion Cyprus bailout?
The short answer is the economy continues to improve at a steady pace; stock prices are attractive; and gloomy headlines sell more advertisements in newspapers, magazines and on television. Is this wealth explosion a practical joke, or how can we help better explain this surprising phenomenon?
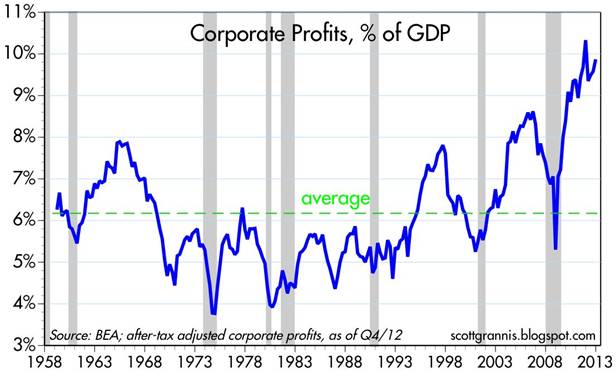
1) Record Corporate Profits
Source: Scott Grannis
Corporate profits are at record levels. After the worst financial crisis in a generation, companies have become mean and lean. They are hiring cautiously to maintain healthy profit margins, but also investing into productivity-improving technology and equipment.
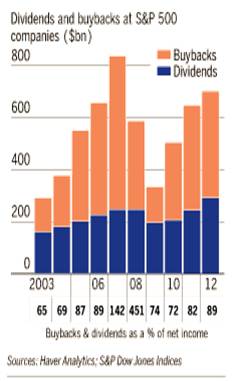
2) Record Dividends and Share Buybacks Galore
Source: WSJ
Annual dividend payments have reached a record level of more than $300 billion for S&P 500 companies, and there are no signs of this trend slowing down. This is occurring just as interest rates on bonds have been continuing to decline. Tack on a few hundred billion dollars in share buybacks to boost stock prices, and you get a recipe investors are enjoying.
3) Housing on the Comeback Trail
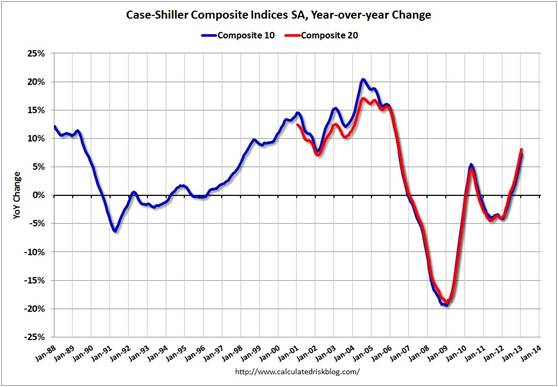
Source: Calculated Risk
Housing accounts for a significant portion of our economy. After several years of depression-like activity, this sector is on the comeback trail. In fact, the S&P/Case-Shiller index, that measures home prices in 20 major metropolitan cities, rose by +8.1% in the most recent reported figure. This increase was the largest gain in six-and-a-half years. This is important because the improvement in housing filters through to other major sectors of the economy, such as retail (e.g., furniture), banking (e.g., mortgages), and government (e.g., property taxes).
4) Consumer Spending Can’t be Killed
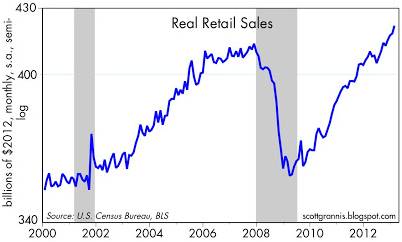
Source: Scott Grannis
Like a cockroach, the consumer is tough to exterminate. Consumer spending accounts for roughly 70% of the economy’s goods and services, and as you can see from the chart above, people are still shopping – despite domestic and international challenges.
The net result of all these trends is that the economic picture continues to improve and consumers and investors alike are beginning to feel better about themselves. And how could they not? As evidenced by the chart below, household net worth has reached a record level of about $66 trillion dollars, thanks to rallies in the stock market and home process, combined with a renewed conviction of keeping debt in check.
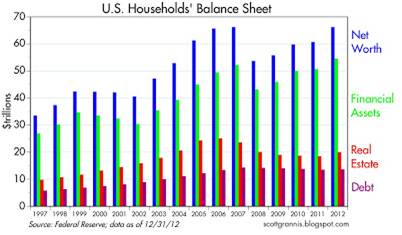
Source: Scott Grannis
Cyprus Side Notes

Over the last month, an avalanche of headlines, relating to the dire financial condition of Cyprus and Cypriot banks, has cascaded across the major media outlets. In analyzing the situation, there were two major questions I wanted answered:
Question #1: What is going on in Cyprus?
As it relates to this tiny island, approximately the size of Puerto Rico (east of Greece and south of Turkey), the first thing I learned is that the Cyprus situation is another example of a country’s financial sector gone wild. By some estimates the size of Cypriot bank deposits were more than 4x’s the size of its GDP. A key driving force behind the oversized banking industry is Russian depositors, who make up about 1/3 of overall Cypriot banking deposits. Cyprus acted as a sort of Cayman Islands in the Mediterranean for these wealthy Russians, who moved billions of dollars to the island after the Soviet Union broke apart in the early 1990s. The main attraction for the Russians were the lax banking laws and generous tax advantages.
In order to clean up this financial mess, the so-called adults or Troika, made up of the European Central Bank (ECB), International Monetary Fund (IMF), and European Commission (EU legislative body), approved a $13 billion bailout for Cyprus on the condition they restructured their main banks (Laiki Bank to be merged into Bank of Cyprus). The end result is that Cyprus (like Greece) chose to take the harsh medicine and stay in the eurozone by combining/closing banks and instituting significant losses on those depositors with more than $130,000 in their accounts (with some depositors expected to lose -60% of their money).
Question #2: Should I care?
The short answer is “No”. With a population of about 850,000 people, Cyprus is home to about the same number of folks who live in Birmingham, Alabama. Moreover, the size of Cyprus’ economy is barely 0.2% of euro-land GDP. Many pessimistic bears acknowledge the infinitesimal size of the Cypriot economy, but position the country as the domino about to topple the rest of Europe, including the much more important countries of Spain and Italy. The fact that private depositors are feeling a larger brunt of the pain rather than public taxpayers is actually a healthy long-term trend that will force more responsible behavior by other European financial institutions outside Cyprus.
In the face of the noisy Cyprus sideshow and endless economic/political worries, our corporate profit machine continues to churn out escalating profits,
as our stock markets set new record highs and our economy gains momentum. Today may be April Fool’s Day, but don’t become bamboozled by silly diversions, this stock market is no joke.
Wade W. Slome, CFA, CFP®
Plan. Invest. Prosper.
DISCLOSURE: Sidoxia Capital Management (SCM) and some of its clients hold positions in certain exchange traded funds (ETFs), but at the time of publishing SCM had no direct position in any security referenced in this article. No information accessed through the Investing Caffeine (IC) website constitutes investment, financial, legal, tax or other advice nor is to be relied on in making an investment or other decision. Please read disclosure language on IC Contact page.
March Madness Brings Productivity Sadness

You feel that scratchy throat coming on? Taking a long lunch to discuss business? Has there been a death in the family? Don’t feel bad about calling in sick or being unproductive during March Madness, the multi-week annual NCAA college basketball tournament, because you are not alone. According to Challenger, Gray and Christmas, 3.0 million people plan to watch up to three hours of basketball games during work hours, costing companies and the economy at least $134 million in lost wages during the first two days of the tournament. What’s more, March Madness tends to attract other unproductive habits in the form of illegal gambling to the tune of $2.5 billion each year (source: FBI).
While I don’t have the time to spend hours filling out a 64-team bracket, I can’t do all the finger-pointing – I too participate in my fair share of unproductive lollygagging. I’ve been known to throw away hours of my time scrolling through my Twitter news feed (twitter.com/WadeSlome) or paging through my Flipboard timelines. Heck, if you really want to talk about unproductive, the President of the United States even filled out a bracket (click here) – so far, so good, but his Wisconsin pick didn’t help his cause.
If you need more proof of our country’s collective lack of productivity, then consider the following:
- Fantasy Fun: In 2008, there were 35 million people (mostly men) participating in fantasy football at a cost of $6.5 billion over a 17-week NFL season (source: Challenger, Gray and Christmas).
- The Juice: The 1995 O.J. Simpson verdict cost the country $480 million in lost output and the New York Stock Exchange trading volume plummeted by 41% during the half hour surrounding the reading of the verdict (source: Alan Dershowitz’s America on Trial).
- Shop until You Drop: “Cyber Monday” is one of the largest online shopping days of the year, which occurs shortly after Thanksgiving’s “Black Friday”. Workers wasted $488 million of their time in 2007, and that number has undoubtedly increased significantly since then (source: Challenger, Gray and Christmas).
- Summer Sport: In 2012, Captivate Network found out that workers watching the Summer Olympics at the office resulted in a productivity loss of $650 million.
- Hangover Hammer: Super Bowl Sunday is one of the largest alcohol consumption evenings of the year. The U.S. Center for Disease Control estimates that hangovers cost our nation about $160.5 billion annually.
- Social Media Profit Black Hole: Are you addicted to Facebook (FB), Twitter, LinkedIn (LNKD) or other social media network of choice? A report by LearnStuff shows that Americans spend as much time collectively on social media in one day as they do watching online movies in a year. The cost? A whopping 4.4% of GDP or $650 billion.
Investor Madness
One of the biggest black hole productivity drains for investors is the endless deluge of foreboding news items – each story potentially becoming the next domino to collapse the global economy. The most productive use of time is an offensive strategy focused on identifying the best investment opportunities that meet lasting financial objectives. Reading prospectuses, annual reports, and quarterly financial results may not be as sexy as scanning the latest Twitter-worthy headline, but detailed research and questioning goes a long way towards producing superior long-term returns.
On the other hand, news-driven fears that cause investment paralysis can cause irreparable damage. A counter greed-driven performance chasing strategy will lead to tears as well. It’s OK to read the newspaper in order to be informed about long term trends and economic shifts, but as Mark Twain says, “If you don’t read the newspaper, you are uninformed. If you do read the newspaper, you are misinformed.”
While March Madness may not be the most productive time of the year, when your sore throat clears or you get back from that late lunch, it behooves you to become more productive with your investment strategies. Picking the wrong investment players on your portfolio team may turn March Madness into investor sadness.
Wade W. Slome, CFA, CFP®
Plan. Invest. Prosper.
DISCLOSURE: Sidoxia Capital Management (SCM) and some of its clients hold positions in certain exchange traded funds (ETFs), but at the time of publishing SCM had no direct position in FB, LNKD, Twitter, or any other security referenced in this article. No information accessed through the Investing Caffeine (IC) website constitutes investment, financial, legal, tax or other advice nor is to be relied on in making an investment or other decision. Please read disclosure language on IC Contact page.
Damned if You Do, and More Damned if You Don’t

Source: Photobucket
In the stock market you are damned if you do, and more damned if you don’t.
There are a million reasons why the market should or can go down, and the press, media, and bears come out with creative explanations every day. The “Flash Crash,” debt ceiling debate, credit downgrades, elections, and fiscal cliff were all credible events supposed to permanently crater the market. Now we have higher taxes (capital gains, income, and payroll), sequester spending cuts, and a nagging recession in Europe. What’s more, the pessimists point to the unsustainable nature of elevated corporate profit margins, and use the ludicrous Robert Shiller 10-year Price-Earnings ratio as evidence of an expensive market (see also Foggy Rearview Mirror). If an apple sold for $10 ten days ago and $0.50 today, would you say, I am not buying an apple today because the 10-day average price is too high? If you followed Robert Shiller’s thinking, this logic would make sense.
Despite the barrage of daily concerns and excuses, the market continues to set new record highs and the S&P 500 is up by more than +130% since the 2009 lows – just a tad higher than the returns earned on cash, gold, and bonds (please note sarcasm). Cash has trickled into equities for the first few months of 2013 after years of outflows, but average investors have only moved from fear to skepticism (see also Investing with the Sentiment Pendulum ). With cash and bonds earning next to nothing; gold underperforming for years; and inflationary pressures eroding long-term purchasing power, the vice is only squeezing tighter on the worrywarts.
Are there legitimate reasons to worry? Certainly, and the opportunities are not what they used to be a few years ago (see also Missing the Pre-Party). Although an endangered species, long-term investors understand backwards looking economic news is useless. Or as Peter Lynch wisely stated, “If you spend 13 minutes a year on economics, you’ve wasted 10 minutes.” The fact remains that the market is up 70% of the time, on an annual basis, and has been a great place to beat inflation over time. It’s a tempting endeavor to avoid the down markets that occur 30% of the time, but those who try to time the market fail miserably over the long-run (see also Market Timing Treadmill).
Equity investors would be better served by looking at their investment portfolios like real estate. Homeowners implicitly know the value of their home changes on a daily basis, but there are no accurate, real-time quotes to reference your home value on a minute by minute basis, as you can with stocks. Most property owners know that real estate is a cyclical asset class that is not impacted by daily headlines, and if purchased at a reasonable price, will generally go up in value over many years. Unfortunately, for many average investors, equity portfolios are treated more like gambling bets in Vegas, and get continually traded based on gut instincts.
Volatility is at six-year lows, and investors are getting less uncomfortable with owning stocks. Although everybody and their mother has been waiting for a pullback (myself included), don’t get too myopically focused. For the vast majority of investors, who should have more than a ten year time horizon, you should understand that volatility is normal and recessions will cause stocks to gown significantly, twice every ten years on average. If you are a long-term investor, like you should be, and you understand these dynamics, then you will also understand that you will be more damned if you don’t invest in equities as part of a diversified portfolio.
Wade W. Slome, CFA, CFP®
Plan. Invest. Prosper.
DISCLOSURE: Sidoxia Capital Management (SCM) and some of its clients hold positions in certain exchange traded funds (ETFs), but at the time of publishing SCM had no direct position in any other security referenced in this article. No information accessed through the Investing Caffeine (IC) website constitutes investment, financial, legal, tax or other advice nor is to be relied on in making an investment or other decision. Please read disclosure language on IC Contact page.
Fine Tuning Your Stock Fishing Skills

If you are one of those fishing hobbyists crowded among a large group while hunting for a big fish, mathematics dictates your odds of reeling in a grand prize are significantly diminished. Expert fishermen are generally the first to arrive because they understand once the masses appear the opportunities will disappear. Like big fish, colossal stocks are rarely discovered by a large herd of investors. Financial bubbles occur in this manner, however these periods are usually short-lived and the investor pack often ends up losing more money on the way down relative to the profits earned on the way up. Successful investors are usually the ones following a disciplined systematic approach that is often contrarian in nature. In other words, not chasing performance requires patience, an elusive quality in these fast-paced, frenetic financial markets.
More prevalent in these markets are impulsive day-traders, unruly high frequency traders, and tempestuous hedge funds. Why own stocks, if you can rent them? Like a fisherman who constantly casts his/her bait in and out of the water, a short-sighted investor cannot realize outsized gains, unless the bait is given sufficient time to lure (find) the next winning idea.
Like many professions, experts often optimally mix the quantitative science and behavioral art of their craft. Whether it’s a teacher, doctor, accountant, attorney, or bus driver, the people who excel in their profession are the ones who move beyond the statistical and procedural basics of their trade. Practicing and understanding the nuts and bolts of your job is important, but developing those intangible, artistic skills only comes with experience. Unfortunately, many investing hobbyists don’t appreciate these artistic nuances and as a result go on destroying their portfolios, even though they act as if they were experts.
On the flip-side, decisions purely based on gut instincts will also lead to sub-par outcomes. The fisherman who does not account for the wind, temperature, geography, light, and seasonal differences will be at a distinct disadvantage to those who have studied these scientific factors.
In the fishing world, there is no miracle GPS device that will guide fish onto your hook, and the same is true for stocks. No software package or technical pattern will be a panacea for profits, however having some type of scientific tool to assist in the identification of investment opportunities should be exploited to its fullest. For us at Sidoxia Capital Management (www.Sidoxia.com), our tool is called SHGR (pronounced “SUGAR”), or Sidoxia Holy Grail Ranking. The name was created tongue-in-cheek; however its purpose is crucial. Following a quantitative system like SHGR ensures that a healthy dosage of discipline and objectivity is factored into our investment decisions, so inherent biases do not creep into our process and detract from performance. Specifically, our proprietary SHGR model incorporates multiple factors, including valuation, growth, sentiment indicators, profitability, and other qualitative measurements.
Although we use a “Holy Grail” ranking system, the fact of the matter is there are none in existence – for fishermen or investors. Experience teaches us the best opportunities are found where few are looking, and if proper quantitative tools are integrated into a multi-pronged process, then you will be uniquely positioned to catch a big fish.
Wade W. Slome, CFA, CFP®
Plan. Invest. Prosper.
DISCLOSURE: Sidoxia Capital Management (SCM) and some of its clients hold positions in certain exchange traded funds (ETFs) and CMCSA, but at the time of publishing SCM had no direct position in BRKB, HNZ, HRL, UL, T, VZ, CAR, ZIP, AMR, LCC, ORCL, APKT, DELL, MSFT, RDSA, Repsol, ODP, OMX, HLF, BUD, STZ, GE, or any other security referenced in this article. No information accessed through the Investing Caffeine (IC) website constitutes investment, financial, legal, tax or other advice nor is to be relied on in making an investment or other decision. Please read disclosure language on IC Contact page.


