10 Ways to Destroy Your Portfolio

With the increased frequency of heightened volatility, investing has never been as challenging as it is today. However, the importance of investing has never been more crucial either, due to rising life expectancies, corrosive effects of inflation, and the uncertainty surrounding the sustainability of government programs like Social Security, Medicare, and pensions.
If you are not wasting enough money from our structurally flawed and loosely regulated investment industry that is inundated with conflicts of interest, here are 10 additional ways to destroy your investment portfolio:
#1. Watch and React to Sensationalist News Stories: Typically, strategists and pundits do a wonderful job of parroting the consensus du jour. With the advent of the internet, and 24/7 news cycles, it is difficult to not get caught up in the daily vicissitudes. However, the accuracy of the so-called media experts is no better than weather forecasters’ accuracy in predicting the weather three Saturdays from now at 10:23 a.m. Investors would be better served by listening to and learning from successful, seasoned veterans (see Investing Caffeine Profiles).
#2. Invest for the Short-Term and Attempt Market Timing: Investing is a marathon, and not a sprint, yet countless investors have the arrogance to believe they can time the market. A few get lucky and time the proper entry point, but the same investors often fail to time the appropriate exit point. The process works similarly in reverse, which hammers home the idea that you can be 200% wrong when you are constantly switching your portfolio positions.
#3. Blindly Invest Without Knowing Fees: Like a dripping faucet, fees, transaction costs, taxes, and other charges may not be noticeable in the short-run, but combined, these portfolio expenses can be devastating in the long-run. Whether you or your broker/advisor knowingly or unknowingly is churning your account, the practice should be immediately halted. Passive investment products and strategies like ETFs (Exchange Traded Funds), index funds, and low turnover (long time horizon / tax-efficient) investing strategies are the way to go for investors.
#4. Use Technical Analysis as a Primary Strategy: Warren Buffett openly recognizes the problem with technical analysis as evidenced by his statement, “I realized technical analysis didn’t work when I turned the charts upside down and didn’t get a different answer.” Legendary fund manager Peter Lynch adds, “Charts are great for predicting the past.” Most indicators are about as helpful as astrology, but in rare instances some facets can serve as a useful device (like a Lob Wedge in golf).
#5. Panic-Sell out of Fear & Panic-Buy out of Greed: Emotions can devastate portfolio returns when investors’ trading activity follows the herd in good times and bad. As the old saying goes, “The herd is lead to the slaughterhouse.” Gary Helms rightly identifies the role that overconfidence plays when ininvesting when he states,”If you have a great thought and write it down, it will look stupid 10 hours later.” The best investment returns are earned by traveling down the less followed path. Or as Rob Arnott describes, “In investing, what is comfortable is rarely profitable.” Get a broad range of opinions and continually test your investment thesis to make sure peer pressure is not driving key investment decisions.
#6. Ignore Valuation and Yield: Valuation is like good pitching in baseball…very important. Valuation may not cause all of your investments to win, but this factor should be an integral part of your investment process. Successful investors think about valuation similarly to skilled sports handicappers. Steven Crist summed it up beautifully when he said, “There are no ‘good’ or ‘bad’ horses, just correctly or incorrectly priced ones.” The same principle applies to investments. Dividends and yields should not be overlooked – these elements are an essential part of an investor’s long-run total return.
#7. Buy and Forget: “Buy-and-hold” is good for stocks that go up in price, and bad for stocks that go flat or decline in value. Wow, how deeply profound. As I have written in the past, there are always reasons of why you should not invest for the long-term and instead sell your position, such as: 1) new competition; 2) cost pressures; 3) slowing growth; 4) management change; 5) excessive valuation; 6) change in industry regulation; 7) slowing economy; 8 ) loss of market share; 9) product obsolescence; 10) etc, etc, etc. You get the idea.
#8. Over-Concentrate Your Portfolio: If you own a top-heavy portfolio with large weightings, sleeping at night can be challenging, and also force average investors to make bad decisions at the wrong times (i.e., buy high and sell low). While over-concentration can be risky, over-diversification can eat away at performance as well – owning a 100 different mutual funds is costly and inefficient.
#9. Stuff Money Under Your Mattress: With interest rates at the lowest levels in a generation, stuffing money under the mattress in the form of CDs (Certificates of Deposit), money market accounts, and low-yielding Treasuries that are earning next to nothing is counter-productive for many investors. Compounding this problem is inflation, a silent killer that will quietly disintegrate your hard earned investment portfolio. In other words, a penny saved inefficiently will lead to a penny depreciating rapidly.
#10. Forget Your Mistakes: Investing is difficult enough without naively repeating the same mistakes. As Albert Einstein said, “Insanity is doing the same thing, over and over again, but expecting different results.” Mistakes will be made and it behooves investors to document them and learn from them. Brushing your mistakes under the carpet may make you temporarily feel better emotionally, but will not help your financial returns.
As the year approaches a close, do yourself a favor and evaluate whether you are committing any of these damaging habits. Investing is tough enough already, without adding further ways of destroying your portfolio.

Wade W. Slome, CFA, CFP®
Plan. Invest. Prosper.
DISCLOSURE: Sidoxia Capital Management (SCM) and some of its clients own certain exchange traded funds, but at the time of publishing SCM had no direct position in any other security referenced in this article. No information accessed through the Investing Caffeine (IC) website constitutes investment, financial, legal, tax or other advice nor is to be relied on in making an investment or other decision. Please read disclosure language on IC “Contact” page.
Bargain Hunting for Doorbuster Discounts

This article is an excerpt from a previously released Sidoxia Capital Management complimentary newsletter (December 1, 2015). Subscribe on the right side of the page for the complete text.
It’s that time of year again when an estimated 135 million bargain shoppers set aside personal dignity and topple innocent children in the name of Black Friday holiday weekend, doorbuster discounts. Whether you are buying a new big screen television at Amazon for half-off or a new low-cost index fund, everyone appreciates a good value or bargain, which amplifies the importance of the price you pay. Even though consumers are estimated to have spent $83 billion over the post-turkey-coma, holiday weekend, this spending splurge only represents a fraction of the total 2015 holiday shopping season frenzy. When all is said and done, the average person is projected to dole out $805 for the full holiday shopping season (see chart below) – just slightly higher than the $802 spent over the same period last year.

While consumers have displayed guarded optimism in their spending plans, Americans have demonstrated the same cautiousness in their investing behavior, as evidenced by the muted 2015 stock market gains. More specifically, for the month of November, stock prices increased by +0.32% for the Dow Jones Industrial Average (17,720) and +0.05% for the S&P 500 index (2,080). For the first 11 months of the year, the stock market results do not look much different. The Dow has barely slipped by -0.58% and the S&P 500 has inched up by +1.01%.
Given all the negative headlines and geopolitical concerns swirling around, how have stock prices managed to stay afloat? In the face of significant uncertainty, here are some of the calming factors that have supported the U.S. financial markets:
- Jobs Piling Up: The slowly-but-surely expanding economy has created about 13 million new jobs since late 2009 and the unemployment rate has been chopped in half (from a peak of 10% to 5%).

Source: Calafia Beach Pundit
- Housing Recovery: New and existing home sales are recovering and home prices are approaching previous record levels, as the Case-Shiller price indices indicate below.

Source: Calculated Risk Blog
- Strong Consumer: Cars are flying off the shelves at a record annualized pace of 18 million units – a level not seen since 2000. Lower oil and gasoline prices have freed up cash for consumers to pay down debt and load up on durable goods, like some fresh new wheels.

Source: Calculated Risk Blog
Despite a number of positive factors supporting stock prices near all-time record highs and providing plenty of attractive opportunities, there are plenty of risks to consider. If you watch the alarming nightly news stories on TV or read the scary newspaper headlines, you’re more likely to think it’s Halloween season rather than Christmas season.
At the center of the recent angst are the recent coordinated terrorist attacks that took place in Paris, killing some 130 people. With ISIS (Islamic State of Iraq and Syria) claiming responsibility for the horrific acts, political and military resources have been concentrated on the ISIS occupied territories of Syria and Iraq. Although I do not want to diminish the effects of the appalling and destructive attacks in Paris, the events should be placed in proper context. This is not the first or last large terrorist attack – terrorism is here to stay. As I show in the chart below, there have been more than 200 terrorist attacks that have killed more than 10 people since the 9/11 attacks. Much of the Western military power has turned a blind eye towards these post-9/11 attacks because many of them have taken place off of U.S. or Western country soil. With the recent downing of the Russian airliner (killing all 224 passengers), coupled with the Paris terror attacks, ISIS has gained the full military attention of the French, Americans, and Russians. As a result, political willpower is gaining momentum to heighten military involvement.

Source: Wikipedia
Investor anxiety isn’t solely focused outside our borders. The never ending saga of when the Federal Reserve will initiate its first Federal Funds interest rate target increase could finally be coming to an end. According to the CME futures market, there currently is a 78% probability of a 0.25% interest rate increase on December 16th. As I have said many times before, interest rates are currently near generational lows, and the widely communicated position of Federal Reserve Chairwoman Yellen (i.e., shallow slope of future interest rate hike trajectory) means much of the initial rate increase pain has likely been anticipated already by market participants. After all, a shift in your credit card interest rate from 19.00% to 19.25% or an adjustment to your mortgage rate from 3.90% to 4.15% is unlikely to have a major effect on consumer spending. In fact, the initial rate hike may be considered a vote of confidence by Yellen to the sustainability of the current economic expansion.
Shopping Without My Rose Colored Glasses
Regardless of the state of the economic environment, proper investing should be instituted through an unemotional decision-making process, just as going shopping should be an unemotional endeavor. Price and value should be the key criteria used when buying a specific investment or holiday gift. Unfortunately for many, emotions such as greed, fear, impatience, and instant gratification overwhelm objective measurements such as price and value.
As I have noted on many occasions, over the long-run, money unemotionally moves to where it is treated best. From a long-term perspective, that has meant more capital has migrated to democratic and capitalistic countries with a strong rule of law. Closed, autocratic societies operating under corrupt regimes have been the big economic losers.
With all of that set aside, the last six years have created tremendous investment opportunities due to the extreme investor risk aversion created by the financial crisis – hence the more than tripling in U.S. stock prices since March 2009.
When comparing the yield (i.e., profit earned on an investment) between stocks and bonds, as shown in the chart below, you can see that stock investors are being treated significantly better than bond investors (6.1% vs. 4.0%). Not only are bond investors receiving a lower yield than stock investors, but bond investors also have no hope of achieving higher payouts in the future. Stocks, on the other hand, earn the opportunity of a double positive whammy. Not only are stocks currently receiving a higher yield, but stockholders could achieve a significantly higher yield in the future. For example, if S&P 500 earnings can grow at their historic rate of about 7%, then the current stock earnings yield of 6.1% would about double to 12.0% over the next decade at current prices. The inflated price and relative attractiveness of stocks looks that much better if you compare the 6.1% earnings yield to the paltry 2.2% 10-Year Treasury yield.

Source: Yardeni.com
This analysis doesn’t mean everyone should pile 100% of their portfolios into stocks, but it does show how expensively nervous investors are valuing bonds. Time horizon, risk tolerance, and diversification should always be pillars to a disciplined, systematic investment strategy, but as long as these disparities remain between the earnings yields on stocks and bonds, long-term investors should be able to shop for plenty of doorbuster discount bargain opportunities.
Wade W. Slome, CFA, CFP®
Plan. Invest. Prosper.
DISCLOSURE: Sidoxia Capital Management (SCM) and some of its clients hold positions in AMZN and certain exchange traded funds (ETFs), but at the time of publishing had no direct position in any other security referenced in this article. No information accessed through the Investing Caffeine (IC) website constitutes investment, financial, legal, tax or other advice nor is to be relied on in making an investment or other decision. Please read disclosure language on IC Contact page.
The 10 Investment Commandments

Moses ascended Mount Sinai to receive the powerful spiritual words of the Ten Commandments from God on two stone tablets and then went on to share the all-important, moral imperatives with his people. If Moses was alive today and was a professional investor, I’m sure he would have downloaded the “10 Investment Commandments” from Charles Ellis’s Winning the Loser’s Game on his e-reader, and then share the knowledge with all investors. I’m the furthest thing from Moses, but in his absence, I will be happy to share Ellis’s valuable and useful 10 Investment Commandments for individual investors:
1) “Save. Invest your savings in your future happiness and security and education for your kids.”
2) “Don’t speculate. If you must ‘play the market’ to satisfy an emotional itch, recognize that you are gambling on your ability to beat the pros so limit the amounts you play with to the same amounts you would gamble with the pros at Las Vegas.”
3) “Don’t do anything in investing primarily for tax reasons.”
4) “Don’t think of your home as an investment. Think of it as a place to live with your family-period.”
5) “Never do commodities….Dealing in commodities is really only price speculation. It’s not investing because there’s no economic productivity or value added.”
6) “Don’t be confused about stockbrokers and mutual fund salespeople. They are usually very nice people, but their job is not to make money for you. Their job is to make money from you.”
7) “Don’t invest in new or ‘interesting’ investments. They are all too often designed to be sold to investors, not to be owned by investors.”
8) “Don’t invest in bonds just because you’ve heard that bonds are conservative or for safety of either income or capital. Bond prices can fluctuate nearly as much as stock prices do, and bonds are a poor defense against the major risk of long-term investing – inflation.”
9) “Write out your long-term goals, your long-term investing program, and your estate plan – and stay with them.”
10) “Distrust your feelings. When you feel euphoric, you’re probably in for a bruising.”
We all commit sins, some more than others, and investors are no different. A simple periodic review of Charles Ellis’s “10 Investing Commandments” will spiritually align your portfolios and prevent the number of investment sins you make.
Read More about Charles Ellis (article #1 and article #2)
Wade W. Slome, CFA, CFP®
Plan. Invest. Prosper.
DISCLOSURE: Sidoxia Capital Management (SCM) and some of its clients own certain exchange traded funds, but at the time of publishing SCM had no direct position in any other security referenced in this article. No information accessed through the Investing Caffeine (IC) website constitutes investment, financial, legal, tax or other advice nor is to be relied on in making an investment or other decision. Please read disclosure language on IC “Contact” page.
Dying Unicorns

Historically, when people speak about unicorns they are referring to those magical white horses with long horns sprouting from their foreheads. Today, in Silicon Valley and on Wall Street, “unicorns” refer to those private companies valued at more than $1 billion. The current list of unicorns is extensive, including household names like money-losing Uber ($51.0 billion valuation), Airbnb ($25.5 billion), SnapChat ($15.3 billion), and about 150 other money-losing companies with a combined valuation of approximately a half trillion dollars (see list here). Just like the mythical unicorns we imagine and read about in fairy tales, Silicon Valley unicorns are at risk of dying off and becoming a myth as well.
Square at the Heart of the Problem
Following young technology start-ups with names like, Box, Dropbox, and Square can become quite confusing, but investors are becoming less confused about their desire for profits and fair valuations. The recent –33% discount in the planned pre-IPO offering price of Square shares to $11 – $13 ($4 billion) from the last private funding valuation of $15.46 ($6 billion) is signaling the deteriorating health of money-losing unicorns.
Adding insult to injury, money-losing Square provided recent private investors with a controversial “ratchet” clause, which essentially gives privileged investors additional shares, if the IPO (Initial Public Offering) price does not occur at a minimum set price. The net result is a fraction of advantaged investors receive a disproportionate percentage of the company’s value, while a majority of the other investors see their ownership value diluted. According to Forbes, approximately 30% of unicorns carry some contentious ratchet provisions, which may make IPO exits for these companies that much more difficult.
The recent Square news comes on the heels of other unicorns like Dropbox seeing its pre-IPO value being reduced by -24% from industry giant BlackRock Inc (BLK), an early Dropbox investor. According to the Wall Street Journal¸ bankers close to the company admitted achieving a pre-IPO valuation of $10 billion will be challenging. Subsequently, mutual fund behemoth Fidelity wrote down the value of social media, photo disappearing, mobile application company, Snapchat, by -25%.
Unfortunately, the problems for unicorn companies don’t stop after the IPO. Take for example, Fitbit Inc (FIT), the newly minted $6 billion IPO, which took place in June. Even though the wearable technology company may no longer be a unicorn, the -31% decline in its share price during the first half of November is evidence there are consequences to insiders dumping additional over-priced (or high-priced) shares on investors. Of the planned 17 million secondary share sale, the vast majority of the proceeds (14 million shares) are going to insiders who are taking the money and running, thereby leaving the company itself with a much smaller portion of the offering dollars.
Veteran investors have seen this movie before during the late 1990s tech bubble, and investors know that this type of movie ends very badly. As in any bubble, if you are able to participate early enough during the inflation process, it can be a spectacular ride before the bubble bursts. Unicorn companies can sell a dream for a while, but profitless prosperity cannot last forever. Eventually, profits and cash flows do become important for investors. And for some unicorn companies, the day of reckoning appears to have arrived now. It has been a fun, fairy tale ride for unicorn investors up until now, but with a half trillion dollars in unicorn investments beginning to die off, these early stage companies will need a steadier diet of profits to stay alive.
Wade W. Slome, CFA, CFP®
Plan. Invest. Prosper.
DISCLOSURE: Sidoxia Capital Management (SCM) and some of its clients hold positions in certain exchange traded funds (ETFs), but at the time of publishing, SCM had no direct position in Uber, Airbnb, SnapChat, Box, Dropbox, Square, BLK, FIT and any other security referenced in this article. No information accessed through the Investing Caffeine (IC) website constitutes investment, financial, legal, tax or other advice nor is to be relied on in making an investment or other decision. Please read disclosure language on IC Contact page.
Extrapolation: Dangers of the Reckless Ruler

The game of investing would be rather simple if everything moved in a straight line and economic data points could be could be connected with a level ruler. Unfortunately, the real world doesn’t operate that way – data points are actually scattered continuously. In the short-run, inflation, GDP, exchange rates, interest rates, corporate earnings, profit margins, geopolitics, natural disasters, financial crises, and an infinite number of other factors are very difficult to predict with any accurate consistency. The true way to make money is to correctly identify long-term trends and then opportunistically take advantage of the chaos by using the power of mean reversion. Let me explain.
Take for example the just-released October employment figures, which on the surface showed a blowout creation of +271,000 new jobs during the month (unemployment rate decline to 5.0%) versus the Wall Street consensus forecast of +180,000 (flat unemployment rate of 5.1%). The rise in new workers was a marked acceleration from the +137,000 additions in September and the +136,000 in August. The better-than-expected jobs numbers, the highest monthly addition since late 2014, was paraded across television broadcasts and web headlines as a blowout number, which gives the Federal Reserve and Chairwoman Janet Yellen more ammunition to raise interest rates next month at the Federal Open Market Committee meeting. Investors are now factoring in roughly a 70% probability of a +0.25% interest rate hike next month compared to an approximately 30% chance of an increase a few weeks ago.
As is often the case, speculators, traders, and the media rely heavily on their trusty ruler to connect two data points to create a trend, and then subsequently extrapolate that trend out into infinity, whether the trend is moving upwards or downwards. I went back in time to explore the media’s infatuation with limitless extrapolation in my Back to the Future series (see Part I; Part II; and Part III). More recently, weakening data in China caused traders to extrapolate that weakness into perpetuity and pushed Chinese stocks down in August by more than -20% and U.S. stocks down more than -10%, over the same timeframe.
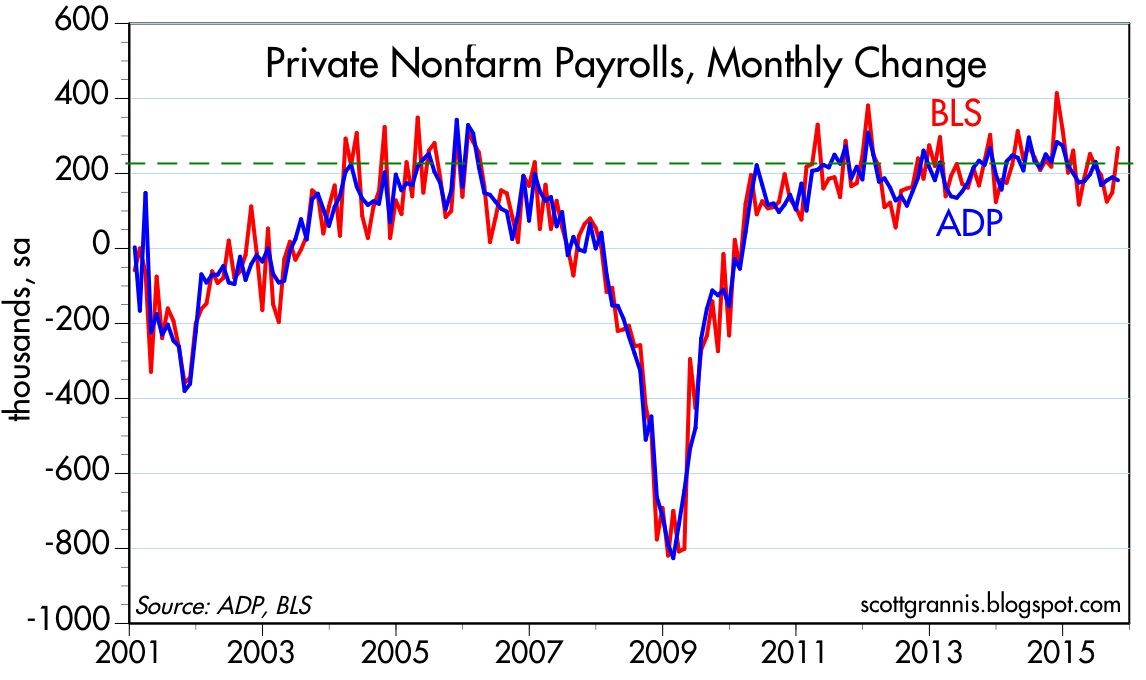
While most of the media coverage blew the recent jobs number out of proportion (see BOOM! Big Rebound in Job Creation), some shrewd investors understand mean reversion is one of the most powerful dynamics in economics and often overrides the limited utility of extrapolation. Case in point is blogger-extraordinaire Scott Grannis (Calafia Beach Pundit) who displayed this judgment when he handicapped the October jobs data a day before the statistics were released. Here’s what Grannis said:
The BLS’s estimate of private sector employment tends to be more volatile than ADP’s, and both tend to track each other over time. That further suggests that the BLS jobs number—to be released early tomorrow—has a decent chance of beating expectations.
Now, Grannis may not have guaranteed a specific number, but comparing the volatile government BLS and private sector ADP jobs data (always released before BLS) only bolsters the supremacy of mean reversion. As you can see from the chart below, both sets of data have been highly correlated and the monthly statistics have reliably varied between a range of +100k to +300k job additions over the last six years. So, although the number came in higher than expected for October, the result is perfectly consistent with the “slowly-but-surely” growing U.S. economy.
Source: Calafia Beach Pundit
While I spend much more time picking stocks than picking the direction of economic statistics, even I will agree there is a high probability the Fed moves interest rates next month. But even if Yellen acts in December, she has been very clear that this rate hike cycle will be slower than previous periods due to the weak pace of economic expansion. I agree with Grannis, who noted, “Higher rates would be a confirmation of growth, not a threat to growth.” Whatever happens next month, do yourself a favor and keep the urge of extrapolation at bay by keeping your pencil and ruler in your drawer.
Wade W. Slome, CFA, CFP®
Plan. Invest. Prosper.
DISCLOSURE: Sidoxia Capital Management (SCM) and some of its clients hold positions in certain exchange traded funds (ETFs) , but at the time of publishing, SCM had no direct position in any other security referenced in this article. No information accessed through the Investing Caffeine (IC) website constitutes investment, financial, legal, tax or other advice nor is to be relied on in making an investment or other decision. Please read disclosure language on IC Contact page.
More Treats, Less Tricks

This article is an excerpt from a previously released Sidoxia Capital Management complimentary newsletter (November 2, 2015). Subscribe on the right side of the page for the complete text.
Have you finished licking the last of your Halloween chocolate-covered fingers and scheduled your next cavity-filled dental appointment? After a few challenging months, the normally spooky month of October produced an abundance of sweet treats rather than scary tricks for stock market investors. In fact, the S&P 500 index finished the month with a whopping +8.3% burst, making October the tastiest performing month since late 2010. This came in stark contrast to the indigestion experienced with the -8.7% decline over the previous two months.
What’s behind all these sweet gains? For starters, fears of a Chinese economic sugar-high ending in a crash have abated for now. With that said, “Little Red Riding Hood” is not out of the woods quite yet. Like a surprising goblin or ghost popping out to scare you at a Halloween haunted house, China could still rear its ugly head in the future due to its prominent stature as the second largest global economy. We have been forced to deal with similar on-again-off-again concerns associated with Greece.
The good news is the Chinese government and central bank are not sitting on their hands. In addition to interest rate cuts and corruption crackdowns, Chinese government officials have even recently halted its decades-long one-child policy. China’s new two-child policy is designed to spur flagging economic growth and also reverse the country’s aging demographic profile.
Also contributing to the stock market’s sugary October advances is an increasing comfort level with the Federal Reserve’s eventual interest rate increase. Just last week, the central bank released the statement from its October Federal Open Market Committee meetings stating it will determine whether it will be “appropriate” to increase interest rates at its next meetings, which take place on December 15th and 16th. Interest rate financial markets are now baking in a roughly 50% probability of a Fed interest rate hike next month. Initially, the October Fed statement was perceived negatively by investors due to fears that higher rates could potentially choke off economic growth. Within a 30 minute period after the announcement, stock prices reversed course and surged higher. Investors interpreted the Fed signal of a possible interest rate hike as an upbeat display of confidence in a strengthening economy.
As I have reiterated on numerous occasions (see also Fed Fatigue), a +0.25% increase in the Federal Funds rate from essentially a level of 0% is almost irrelevant in my eyes – just like adjusting the Jacuzzi temperature from 102 degrees down to 101 degrees is hardly noticeable. More practically speaking, an increase from 14.00% to 14.25% on a credit card interest rate will not deter consumers from spending, just like a 3.90% mortgage rising to 4.15% will not break the bank for homebuyers. On the other hand, if interest rates were to spike materially higher by 3.00% – 4.00% over a very short period of time, this move would have a much more disruptive impact, and would be cause for concern. Fortunately for equity investors, this scenario is rather unlikely in the short-run due to virtually no sign of inflation at either the consumer or worker level. Actually, if you read the Fed’s most recent statement, Fed Chairwoman Janet Yellen indicated the central bank intends to maintain interest rates below “normal” levels for “some time” even if the economy keeps chugging along at a healthy clip.
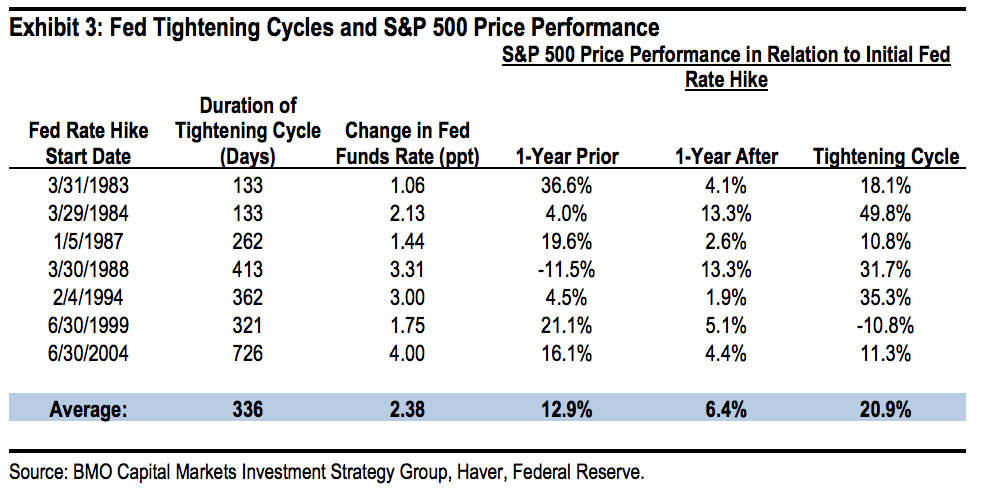
If you think my interest rate perspective is the equivalent of me whistling past the graveyard, history proves to be a pretty good guide of what normally happens after the Fed increases interest rates. Bolstering my argument is data observed over the last seven Federal Reserve interest rate hike cycles from 1983 – 2006 (see table below). As the statistics show, stock prices increased an impressive +20.9% on average over Fed interest rate “Tightening Cycles.” It is entirely conceivable that the announcement of a December interest rate hike could increase short-term volatility. We saw this rate hike fear phenomenon a few months ago, and also a few years ago in 2013 (see also Will Rising Rates Murder Market?) when Federal Reserve Chairman Ben Bernanke threatened an end to quantitative easing (a.k.a., “Taper Tantrum”), but eventually people figured out the world was not going to end and stock prices ultimately moved higher.
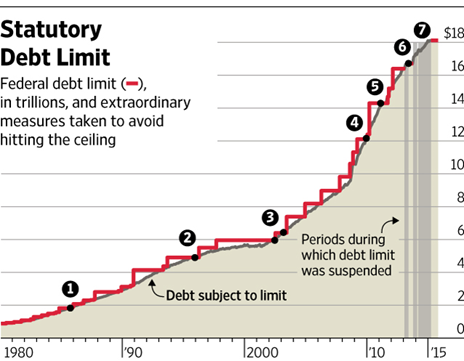
Besides increased comfort with Fed interest rate policies, another positive contributing factor to the financial market rebound was the latest Congressional approval of a two-year budget deal that prevents the government from defaulting on its debt. Not only does the deal suspend the $18.1 trillion debt limit through March 2017 (see chart below), but the legislation also lowers the chance of a government shutdown in December. Rather than creating a contentious battle for the fresh, incoming Speaker of the House (Paul Ryan), the approved budget deal will allow the new Speaker to start with a clean slate with which he can use to negotiate across a spectrum of political issues.
Source: Wall Street Journal
Remain Calm – Not Frightened
Humans, including all investors, are emotional beings, but the best investors separate fear from greed and are masters at making unemotional, objective decisions. Just as everything wasn’t a scary disaster when stocks declined during August and September, so too, the subsequent rise in October doesn’t mean everything is a bed of roses.
Every three months, thousands of companies share their financial report cards with investors, and so far with more than 65% of the S&P 500 companies reporting their results this period, corporate America is not making the honor roll. Collapsing commodity prices, including oil, along with the rapid appreciation in the value of the U.S. dollar (i.e., causing declines in relatively expensive U.S. exports), third quarter profit growth has declined -1%. If you exclude the energy sector from the equation, corporations are still not making the “Dean’s List,” however the report cards look a lot more respectable through this lens with profits rising +6% during the third quarter. A sluggish third quarter GDP (Gross Domestic Product) growth report of +1.5% is further evidence the economy has plenty of room to improve the country’s financial GPA.
Historically speaking, October has been a scary period, if you consider the 1929 and 1987 stock market crashes occurred during this Halloween month. Now that investors have survived this frightening period, we will see if the “Santa Claus Rally” will arrive early this season. Stock market treats have been sweet in recent weeks, but investors cannot lose sight of the long-term. With interest rates near generational lows, investors need to make sure they are efficiently investing their investment funds in a low-cost, tax-efficient, diversified manner, subject to personal time horizons and risk tolerances. Over the long-run, meeting these objectives will create a lot more treats than tricks.
Wade W. Slome, CFA, CFP®
Plan. Invest. Prosper.
DISCLOSURE: Sidoxia Capital Management (SCM) and some of its clients hold positions in certain exchange traded funds (ETFs) , but at the time of publishing, SCM had no direct position in any other security referenced in this article. No information accessed through the Investing Caffeine (IC) website constitutes investment, financial, legal, tax or other advice nor is to be relied on in making an investment or other decision. Please read disclosure language on IC Contact page.
Out of the Woods?

In the middle of the 24/7 news cycle, many investors get distracted by the headline du jour, much like a baby gets distracted by a shiny new object. While investor moods have been swinging violently back and forth, October’s performance has bounced back like a flying tennis ball. So far, the reversal in the S&P 500 performance has more than erased the -9% correction occurring in August and September. Could we finally be out of the woods, or will geopolitics and economic factors scare investors through Halloween and year-end?
Given recent catapulting stock prices, investor amnesia has erased the shear horror experienced over the last few months – this is nothing new for emotional stock market participants. As I wrote in Controlling the Lizard Brain, human brains have evolved the almond-shaped tissue in our brains (amygdala) that controlled our ancestors’ urge to flee ferocious lions. Today the urge is to flee scary geopolitical and economic headlines.
I expanded on the idea here:
“When the brain in functioning properly, the prefrontal cortex (the front part of the brain in charge of reasoning) is actively communicating with the amygdala. Sadly, for many people, and investors, the emotional response from the amygdala dominates the rational reasoning portion of the prefrontal cortex. The best investors and traders have developed the ability of separating emotions from rational decision making, by keeping the amygdala in check.”
Evidence of lizard brains fear for flight happened just two months ago when the so-called “Fear Gauge” (VIX – Volatility Index) hit a stratospherically frightening level of 53 (see chart below), reached only once over the last few decades (2008-09 Financial Crisis).
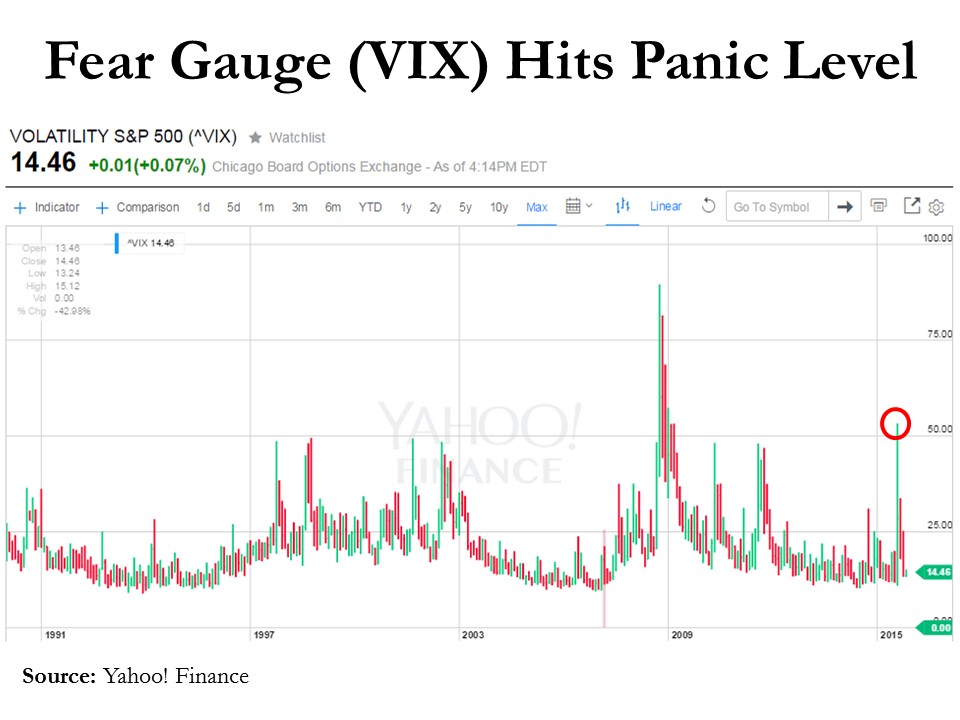
Just as quickly as slowing China growth and a potential Fed interest rate hike caused investors to crawl underneath their desks during August (down –11% in four days), while biting their fingernails, investors have now sprung outside to the warm sunshine. The end result has been an impressive, mirror-like +11% increase in stock prices (S&P 500) over the last 18 trading days.
Has anything really changed over the last few weeks? Probably not. Economists, strategists, analysts, and other faux-soothsayers get paid millions of dollars in a fruitless attempt to explain day-to-day (or hour-by-hour) volatility in the stock markets. One Nobel Prize winner, Paul Samuelson, understood the random nature of stock prices when he observed, “The stock market has forecast nine of the last five recessions.” The pundits are no better at consistently forecasting stock prices.
As I have reiterated many times before, the vast majority of the pundits do not manage money professionally – the only people you should be paying attention to are successful long-term investors. Even listening to veteran professional investors can be dangerous because there is often such a wide dispersion of opinions based on varying time horizons, strategies, and risk tolerances.
Skepticism remains rampant regarding the sustainability of the bull market as demonstrated by the -$100 billion+ pulled out of domestic equity funds during 2015 (Source: ICI). The Volatility Index (VIX) shows us the low-hanging fruit of pessimism has been picked with the metric down -73% from August. With legislative debt ceiling and sequestration debates ahead in the coming weeks, we could hit some more choppy waters. Short-term volatility may resurrect itself, but the economy keeps chugging along, interest rates remain near all-time lows, and stock valuations, broadly speaking, remain reasonable. Investors may not be out of the woods yet, but one thing remains certain…an ever-changing stream of fearful headlines are likely to continue flooding in, which means we must all keep our lizard brains in check.
Wade W. Slome, CFA, CFP®
Plan. Invest. Prosper.
DISCLOSURE: Sidoxia Capital Management (SCM) and some of its clients hold positions in certain exchange traded funds (ETFs), but at the time of publishing, SCM had no direct position in any other security referenced in this article. No information accessed through the Investing Caffeine (IC) website constitutes investment, financial, legal, tax or other advice nor is to be relied on in making an investment or other decision. Please read disclosure language on IC Contact page.
The Fallibility of Tangibility

Why do so many star athletes end up going bankrupt? Rather than building a low-cost, tax-efficient, diversified portfolio of stocks and bonds that could help generate significant income and compounded wealth over the long-term (yawn…boring), many investors succumb to the allure of over-exposing themselves to costly, illiquid, tangible assets, while assuming disproportionate risk.
After all, it’s much more exciting to brag about the purchase of a car wash, apartment building or luxury condo than it is to whip out a brokerage statement and show a friend a bond fund earning a respectable 4% yield.
Many real estate investors in my Southern California backyard (epicenter of the 2008-2009 Financial Crisis) have experienced both ruin and riches over the last few decades. The appeal and pitfalls associated with owning tangible assets like real estate are particularly exemplified with professional athletes (see also Hidden Train Wreck). Consider the fate suffered by these following individuals:
- Mike Tyson: Famous boxer Mike Tyson tore through $300 million on multiple homes, cars, jewels and pet tigers before filing for bankruptcy in 2003.
- Julius Erving: Hall of Fame NBA player Julius “Dr. J” Erving went financially belly-up in 2010 after his Celebrity Golf Club International was pushed into foreclosure. Dr. J. was also forced to auction off coveted NBA memorabilia (including championship uniforms, trophies, and rings) along with foreclosing on his personal $2 million, 6,600-square foot Utah home.
- Mark Brunell: Pro Bowl quarterback Mark Brunell was estimated to have earned over $50 million during his career. Due to failed real estate ventures and business loans, Brunell filed for bankruptcy in 2010.
- Evander Holyfield: Heavyweight boxing champion Evander Holyfield burned through a mountain of money estimated at $230 million, including a 235-acre Utah estate, which had 109 rooms and included at least one monthly electric bill of $17,000.
Caveat Emptor
Inclusion of real estate as part of a diversified portfolio makes all the sense in the world – this is exactly what we do for clients at Sidoxia. But unfortunately, many investors mistake the tangibility of real estate with “lower risk,” even though levered real estate is arguably more volatile than the stock market – evidenced by the volatility in publicly traded REIT share prices. For example, the Dow Jones SPDR REIT (RWR) declined by -78% from its 2007 high to its 2009 low versus the S&P 500 SPDR (SPY) drop of -57% over the comparable period. Private real estate investors are generally immune from the heart-pumping price volatility rampant in the public markets because they are not bombarded with daily, real-time, second-by-second pricing data over flashing red and green colored screens.
Without experiencing the emotional daily price swings, many real estate investors ignore the risks and costs associated with real estate, even when those risks often exceed those of traditional investments (e.g., stocks and bonds). Here are some of the important factors these real estate investors overlook:
Leverage: Many real estate investors don’t appreciate that the fact that 100% of a 10% investment (90% borrowed) can be wiped out completely (i.e., lose -100%), if the value of a property drops a mere -10%. Real estate owners found this lesson out the hard way during the last housing downturn and recession.
Illiquidity: Unlike a stock and bond, which merely takes a click of a mouse, buying/selling real estate can take weeks, if not months, to complete. If a seller needs access to liquidity, they may be forced to sell at unattractively low, fire-sale prices. Pricing transparency is opaque due to the variability and volume of transactions, although online services offered by Zillow Group Inc. (Z).
Costs: For real estate buyer, the list of costs can be long: appraisal fee, origination fee, pre-paid interest, pre-paid insurance, flood certification fee, tax servicing fee, credit report fee, bank processing fee, recording fee, notary fee, and title insurance. And once an investment property is officially purchased, there are costs such as property management fees, property taxes, association dues, landscaping fees and the opportunity costs of filling vacancies when there is tenant turnover. And this analysis neglects the hefty commission expenses, which generally run 5-6% and split between the buying and selling agent. Add all these costs up, and you can understand the dollars can become significant.
Concentration Risk: It’s perfectly fine to own a levered, cyclical asset in a broadly diversified portfolio for long-term investors, but owning $1.3 million of real estate in a $1.5 million total portfolio does not qualify as diversified. If a portfolio is real estate heavy, hopefully the real estate assets are at least diversified across geographies and real estate type (e.g., residential / commercial / multi-family / industrial / retail mall / mortgages / etc).
Stocks Abhorred, Gold & Real Estate Adored
With the downdraft in the stock market that started in late August, a recent survey conducted by CNBC showed how increased volatility has caused wealthy investors to sour on the stock market. More specifically, the All-America Survey, conducted by Hart-McInturff, polled 800 wealthy Americans at the beginning of October. Unsurprisingly, many investors automatically correlate temporary weakness in stocks to a lagging economy. In fact, 32% of respondents believed the U.S. economy would get worse, a 6% increase from the last poll in June, and the highest level of economic pessimism since the government shutdown in 2013 (as it turned out, this was a very good time to buy stocks). These gloom and doom views manifested themselves in skeptical views of stocks as well. Overall, 46% of the public felt it is a bad time to invest in stocks, representing a 12% gain from the last survey.
With investor appetites tainted for stocks, hunger for real state has risen. Actually, real estate was the top investment choice by a large margin, selected by 39% percent of the investors polled. Real estate has steadily gained in popularity since the depths of the recession in 2008. Jockeying for second place have been stocks and gold with the shiny metal edging out stocks by a score of 25% to 21%, respectively.
Successful long-term investors like Warren Buffett understand the best returns are earned by going against the grain. As Buffett said, “Be fearful when others are greedy and greedy when others are fearful,” and we know stock investors are fearful. Along those same lines, Bill Miller, the man who beat the S&P 500 index for 15 consecutive years (1991 – 2005), believes now is a perfect time to buy stocks. Investing in real estate is not a bad idea in the context of a diversified portfolio, but investors should not forget the fallibility of tangibility.
Wade W. Slome, CFA, CFP®
Plan. Invest. Prosper.
DISCLOSURE: Sidoxia Capital Management (SCM) and some of its clients hold positions in certain exchange traded funds (ETFs) including SPY, but at the time of publishing, SCM had no direct position in Z, RWR, or any other security referenced in this article. No information accessed through the Investing Caffeine (IC) website constitutes investment, financial, legal, tax or other advice nor is to be relied on in making an investment or other decision. Please read disclosure language on IC Contact page.
E.M.s Want Cake & Eat It Too

Since the end of 2010, the emerging markets (E.M.) have gotten absolutely obliterated (MSCI Emerging Markets index –25%) compared to a meteoric rise in U.S. stocks (S&P 500 index +60%) over the same period.
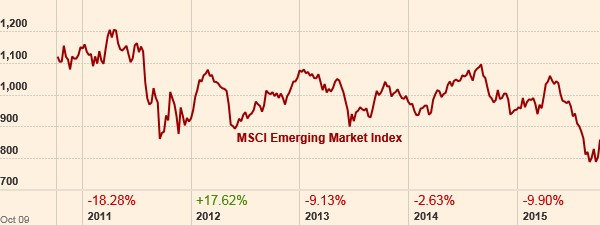
Source: Financial Times
Slowing global growth, especially with resource-hungry China going on a crash diet, has caused commodity-exporting emerging markets like Brazil to suffer economic starvation. Rising inflation, expanding debt, decelerating Chinese growth, collapsing commodity prices, and political corruption allegations are all factors pressuring the Brazilian economy. Weak emerging market economies like Brazil are contributing to global GDP forecast reductions. As you can see from the chart below, global GDP growth rates have been steadily declining since 2010, and the IMF recently lowered their 2015 forecast from +3.5% down to 3.1%.
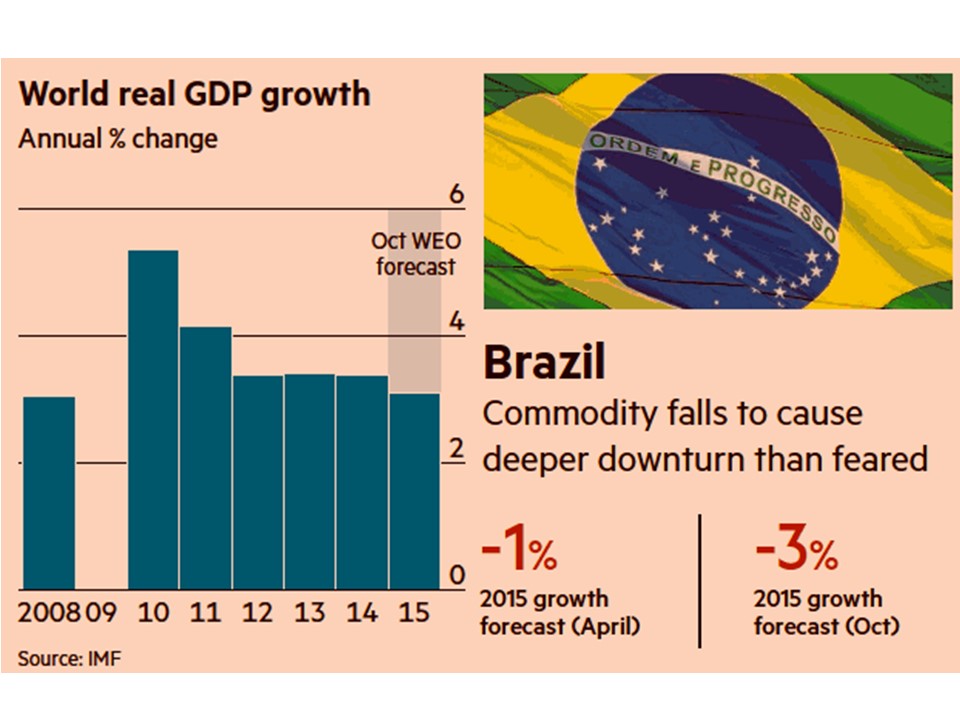
Source: Financial Times
Beginning in late 2008, when Ben Bernanke first announced his QE 1 (Quantitative Easing) money printing binge, the U.S. dollar remained relatively weak against other global currencies for years. The weak dollar provided a nice tailwind to U.S. exporters (i.e., American manufactured goods were more cost competitive for foreign buyers).
Multinationals loved the export lift, but emerging international politicians and investors cried foul. They complained the U.S. was starting a “currency war” by artificially deflating the value of the U.S. dollar, thereby making international markets less competitive. At the time, the thought process was the emerging markets (e.g., China, Russia, Brazil et.al.) would be disproportionately impacted because their economies are export-driven. In a 2010 article from the Guardian (World Gripped by International Currency War) Brazilian finance minister Guido Mantega explicitly stated, “We’re in the midst of an international currency war, a general weakening of currency. This threatens us because it takes away our competitiveness.”
This “currency war” griping stayed in place until the end of 2013 when the Fed announced its plans to begin “tapering” bond buying (i.e., pull away the financial punch bowl). We all know what has happened since then…the U.S. dollar has spiked by about +20% and the Brazilian real has depreciated by a whopping -37%. This is good news for emerging markets like Brazil, right? Wrong!
A few years ago, emerging market investors were initially worried about the depressing effects of a strong currency on exports, but now that emerging market currencies have depreciated, fears have shifted. Now, investors are concerned whether E.M. countries can pay off foreign borrowed debt denominated in pricey U.S. dollars (paid with vastly weaker E.M. currencies). Moreover, with foreign governments holding dramatically lower valued currency, investors are worried about the ability of these E.M. countries to raise additional capital or refinance existing debt. SocGen’s head of emerging market strategy, Guy Stear, summed it up by noting, “Prevailing risks of a deterioration of the external financing environment and disruptive capital flow and asset price shifts that increase volatility in the respective bond and currency markets, make a rapid rebound in EM growth over the next months unlikely.”
So which one is it…do E.M. investors want a weak currency to power exports, or a strong currency to pay down debt and raise additional capital? Unfortunately, investors can’t have their cake and eat it too – you can’t have a depreciating and appreciating currency at the same time.
While anxiety has shifted from strong emerging market currencies to the issues associated with weak currencies, India is one E.M that has reaped the rewards from a declining rupee (-20% since 2013). In other words, India is benefiting from a stronger trade balance via a boost in exports and reduction in imports – interestingly, the U.S. has experienced the exact opposite. Regardless, eventually, other emerging markets will benefit from these same positive trends as India – that will finally be a tasty slice of cake.
Wade W. Slome, CFA, CFP®
Plan. Invest. Prosper.
DISCLOSURE: Sidoxia Capital Management (SCM) and some of its clients hold positions in certain exchange traded funds (ETFs) including EWZ, but at the time of publishing, SCM had no direct position in any other security referenced in this article. No information accessed through the Investing Caffeine (IC) website constitutes investment, financial, legal, tax or other advice nor is to be relied on in making an investment or other decision. Please read disclosure language on IC Contact page.
Marathon Market Gets a Cramp

This article is an excerpt from a previously released Sidoxia Capital Management complimentary newsletter (October 1, 2015). Subscribe on the right side of the page for the complete text.
“Anyone can run a hundred meters, it’s the next forty-two thousand and two hundred that count.”
Investing is a lot like running a marathon…but it’s not a sprint to the retirement finish line. The satisfaction of achieving your long-term goal can be quite rewarding, but attaining ambitious objectives does not happen overnight. Along the hilly and winding course, there can be plenty of bumps and bruises mixed in with the elation of a runner’s high. While stocks have been running at a record pace in recent years, prices have cramped up recently as evidenced by the -2.6% decline of the S&P 500 stock index last month.
But the recent correction should be placed in the proper perspective as you approach and reach retirement. Since the end of the 2008 Financial Crisis the stock market has been racing ahead at a brisk rate, as you can see from the total return performance below (excluding 2015):

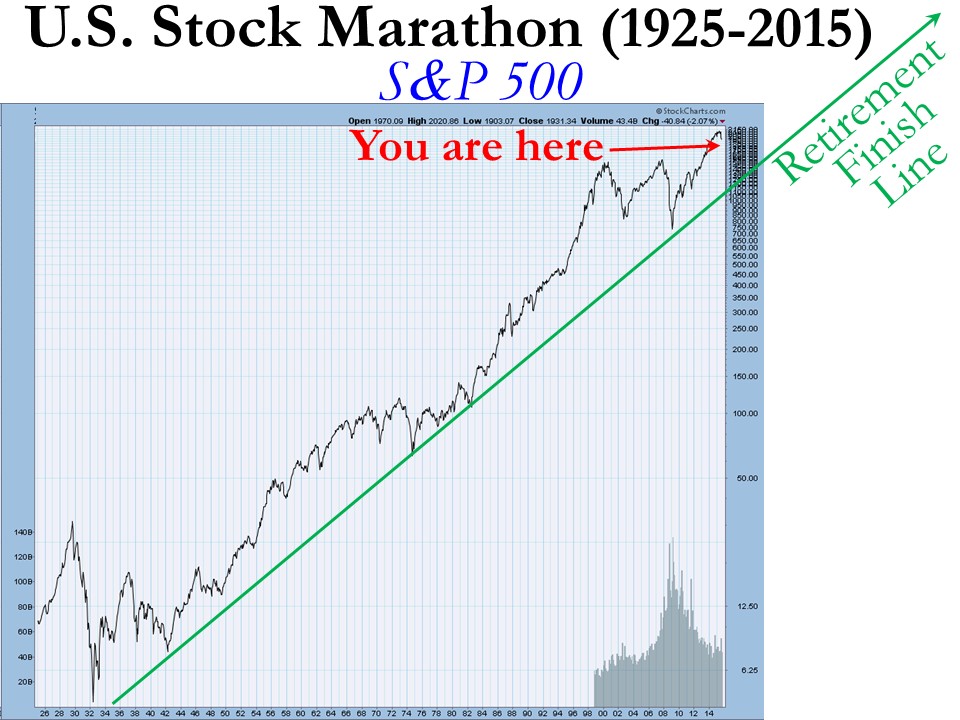
This performance is more indicative of a triumph than a catastrophe, but if you turned on the TV, listened to the radio, or surfed the web, you may come to a more frightening conclusion.
What’s behind the recent dip? These are some of the key concerns driving the recent price volatility:
- China: Slowing growth in China and collapse in Chinese stock market. China is suffering from a self-induced slowdown designed to mitigate corruption, prick the real estate bubble, and shift its export-driven economy to a more consumer-driven economy. These steps diminish short-term growth (albeit faster than U.S. growth), but nevertheless the measures should be constructive for longer-term growth.
- Interest Rates: Uncertainty surrounding the timing of a 0.25% target interest rate increase by the Federal Reserve. The move from 0% to 0.25% is like walking from the hardwood floor onto the rug…hardly noticeable. The inevitable move by the Fed has been widely communicated for months, and given where interest rates are today, the move will have a negligible impact on corporate borrowing costs. Like removing a Band-Aid, the initial action may cause some pain, but should be comfortably received shortly thereafter.
- Politics: Potential government shutdown / sequestration. The epic political saga will never end, however, as I highlighted in “Who Said Gridlock is Bad?,” political discourse in Washington has resulted in positive outcomes as it relates to our country’s fiscal situation (limited government spending and declining deficits). The government shutdown appears to have been averted for now, but it looks like we will be blanketed with brinkmanship nonsense again in a few months.
- Biotech/Pharmaceuticals: Politics over lofty drug prices and the potential impact of future regulation on the biotech sector. Given the current Congressional balance of power, any heavy-handed Democratic proposals is likely to face rigorous Republican opposition.
- Emerging Markets: Emerging market weakness, especially in Latin America (e.g., Brazil). These developments deserve close monitoring, but the growth in the three largest economic regions (U.S., Europe, and China) will have a much larger effect on the direction of global economic expansion.
- Middle East: Destabilized Middle East and Syria. Terrorist extremism and cultural animosity between various Middle East populations has existed for generations. There will be no silver bullet for a peaceful solution, so baby steps and containment are critical to maintain healthy global trade activity with minimal disruptions.
Worth noting, this current list of anxieties itemized above is completely different from six months ago (remember the Greece crisis?), and the list will change again six months into the future. Investing, like any competitive challenge, does not come easy…there is always something to worry about in the land of economics and geopolitics.
Here’s what the world’s top investor Warren Buffett said a few decades ago (1994) on the topic of politics and economics:
“We will continue to ignore political and economic forecasts which are an expensive distraction for investors and businessmen. Thirty years ago, no one could have foreseen the huge expansion of the Vietnam War, wage and price controls, two oil shocks, the resignation of a president, the dissolution of the Soviet Union, a one-day drop in the Dow of 508 points, or treasury bill yields fluctuating between 2.8% and 17.4%.”
In a world of 7.3 billion people and 196 countries there will never be a shortage of fear, uncertainty, and doubt (F.U.D.) – see events chart in The Bungee Market. In an ever-increasing, globally connected world, technology and the media continually amplify molehills into mountains, thereby making the next imagined Armageddon a simple click of a mouse or swipe of a smartphone away.
Today’s concerns are valid but in the vast majority of cases the issues are completely overblown, sensationalized and over-emphasized without context. Context is an integral part to investing, but unfortunately context usually cannot be explained in a short soundbite or headline. On the flip side, F.U.D. thrives in the realm of soundbites and headlines.
While investors may feel fatigued from a strong flow of headline headwinds, financial market race participants should take a break at the water stop to also replenish themselves with a steady tailwind of positive factors, including the following:
- Employment: The unemployment rate has been cut from a recession peak of 10.0% down to 5.1%, and the economy has been adding roughly +200,000 new monthly jobs on a fairly consistent basis. On top of that, there are a record 5.8 million job openings versus 3.7 million two years ago – a sign that the economy continues to hum along.
- Housing/Commercial Real Estate/Mortgage Rates: Housing prices have rebounded by about +30% from the 2012 lows; Housing starts have increased by +25% in the past year and 120% in the past four years; and 30-Year Fixed mortgage interest rates sit at 3.85% – a highly stimulative level within a spitting distance from record lows.
- Auto Sales: Surged to a post-recession record of 17.8 million units in August.
- Interest Rates: Massively stimulative and near generational lows, even if the Fed hikes its interest rate target by 0.25% in October, December or sometime in 2016.
- Capital Goods Orders: Up for three consecutive months.
- Rail Shipments/Truck Tonnage: Both these metrics are rising by about 3-4%.
- Retail Sales: Rising at a very respectable pace of 7% over the last six months.
- Low Energy & Commodity Prices: Inflation has remained largely in check thanks to plummeting commodity prices. Low oil and gas prices are benefiting consumers in numerous ways, including the contribution to car sales, home sales, and/or debt reduction.
While the -10% dip in stock prices from mid-August might feel like a torn knee ligament, long-term investors know -10% corrections historically occur about one-time per year, on average. So, even though you may be begging for a wheelchair, the best course of action is to take a deep breath, stick to your long-term investment plan, rebalance your portfolio if necessary, and continue staying on course towards your financial finish line.
Wade W. Slome, CFA, CFP®
Plan. Invest. Prosper.
DISCLOSURE: Sidoxia Capital Management (SCM) and some of its clients hold positions in certain exchange traded funds (ETFs) , but at the time of publishing, SCM had no direct position in any other security referenced in this article. No information accessed through the Investing Caffeine (IC) website constitutes investment, financial, legal, tax or other advice nor is to be relied on in making an investment or other decision. Please read disclosure language on IC Contact page.