Posts filed under ‘Themes – Trends’
Financial Markets Recharge with a Nap…Zzzzzz

This article is an excerpt from a previously released Sidoxia Capital Management complimentary newsletter (January 4, 2016). Subscribe on the right side of the page for the complete text.
Did you enjoy your New Year’s festivities? If you were like me and ate excessively and drank too much egg nog, you may have decided along the line to take a nap. It’s not a bad idea to recharge those batteries before implementing those New Year’s resolutions and jumping on the treadmill. That’s exactly what happened in the financial markets this year. After six consecutive years of positive returns in the Dow Jones Industrial Average (2009 – 2014), stock markets took a snooze in 2015, as measured by the S&P 500 and Dow, which were each down -0.7% and -2.2%, respectively. And bonds didn’t fare any better, evidenced by the -1.9% decline in the Aggregate Bond ETF (AGG), over the same time period. Given the deep-seated fears about the Federal Reserve potentially catapulting interest rates higher in 2015, investors effectively took a big yawn by barely nudging the 10-year Treasury Note yield higher by +0.1% from 2.2% to 2.3%.
Even though 2015 ended up being a quiet year overall, there were plenty of sweet dreams mixed in with scary nightmares during the year-long nap:
INVESTMENT SWEET DREAMS
Diamonds in the Rough: While 2015 stock prices were generally flat to down around the globe (Vanguard Total Word -4.2%), there was some sunshine and rainbows gleaming for a number of segments in the market. For example, handsome gains were achieved in the NASDAQ index (+5.7%); Biotech Index – BTK (+10.9%); Consumer Discretionary ETF – XLY (+8.3%); Health Care ETF – VHT (+5.8%); Information Technology ETF – VGT (+4.6%); along with numerous other investment areas.
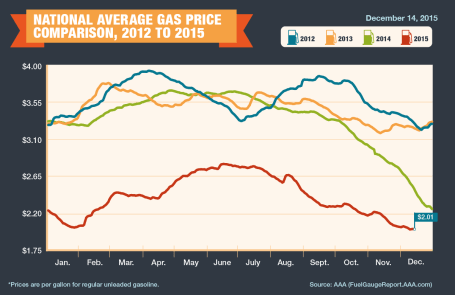
Fuel Fantasy Driven by Low Gas Prices: Gas prices averaged $2.01 per gallon nationally in December (see chart below), marking the lowest prices seen since 2009. Each penny in lower gas prices roughly equates to $1 billion in savings, which has strengthened consumers’ balance sheets and contributed to the multi-year economic expansion. Although these savings have partially gone to pay down personal debt, these gas reserves have also provided a financial tailwind for record auto sales (estimated 17.5million in 2015) and a slow but steady recovery in the housing market. The outlook for “lower-for-longer” oil prices is further supported by an expanding oil glut from new, upcoming Iranian supplies. Due to the lifting of economic sanctions related to the global nuclear deal, Iran is expected to deliver crude oil to an already over-supplied world energy market during the first quarter of 2016. Additionally, the removal of the 40-year ban on U.S. oil exports -could provide a near-term ceiling on energy prices as well.
Counting Cash Cows
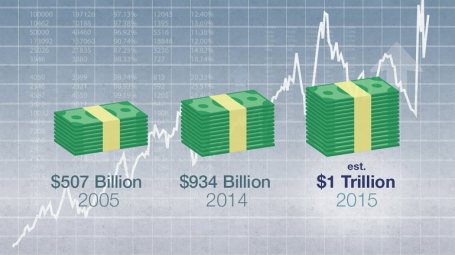
Catching some shut-eye after reading frightening 2015 headlines on the China slowdown, $96 billion Greek bailout/elections, and Paris/San Bernardino terrorist attacks forced some nervous investors to count sheep to fall asleep. However, long-term investors understand that underpinning this long-lived bull market are record revenues, profits, and cash flows. The record $4.7 trillion dollars in 2015 estimated mergers along with approximately $1 trillion in dividends and share buybacks (see chart below) is strong confirmation that investors should be concentrating on counting more cash cows than sheep, if they want to sleep comfortably.
INVESTMENT NIGHTMARES
Creepy Commodities: Putting aside the -30% collapse in WTI crude oil prices last year, commodity investors overall were exhausted in 2015. The -24% decline in the CRB Commodity Index and the -11% weakening in the Gold Index (GLD) was further proof that a strong U.S. dollar, coupled with stagnant global growth, caused investors a lot of tossing and turning. While bad for commodity exporting countries, the collapse in commodity prices will ultimately keep a lid on inflation and eventually become stimulative for those consumers suffering from lower standards of living.
Dollar Dread: The +25% spike in the value of the U.S. dollar over the last 18 months has made life tough for multinational companies. If your business received approximately 35-40% of their profits overseas and suddenly your goods cost 25% more than international competitors, you might grind your teeth in your sleep too. Monetary policies around the globe, including the European Union, will have an impact on the direction of future foreign exchange rates, but after a spike in the value of the dollar in early 2015, there are signs this scary move may now be stabilizing. Although multinationals are getting squeezed, now is the time for consumers to load up on cheap imports and take that bargain foreign vacation they have long been waiting for.
January has been a challenging month the last couple years, and inevitably there will be additional unknown turbulence ahead – the opening day of 2016 not being an exception (i.e., China slowdown concerns and Mideast tensions). However, given near record-low interest rates, record corporate profits, and accommodative central bank policies, the 2015 nap taken by global stock markets should supply the necessary energy to provide a lift to financial markets in the year ahead.

Wade W. Slome, CFA, CFP®
Plan. Invest. Prosper.
DISCLOSURE: Sidoxia Capital Management (SCM) and some of its clients hold positions VHT, AGG, and in certain exchange traded funds (ETFs), but at the time of publishing had no direct position VT, BTK, XLY, VGT, GLD, or in any other security referenced in this article. No information accessed through the Investing Caffeine (IC) website constitutes investment, financial, legal, tax or other advice nor is to be relied on in making an investment or other decision. Please read disclosure language on IC Contact page.
Sweating in the Doctor’s Waiting Room

My palms are clammy, heart-rate is elevated, and sweat has begun to drip down my brow. There I sit with my hands clenched in the doctor’s office waiting room. I’m trying to mentally prepare for the inevitable poking, prodding, and personal invasion, which will likely involve numerous compromising cavity searches from head to toe. The fun usually doesn’t end until a finale of needle piercing vaccinations and blood tests are completed.
Every year I go through the same mental fatigue war, battling every fear, uncertainty, and doubt. Will the doctor find a new ailment? How many shots will I have to get? Am I going to die?! Ultimately it never turns out as badly as I expect and I come out each and every doctor’s appointment saying, “Well, that wasn’t as bad as I thought it was going to be.”
Investors have been nervously sitting in the waiting room of the Federal Reserve for the last nine years (2006), which marks the last time the Fed increased the interest rate target for the Federal Funds rate. In arguably the slowest economic recovery since World War II, pundits, commentators, bloggers, strategists, and economists have been speculating about the timing of the Fed’s first rate hike of this economic cycle. Like anxious patients, investors have fretted about the reversal of our country’s unprecedented zero interest rate monetary policy (ZIRP).
Despite dealing with the most communicative Federal Reserve in a few generations signaling its every thought and concern, uncertainty somehow continues to creep into investors’ psyches and reign supreme. We witnessed this same volatility occur between 2012-2014 when Ben Bernanke and the Fed decided to phase out the $4.5 trillion quantitative easing (QE) bond buying program. At the time, many people felt the financial markets were being artificially propped up by the money printing feds, and once QE ended, expectations were for exploding interest rates and the stock market/economy to fall like a house of cards. As we all know, that prediction turned out to be the furthest from the truth. In fact, quite the opposite occurred. Investors took their medicine (halting of QE) and the market proceeded to move upwards by about +40% from the initial “taper tantrum” (talks of QE ending in spring of 2012) until the actual QE completion in October 2014.
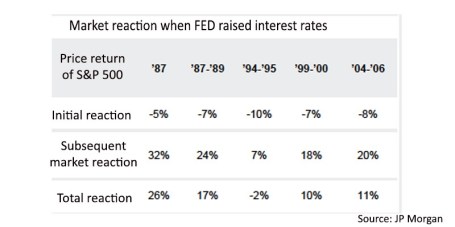
The thought of rate hike cycles are never fun, but after swallowing the initial rate hike pill, investors will feel just fine after coming to terms with the gentle trajectory of future interest rate increases. The behavioral model of 1) investor fear, then 2) subsequent relief has been a recurring process throughout economic history. As you can see below, the bark of Federal Reserve interest rate target hikes has been much worse than the bite. Initially there is a modest negative reaction (approximately -7% decline in stock prices) and then a significant positive reaction (about +21%).
With an ultra-dove Fed Chief in charge, this rate hike cycle should look much different than prior periods. Chairwoman Yellen has clearly stated, “Even after the initial increase in the target funds rate, our policy is likely to remain highly accommodative.” Her colleague, New York Fed Chair William Dudley, has supported this idea by noting the path of rate hikes will be “shallow.”
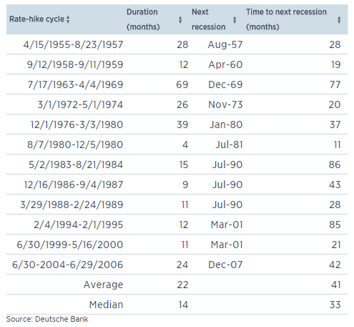
Even if you are convinced rate hikes will cause an immediate recession, history is not on your side as shown in the study below. On average, since 1955, the time to a next recession after a Fed Rate hike takes an average of 41 months (ranging from 11 months to as long as 86 months).
As a middle aged man, one would think I would get used to my annual doctor’s check-up, but somehow fear manages to find a way of asserting itself. Investors’ have been experiencing the same anxiety as anticipation builds before the first interest rate hike announcement – likely this week. Markets may continue their jitteriness in front of the Fed’s announcement, but based on history, a ¼ point hike is more likely to be a prescription of economic confidence than economic doom. Everyone should feel much better leaving the waiting room after Janet Yellen finally begins normalizing an unsustainably loose monetary policy.
Wade W. Slome, CFA, CFP®
Plan. Invest. Prosper.
DISCLOSURE: Sidoxia Capital Management (SCM) and some of its clients own certain exchange traded funds, but at the time of publishing SCM had no direct position in any other security referenced in this article. No information accessed through the Investing Caffeine (IC) website constitutes investment, financial, legal, tax or other advice nor is to be relied on in making an investment or other decision. Please read disclosure language on IC “Contact” page.
Dying Unicorns

Historically, when people speak about unicorns they are referring to those magical white horses with long horns sprouting from their foreheads. Today, in Silicon Valley and on Wall Street, “unicorns” refer to those private companies valued at more than $1 billion. The current list of unicorns is extensive, including household names like money-losing Uber ($51.0 billion valuation), Airbnb ($25.5 billion), SnapChat ($15.3 billion), and about 150 other money-losing companies with a combined valuation of approximately a half trillion dollars (see list here). Just like the mythical unicorns we imagine and read about in fairy tales, Silicon Valley unicorns are at risk of dying off and becoming a myth as well.
Square at the Heart of the Problem
Following young technology start-ups with names like, Box, Dropbox, and Square can become quite confusing, but investors are becoming less confused about their desire for profits and fair valuations. The recent –33% discount in the planned pre-IPO offering price of Square shares to $11 – $13 ($4 billion) from the last private funding valuation of $15.46 ($6 billion) is signaling the deteriorating health of money-losing unicorns.
Adding insult to injury, money-losing Square provided recent private investors with a controversial “ratchet” clause, which essentially gives privileged investors additional shares, if the IPO (Initial Public Offering) price does not occur at a minimum set price. The net result is a fraction of advantaged investors receive a disproportionate percentage of the company’s value, while a majority of the other investors see their ownership value diluted. According to Forbes, approximately 30% of unicorns carry some contentious ratchet provisions, which may make IPO exits for these companies that much more difficult.
The recent Square news comes on the heels of other unicorns like Dropbox seeing its pre-IPO value being reduced by -24% from industry giant BlackRock Inc (BLK), an early Dropbox investor. According to the Wall Street Journal¸ bankers close to the company admitted achieving a pre-IPO valuation of $10 billion will be challenging. Subsequently, mutual fund behemoth Fidelity wrote down the value of social media, photo disappearing, mobile application company, Snapchat, by -25%.
Unfortunately, the problems for unicorn companies don’t stop after the IPO. Take for example, Fitbit Inc (FIT), the newly minted $6 billion IPO, which took place in June. Even though the wearable technology company may no longer be a unicorn, the -31% decline in its share price during the first half of November is evidence there are consequences to insiders dumping additional over-priced (or high-priced) shares on investors. Of the planned 17 million secondary share sale, the vast majority of the proceeds (14 million shares) are going to insiders who are taking the money and running, thereby leaving the company itself with a much smaller portion of the offering dollars.
Veteran investors have seen this movie before during the late 1990s tech bubble, and investors know that this type of movie ends very badly. As in any bubble, if you are able to participate early enough during the inflation process, it can be a spectacular ride before the bubble bursts. Unicorn companies can sell a dream for a while, but profitless prosperity cannot last forever. Eventually, profits and cash flows do become important for investors. And for some unicorn companies, the day of reckoning appears to have arrived now. It has been a fun, fairy tale ride for unicorn investors up until now, but with a half trillion dollars in unicorn investments beginning to die off, these early stage companies will need a steadier diet of profits to stay alive.
Wade W. Slome, CFA, CFP®
Plan. Invest. Prosper.
DISCLOSURE: Sidoxia Capital Management (SCM) and some of its clients hold positions in certain exchange traded funds (ETFs), but at the time of publishing, SCM had no direct position in Uber, Airbnb, SnapChat, Box, Dropbox, Square, BLK, FIT and any other security referenced in this article. No information accessed through the Investing Caffeine (IC) website constitutes investment, financial, legal, tax or other advice nor is to be relied on in making an investment or other decision. Please read disclosure language on IC Contact page.
Extrapolation: Dangers of the Reckless Ruler

The game of investing would be rather simple if everything moved in a straight line and economic data points could be could be connected with a level ruler. Unfortunately, the real world doesn’t operate that way – data points are actually scattered continuously. In the short-run, inflation, GDP, exchange rates, interest rates, corporate earnings, profit margins, geopolitics, natural disasters, financial crises, and an infinite number of other factors are very difficult to predict with any accurate consistency. The true way to make money is to correctly identify long-term trends and then opportunistically take advantage of the chaos by using the power of mean reversion. Let me explain.
Take for example the just-released October employment figures, which on the surface showed a blowout creation of +271,000 new jobs during the month (unemployment rate decline to 5.0%) versus the Wall Street consensus forecast of +180,000 (flat unemployment rate of 5.1%). The rise in new workers was a marked acceleration from the +137,000 additions in September and the +136,000 in August. The better-than-expected jobs numbers, the highest monthly addition since late 2014, was paraded across television broadcasts and web headlines as a blowout number, which gives the Federal Reserve and Chairwoman Janet Yellen more ammunition to raise interest rates next month at the Federal Open Market Committee meeting. Investors are now factoring in roughly a 70% probability of a +0.25% interest rate hike next month compared to an approximately 30% chance of an increase a few weeks ago.
As is often the case, speculators, traders, and the media rely heavily on their trusty ruler to connect two data points to create a trend, and then subsequently extrapolate that trend out into infinity, whether the trend is moving upwards or downwards. I went back in time to explore the media’s infatuation with limitless extrapolation in my Back to the Future series (see Part I; Part II; and Part III). More recently, weakening data in China caused traders to extrapolate that weakness into perpetuity and pushed Chinese stocks down in August by more than -20% and U.S. stocks down more than -10%, over the same timeframe.
While most of the media coverage blew the recent jobs number out of proportion (see BOOM! Big Rebound in Job Creation), some shrewd investors understand mean reversion is one of the most powerful dynamics in economics and often overrides the limited utility of extrapolation. Case in point is blogger-extraordinaire Scott Grannis (Calafia Beach Pundit) who displayed this judgment when he handicapped the October jobs data a day before the statistics were released. Here’s what Grannis said:
The BLS’s estimate of private sector employment tends to be more volatile than ADP’s, and both tend to track each other over time. That further suggests that the BLS jobs number—to be released early tomorrow—has a decent chance of beating expectations.
Now, Grannis may not have guaranteed a specific number, but comparing the volatile government BLS and private sector ADP jobs data (always released before BLS) only bolsters the supremacy of mean reversion. As you can see from the chart below, both sets of data have been highly correlated and the monthly statistics have reliably varied between a range of +100k to +300k job additions over the last six years. So, although the number came in higher than expected for October, the result is perfectly consistent with the “slowly-but-surely” growing U.S. economy.
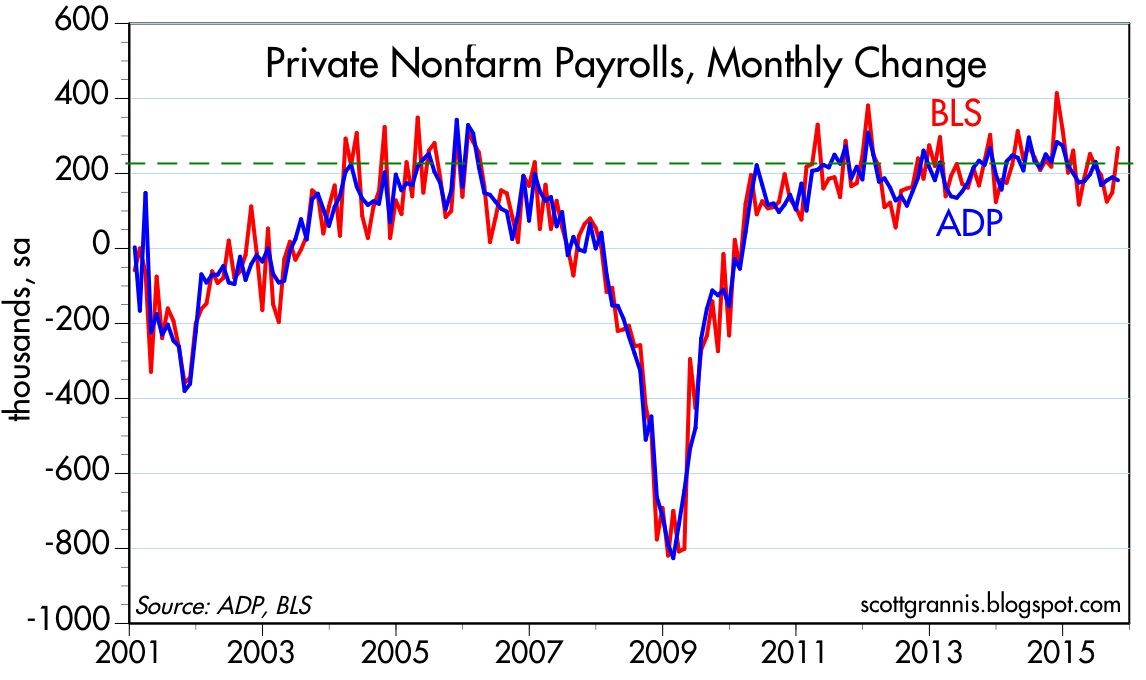
Source: Calafia Beach Pundit
While I spend much more time picking stocks than picking the direction of economic statistics, even I will agree there is a high probability the Fed moves interest rates next month. But even if Yellen acts in December, she has been very clear that this rate hike cycle will be slower than previous periods due to the weak pace of economic expansion. I agree with Grannis, who noted, “Higher rates would be a confirmation of growth, not a threat to growth.” Whatever happens next month, do yourself a favor and keep the urge of extrapolation at bay by keeping your pencil and ruler in your drawer.
Wade W. Slome, CFA, CFP®
Plan. Invest. Prosper.
DISCLOSURE: Sidoxia Capital Management (SCM) and some of its clients hold positions in certain exchange traded funds (ETFs) , but at the time of publishing, SCM had no direct position in any other security referenced in this article. No information accessed through the Investing Caffeine (IC) website constitutes investment, financial, legal, tax or other advice nor is to be relied on in making an investment or other decision. Please read disclosure language on IC Contact page.
Out of the Woods?

In the middle of the 24/7 news cycle, many investors get distracted by the headline du jour, much like a baby gets distracted by a shiny new object. While investor moods have been swinging violently back and forth, October’s performance has bounced back like a flying tennis ball. So far, the reversal in the S&P 500 performance has more than erased the -9% correction occurring in August and September. Could we finally be out of the woods, or will geopolitics and economic factors scare investors through Halloween and year-end?
Given recent catapulting stock prices, investor amnesia has erased the shear horror experienced over the last few months – this is nothing new for emotional stock market participants. As I wrote in Controlling the Lizard Brain, human brains have evolved the almond-shaped tissue in our brains (amygdala) that controlled our ancestors’ urge to flee ferocious lions. Today the urge is to flee scary geopolitical and economic headlines.
I expanded on the idea here:
“When the brain in functioning properly, the prefrontal cortex (the front part of the brain in charge of reasoning) is actively communicating with the amygdala. Sadly, for many people, and investors, the emotional response from the amygdala dominates the rational reasoning portion of the prefrontal cortex. The best investors and traders have developed the ability of separating emotions from rational decision making, by keeping the amygdala in check.”
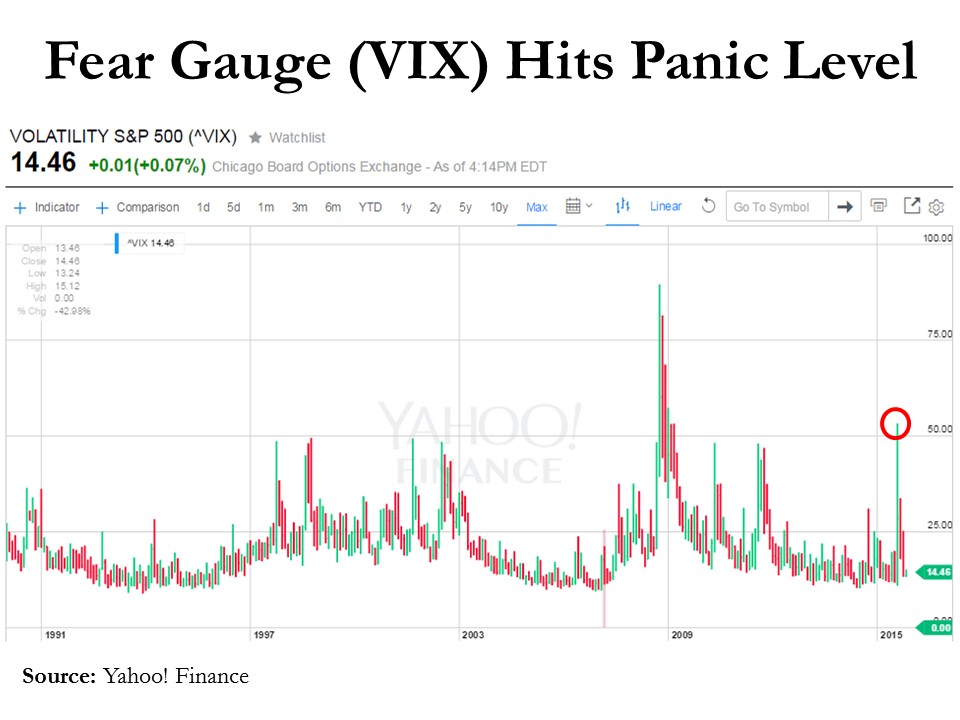
Evidence of lizard brains fear for flight happened just two months ago when the so-called “Fear Gauge” (VIX – Volatility Index) hit a stratospherically frightening level of 53 (see chart below), reached only once over the last few decades (2008-09 Financial Crisis).
Just as quickly as slowing China growth and a potential Fed interest rate hike caused investors to crawl underneath their desks during August (down –11% in four days), while biting their fingernails, investors have now sprung outside to the warm sunshine. The end result has been an impressive, mirror-like +11% increase in stock prices (S&P 500) over the last 18 trading days.
Has anything really changed over the last few weeks? Probably not. Economists, strategists, analysts, and other faux-soothsayers get paid millions of dollars in a fruitless attempt to explain day-to-day (or hour-by-hour) volatility in the stock markets. One Nobel Prize winner, Paul Samuelson, understood the random nature of stock prices when he observed, “The stock market has forecast nine of the last five recessions.” The pundits are no better at consistently forecasting stock prices.
As I have reiterated many times before, the vast majority of the pundits do not manage money professionally – the only people you should be paying attention to are successful long-term investors. Even listening to veteran professional investors can be dangerous because there is often such a wide dispersion of opinions based on varying time horizons, strategies, and risk tolerances.
Skepticism remains rampant regarding the sustainability of the bull market as demonstrated by the -$100 billion+ pulled out of domestic equity funds during 2015 (Source: ICI). The Volatility Index (VIX) shows us the low-hanging fruit of pessimism has been picked with the metric down -73% from August. With legislative debt ceiling and sequestration debates ahead in the coming weeks, we could hit some more choppy waters. Short-term volatility may resurrect itself, but the economy keeps chugging along, interest rates remain near all-time lows, and stock valuations, broadly speaking, remain reasonable. Investors may not be out of the woods yet, but one thing remains certain…an ever-changing stream of fearful headlines are likely to continue flooding in, which means we must all keep our lizard brains in check.
Wade W. Slome, CFA, CFP®
Plan. Invest. Prosper.
DISCLOSURE: Sidoxia Capital Management (SCM) and some of its clients hold positions in certain exchange traded funds (ETFs), but at the time of publishing, SCM had no direct position in any other security referenced in this article. No information accessed through the Investing Caffeine (IC) website constitutes investment, financial, legal, tax or other advice nor is to be relied on in making an investment or other decision. Please read disclosure language on IC Contact page.
Marathon Market Gets a Cramp

This article is an excerpt from a previously released Sidoxia Capital Management complimentary newsletter (October 1, 2015). Subscribe on the right side of the page for the complete text.
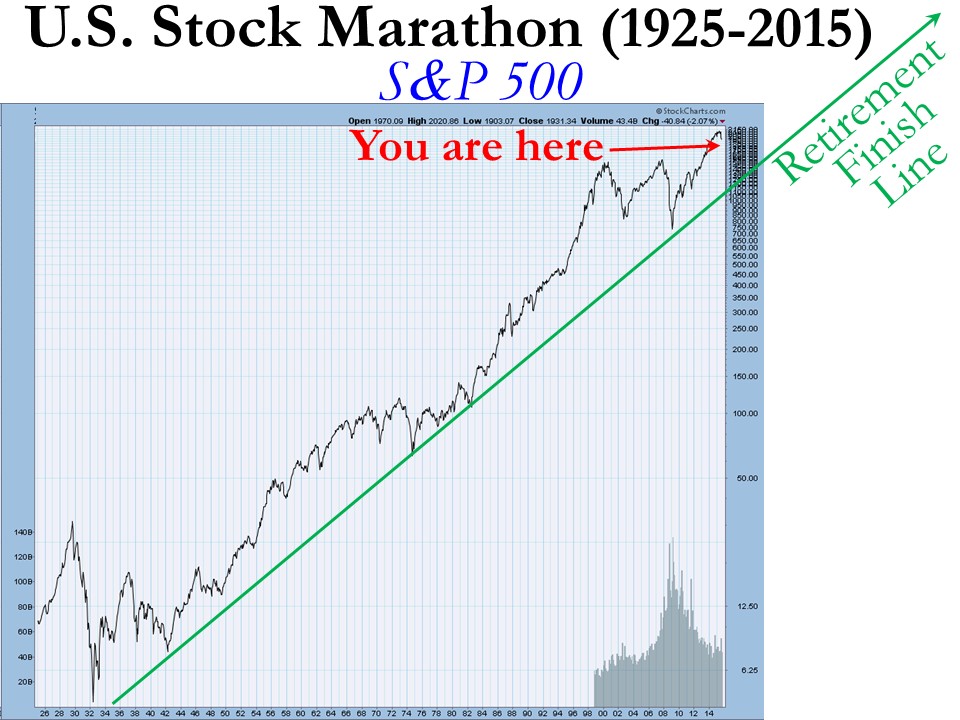
“Anyone can run a hundred meters, it’s the next forty-two thousand and two hundred that count.”
Investing is a lot like running a marathon…but it’s not a sprint to the retirement finish line. The satisfaction of achieving your long-term goal can be quite rewarding, but attaining ambitious objectives does not happen overnight. Along the hilly and winding course, there can be plenty of bumps and bruises mixed in with the elation of a runner’s high. While stocks have been running at a record pace in recent years, prices have cramped up recently as evidenced by the -2.6% decline of the S&P 500 stock index last month.
But the recent correction should be placed in the proper perspective as you approach and reach retirement. Since the end of the 2008 Financial Crisis the stock market has been racing ahead at a brisk rate, as you can see from the total return performance below (excluding 2015):
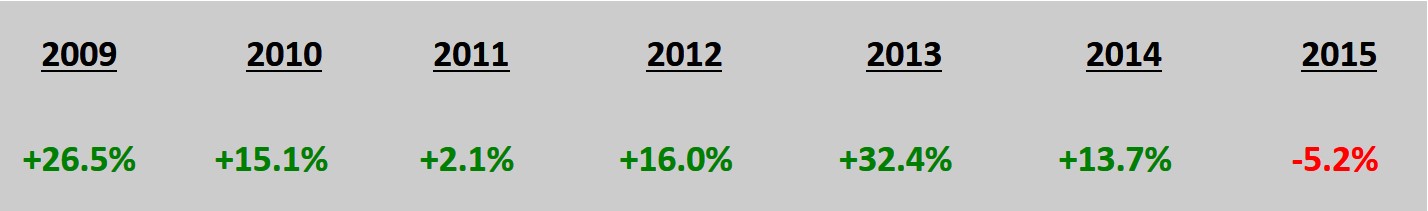
This performance is more indicative of a triumph than a catastrophe, but if you turned on the TV, listened to the radio, or surfed the web, you may come to a more frightening conclusion.
What’s behind the recent dip? These are some of the key concerns driving the recent price volatility:
- China: Slowing growth in China and collapse in Chinese stock market. China is suffering from a self-induced slowdown designed to mitigate corruption, prick the real estate bubble, and shift its export-driven economy to a more consumer-driven economy. These steps diminish short-term growth (albeit faster than U.S. growth), but nevertheless the measures should be constructive for longer-term growth.
- Interest Rates: Uncertainty surrounding the timing of a 0.25% target interest rate increase by the Federal Reserve. The move from 0% to 0.25% is like walking from the hardwood floor onto the rug…hardly noticeable. The inevitable move by the Fed has been widely communicated for months, and given where interest rates are today, the move will have a negligible impact on corporate borrowing costs. Like removing a Band-Aid, the initial action may cause some pain, but should be comfortably received shortly thereafter.
- Politics: Potential government shutdown / sequestration. The epic political saga will never end, however, as I highlighted in “Who Said Gridlock is Bad?,” political discourse in Washington has resulted in positive outcomes as it relates to our country’s fiscal situation (limited government spending and declining deficits). The government shutdown appears to have been averted for now, but it looks like we will be blanketed with brinkmanship nonsense again in a few months.
- Biotech/Pharmaceuticals: Politics over lofty drug prices and the potential impact of future regulation on the biotech sector. Given the current Congressional balance of power, any heavy-handed Democratic proposals is likely to face rigorous Republican opposition.
- Emerging Markets: Emerging market weakness, especially in Latin America (e.g., Brazil). These developments deserve close monitoring, but the growth in the three largest economic regions (U.S., Europe, and China) will have a much larger effect on the direction of global economic expansion.
- Middle East: Destabilized Middle East and Syria. Terrorist extremism and cultural animosity between various Middle East populations has existed for generations. There will be no silver bullet for a peaceful solution, so baby steps and containment are critical to maintain healthy global trade activity with minimal disruptions.
Worth noting, this current list of anxieties itemized above is completely different from six months ago (remember the Greece crisis?), and the list will change again six months into the future. Investing, like any competitive challenge, does not come easy…there is always something to worry about in the land of economics and geopolitics.
Here’s what the world’s top investor Warren Buffett said a few decades ago (1994) on the topic of politics and economics:
“We will continue to ignore political and economic forecasts which are an expensive distraction for investors and businessmen. Thirty years ago, no one could have foreseen the huge expansion of the Vietnam War, wage and price controls, two oil shocks, the resignation of a president, the dissolution of the Soviet Union, a one-day drop in the Dow of 508 points, or treasury bill yields fluctuating between 2.8% and 17.4%.”
In a world of 7.3 billion people and 196 countries there will never be a shortage of fear, uncertainty, and doubt (F.U.D.) – see events chart in The Bungee Market. In an ever-increasing, globally connected world, technology and the media continually amplify molehills into mountains, thereby making the next imagined Armageddon a simple click of a mouse or swipe of a smartphone away.
Today’s concerns are valid but in the vast majority of cases the issues are completely overblown, sensationalized and over-emphasized without context. Context is an integral part to investing, but unfortunately context usually cannot be explained in a short soundbite or headline. On the flip side, F.U.D. thrives in the realm of soundbites and headlines.
While investors may feel fatigued from a strong flow of headline headwinds, financial market race participants should take a break at the water stop to also replenish themselves with a steady tailwind of positive factors, including the following:
- Employment: The unemployment rate has been cut from a recession peak of 10.0% down to 5.1%, and the economy has been adding roughly +200,000 new monthly jobs on a fairly consistent basis. On top of that, there are a record 5.8 million job openings versus 3.7 million two years ago – a sign that the economy continues to hum along.
- Housing/Commercial Real Estate/Mortgage Rates: Housing prices have rebounded by about +30% from the 2012 lows; Housing starts have increased by +25% in the past year and 120% in the past four years; and 30-Year Fixed mortgage interest rates sit at 3.85% – a highly stimulative level within a spitting distance from record lows.
- Auto Sales: Surged to a post-recession record of 17.8 million units in August.
- Interest Rates: Massively stimulative and near generational lows, even if the Fed hikes its interest rate target by 0.25% in October, December or sometime in 2016.
- Capital Goods Orders: Up for three consecutive months.
- Rail Shipments/Truck Tonnage: Both these metrics are rising by about 3-4%.
- Retail Sales: Rising at a very respectable pace of 7% over the last six months.
- Low Energy & Commodity Prices: Inflation has remained largely in check thanks to plummeting commodity prices. Low oil and gas prices are benefiting consumers in numerous ways, including the contribution to car sales, home sales, and/or debt reduction.
While the -10% dip in stock prices from mid-August might feel like a torn knee ligament, long-term investors know -10% corrections historically occur about one-time per year, on average. So, even though you may be begging for a wheelchair, the best course of action is to take a deep breath, stick to your long-term investment plan, rebalance your portfolio if necessary, and continue staying on course towards your financial finish line.
Wade W. Slome, CFA, CFP®
Plan. Invest. Prosper.
DISCLOSURE: Sidoxia Capital Management (SCM) and some of its clients hold positions in certain exchange traded funds (ETFs) , but at the time of publishing, SCM had no direct position in any other security referenced in this article. No information accessed through the Investing Caffeine (IC) website constitutes investment, financial, legal, tax or other advice nor is to be relied on in making an investment or other decision. Please read disclosure language on IC Contact page.
Coast is Clear Until 2019

The economic recovery since the Great Financial Crisis of 2008-09 has been widely interpreted as the slowest recovery since World War II. Bill McBride of Calculated Risk captures this phenomenon incredibly well in his historical job loss chart (see red line in chart below):
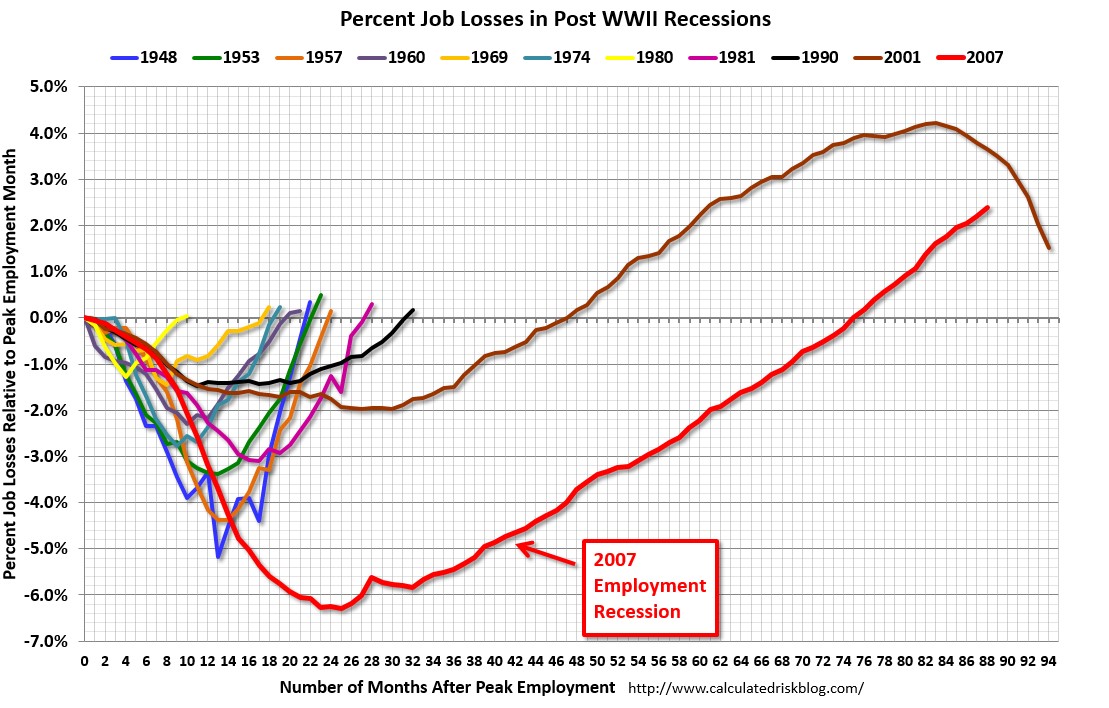
Source: Calculated Risk
History tells us that the economy traditionally suffers from an economic recession twice per decade, but we are closing in on seven years since the last recession with little evidence of impending economic doom.
So, are we due for another recession? Logic would dictate that since this recovery has been the slowest in a generation, the duration of this recovery should also be the longest. Strategist Ed Yardeni of Dr. Ed’s Blog uses data from historical economic cycles and CEI statistics (Coincident Economic Indicators) to make the same case. Based on his analysis, Yardeni does not see the next recession arriving until March 2019 (see chart below). If you take a look at the last five previous cycle peaks, recoveries generally last for an additional five and a half years (roughly 65 months). Since the last rebound to a cyclical peak occurred in October 2013, 65 months from then would imply the next downturn would begin in March 2019.
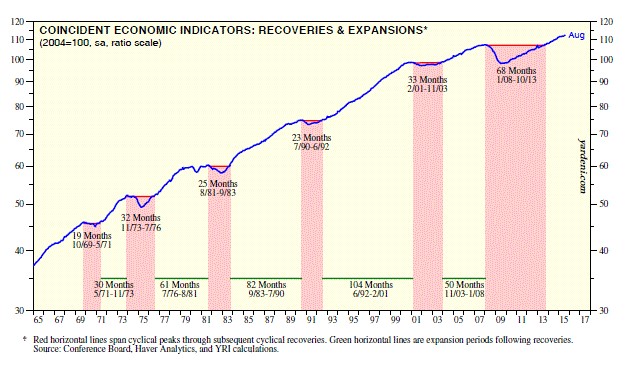
Source: Dr. Ed’s Blog
Typically, an economy loses steam and enters a recession after a phase of over-investment, tight labor conditions, and an extended period of tight central bank monetary policies. Over the last seven years, we have experienced quite the opposite. Corporations have been very slow to invest or hire new employees. For those employees hired, many of them are “under-employed” (i.e., working part-time), or in other words, these workers want more work hours. Our country’s slower-than-expected growth has created an output gap. Scott Grannis at Calafia Beach Pundit estimates this gap to approximate $2.8 trillion (see chart below). The CBO expects a smaller gap estimate of about $580 billion to narrow over the next few years. By Grannis’s calculations, there is a reservoir of 5 – 10 million jobs that could be tapped if the economy was operating more efficiently.
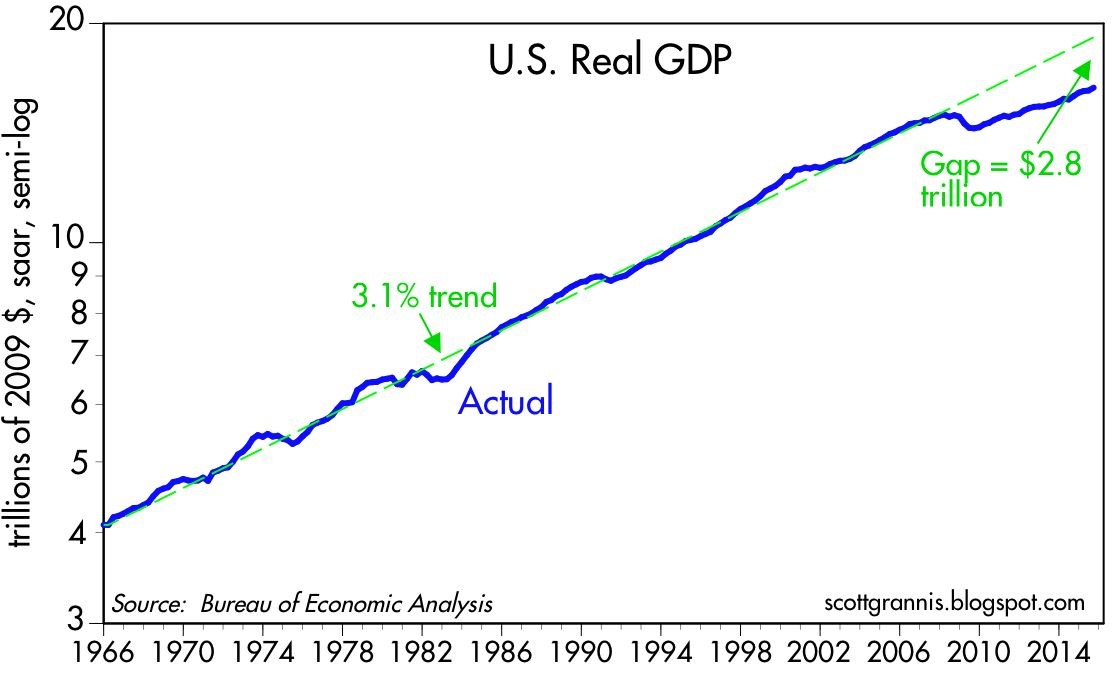
Source: Calafia Beach Pundit
Bolstering his argument, Grannis points out that the risk of a recession rises when there are significant capacity constraints and tight money. He sees the opposite happening – an enormous supply of unused capacity remains underutilized as he describes here:
“Today, money is abundant and resources are abundant. Even energy is abundant, because its price has fallen by over 50% in the past year or so. Corporate profits are near record highs, the supply of labor is virtually unconstrained, energy is suddenly cheap, and productive capacity is relatively abundant.”
While new uncertainties have been introduced (e.g., slowing China, potential government shutdown/sequestration, emerging market weakness), the reality remains there is always uncertainty. Even if you truly believe there is more uncertainty today relative to yesterday, the economy has some relatively strong shock absorbers to ride out the volatility.
There are plenty of potentially bad things to worry about, but if it’s a cyclical recession that you are worried about, then why don’t you grab a seat, order a coconut drink with an umbrella, and wait another three and a half years until you reach the circled date of March 2019 on your calendar.
Wade W. Slome, CFA, CFP®
Plan. Invest. Prosper.
DISCLOSURE: Sidoxia Capital Management (SCM) and some of its clients hold positions in certain exchange traded funds (ETFs) , but at the time of publishing, SCM had no direct position in any other security referenced in this article. No information accessed through the Investing Caffeine (IC) website constitutes investment, financial, legal, tax or other advice nor is to be relied on in making an investment or other decision. Please read disclosure language on IC Contact page.
To Test or Retest?

In Shakespeare’s tragedy Hamlet, the main character Prince Hamlet raises the existential question to himself, “To be, or not to be, that is the question?” With the recent -13% correction in the S&P 500 index, and subsequent mini-rebound, a lot of investors have also been talking to themselves and asking the fundamental question, “To test or retest, that is the question?” The inability of Fed Chairwoman dove, Janet Yellen, to increase the Federal Funds interest rate target by 0.25% after nine years only increased short-term uncertainty.
For investors playing in the stock market, uncertainty and corrections are par for the course. Howard Getson at Capitalogix recently pointed out the following.
Since 1900, on average, we’ve experienced…
- -5% market corrections: 3 times/year.
- -10% market corrections: 1 time/ year.
- -20% market corrections: 1 time/3.5 years.
However, no market correction is the same. Sure it would be nice if, during every bull market, the pain from any -10% correction lasted a second – similar to ripping off a Band-Aid. Unfortunately, when you live through such rapid and violent corrections, as we just did, volatility tends to stick around for a while. And in many instances, any brief rebound in stock prices is met with another downdraft in prices that retests the recent lows in prices.
In the recent correction example, a retest of the lows would mean another -5% drop, on top of Friday’s -2% cut, to a level of 1,867 on the S&P 500 index. This is definitely a realistic probability (see chart below).
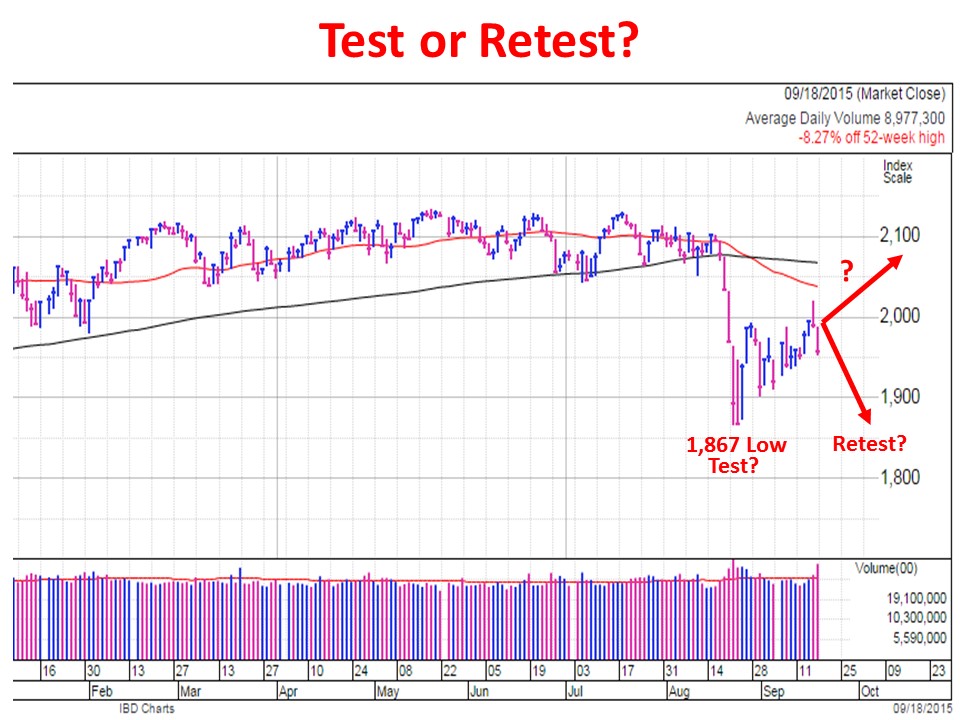
Chart Source: Investors.com (Powered by IBD)
Although corrections are quite common, violent corrections are less common. Scott St. Clair, an analyst at MarketSmith, a division of William O’Neil & Co., recently did a study examining the frequency of 10%+ corrections occurring in four days or less across the three major indices (Dow Jones Industrial, S&P 500, and NASDAQ). Before the latest -15% decline in the NASDAQ from August 19th to August 24th, St. Clair only identified drops of -10% or more (in four trading sessions) eight previous times since the Great Depression (six of the eight periods are listed below).
- DJIA May 1940 -26% in eight days
- DJIA May 1962 -16% in 10 days
- S&P 500 Aug 1998 -15% in five days
- S&P 500 July 2002 -25% in 13 days
- S&P 500 October 2008 -33% in 15 days.
- S&P 500 August 2011 -19% in 13 days
Following all these corrections, the market always rebounded, but what St. Clair showed was in many cases stock prices had to retest the previous lows before advancing again.
As Mark Twain said, “History doesn’t repeat itself but it often rhymes,” which explains why this study is a useful historical exercise to prepare investors for potential future downdrafts. With that said, for long-term investors, much of this utility is marginal at best and useless at worst.
If you can’t handle the volatility, you need a more diversified portfolio, or you need to park your money in a savings account or CD and watch it melt away to inflation.
In reviewing corrections, famed growth investor Peter Lynch said it best:
“I can’t recall ever once having seen the name of a market timer on Forbes’ annual list of the richest people in the world. If it were truly possible to predict corrections, you’d think somebody would have made billions by doing it.”
Whether the August 24th low was the only test of this correction, or investors retest it again, is a moot point. Ignoring irrelevant headlines and focusing your attention on a low-cost, tax-efficient, globally diversified investment portfolio is a better use of your time. That is a tenet for which Hamlet would certainly be willing to die.

Wade W. Slome, CFA, CFP®
Plan. Invest. Prosper.
DISCLOSURE: Sidoxia Capital Management (SCM) and some of its clients hold positions in certain exchange traded funds (ETFs) , but at the time of publishing, SCM had no direct position in any other security referenced in this article. No information accessed through the Investing Caffeine (IC) website constitutes investment, financial, legal, tax or other advice nor is to be relied on in making an investment or other decision. Please read disclosure language on IC Contact page.
Oxymoron: Shrewd Government Refis Credit Card

With the upcoming Federal Reserve policy meetings coming up this Wednesday and Thursday, investors’ eyes remain keenly focused on the actions and words of Federal Reserve Chairwoman Janet Yellen.
If you have painstakingly filled out an IRS tax return or frustratingly waited in long lines at the DMV or post office, you may not be a huge fan of government services. Investors and liquidity addicted borrowers are also irritated with the idea of the Federal Reserve pulling away the interest rate punch bowl too soon. We will find out early enough whether Yellen will hike the Fed Funds interest rate target to 0.25%, or alternatively, delay a rate increase when there are clearer signs of inflation risks.
Regardless of the Fed decision this week, with interest rates still hovering near generational lows, it is refreshing to see some facets of government making shrewd financial market decisions – for example in the area of debt maturity management. Rather than squeezing out diminishing benefits by borrowing at the shorter end of the yield curve, the U.S. Treasury has been taking advantage of these shockingly low rates by locking in longer debt maturities. As you can see from the chart below, the Treasury has increased the average maturity of its debt by more than 20% from 2010 to 2015. And they’re not done yet. The Treasury’s current plan based on the existing bond issuance trajectory will extend the average bond maturity from 70 months in 2015 to 80 months by the year 2022.
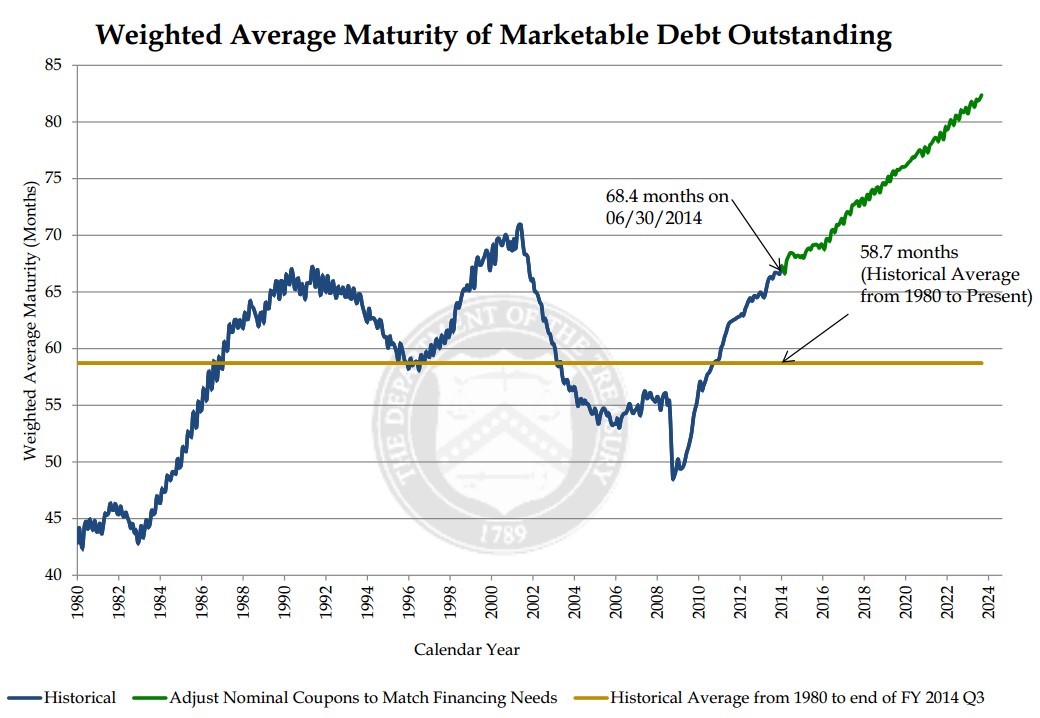
If you were racking up large sums of credit card debt at an 18% interest rate with payments due one month from now, wouldn’t you be relieved if you were given the offer to pay back that same debt a year from now at a more palatable 2% rate? Effectively, that is exactly what the government is opportunistically taking advantage of by extending the maturity of its borrowings.
Most bears fail to acknowledge this positive trend. The typical economic bear argument goes as follows, “Once the Fed pushes interest rates higher, interest payments on government debt will balloon, and government deficits will explode.” That argument definitely holds up some validity as newly issued debt will require higher coupon payments to investors. But at a minimum, the Treasury is mitigating the blow of the sizable government debt currently outstanding by extending the average Treasury maturity (i.e., locking in low interest rates).
It is worth noting that while extending the average maturity of debt by the Treasury is great news for U.S. tax payers (i.e., smaller budget deficits because of lower interest payments), maturity extension is not so great news for bond investors worried about potentially rising interest rates. Effectively, by the Treasury extending bond maturities on the debt owed, the government is creating a larger proportion of “high octane” bonds. By referring to “high octane” bonds, I am highlighting the “duration” dynamic of bonds. All else equal, a lengthening of bond maturities, will increase a bond’s duration. Stated differently, long duration, “high octane” bonds will collapse in price if in interest rates spike higher. The government will be somewhat insulated to that scenario, but not the bond investors buying these longer maturity bonds issued by the Treasury.
All in all, you may not have the greatest opinion about the effectiveness of the IRS, DMV, and/or post office, but regardless of your government views, you should be heartened by the U.S. Treasury’s shrewd and prudent extension of the average debt maturity. Now, all you need to do is extend the maturity and lower the interest rate on your personal credit card debt.

Wade W. Slome, CFA, CFP®
Plan. Invest. Prosper.
DISCLOSURE: Sidoxia Capital Management (SCM) and some of its clients hold positions in certain exchange traded funds (ETFs) , but at the time of publishing, SCM had no direct position in any other security referenced in this article. No information accessed through the Investing Caffeine (IC) website constitutes investment, financial, legal, tax or other advice nor is to be relied on in making an investment or other decision. Please read disclosure language on IC Contact page.
The Bungee Market

This article is an excerpt from a previously released Sidoxia Capital Management complimentary newsletter (September 1, 2015). Subscribe on the right side of the page for the complete text.
Are you an adrenaline junkie? You may be one and not even know it. If you are an investor in the stock market, you may have noticed a sinking feeling in your investment portfolio before a sharp bounce-back, much like a bungee jump. Before the recent drop of -6.6% in the Dow during August, some stock investors got lulled into a state of complacency, considering a tripling in stock prices over the last six years.
Almost any current or future news headline has the capability of potentially triggering a short-term bungee jump in stock prices. Now, worries over the health of the Chinese economy and financial markets, coupled with concerns of an impending rate hike by the Federal Reserve have created some tension for global financial markets. The slowdown in China should not be ignored, but as famed investor Bill Nygren pointed out, its impact should be placed in the proper context. China only represents 15% of global economic activity and U.S. exports to China only account for 0.7% of our GDP.
- 5% market corrections, 3 times per year on average (“correction” = price decline);
- 10% market corrections, 1 time per year on average; and
- 20% market corrections, 1 time every 3.5 years on average.
Welcome Back Volatility! Mini Flash Crash
- Economic growth revised higher (Q2 GDP raised to +3.7% from +2.3%)
- Unemployment rate continues to drop ( at 5.3%, a 7-year low)
- Interest rates near historic lows (3.95%, 30-year mortgage rate), which will remain massively stimulative even if the Fed modestly increases short-term rates
- U.S. corporate profits are near record highs (despite dampening effect of the strong U.S. dollar on exports)
- Reasonable valuations (improved after latest index price declines)
- Housing market on a steady recovery (existing home sales at multi-year highs and pricing up +6% vs. July of last year)
- Massively accommodative central banks around the globe (e.g., European Central Bank and People’s Bank of China)
Wade W. Slome, CFA, CFP®
Plan. Invest. Prosper.


