Posts filed under ‘Mutual Funds’
Quickly Out of the Gate

The race into 2024 has begun, and the U.S. market is off to a quick start. The S&P 500 jumped out of the gates by +1.6%, and the technology and AI (Artificial Intelligence) – heavy NASDAQ index raced out by +1.2%. The bull market rally broadened out at the end of 2023, but 2024 returned to the leaders of last year’s pack, the Magnificent 7 (see also Mission Accomplished). Out front, in the lead of the Mag 7, is Nvidia with a +24% gain in January.
Inflation dropping (see chart below), the Federal Reserve signaling a decline in interest rates, low unemployment (3.7%), and healthy economic growth (+3.3% Q4 – GDP) have all contributed to the continuing bull market run.

Source: Yardeni.com
Consumer spending is the number one driver of economic growth, and consumers remain relatively confident about future prospects as seen in the recently released Conference Board Consumer Confidence numbers released this week (see chart below).
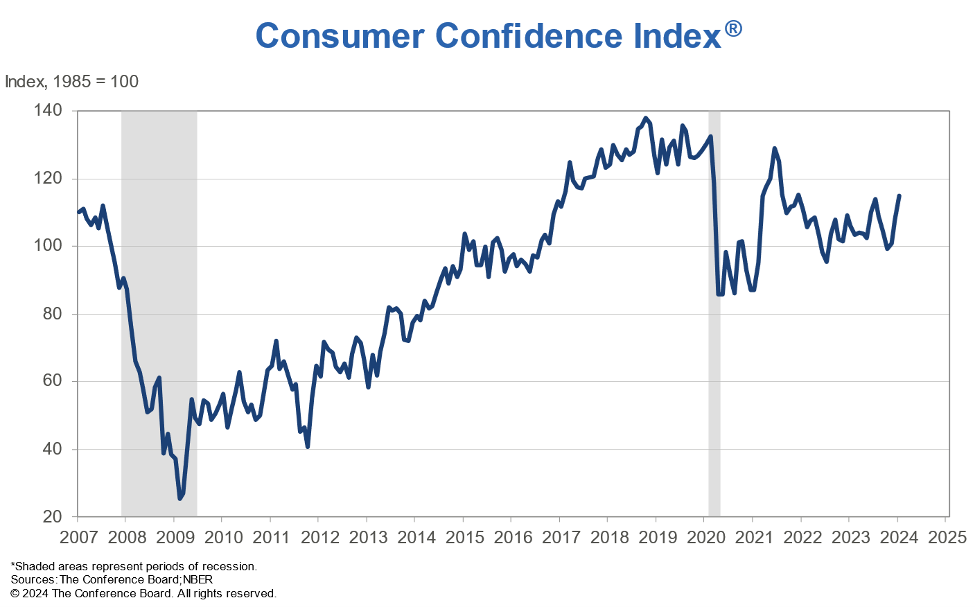
Source: Conference Board
But the race isn’t over yet, and there are always plenty of issues to worry about. The world is an uncertain place. Here are some of the concerns du jour:
– Red Sea conflict led by the Yemen-based, rebel group, Houthis
– Gaza war between Israel and Hamas
– Anxiety over November presidential election
– Ukraine – Russia war
Money Goes Where It is Treated Best
There are plenty of domestic concerns regarding government debt, deficit levels, and political frustrations on both sides of the partisan aisle remain elevated. When it comes to the financial markets, money continues to go where it is treated best. Sure, we have no shortage of problems or challenges, but where else are you going to put your life savings? China? Europe? Russia? Japan?
Well, as you can see in the chart below, anti-democratic, anti-American business, and confrontational military policies instituted by China have not benefitted investors – the U.S. stock market (S&P 500) has trounced the Chinese stock market (MSCI) over the last 30 years.
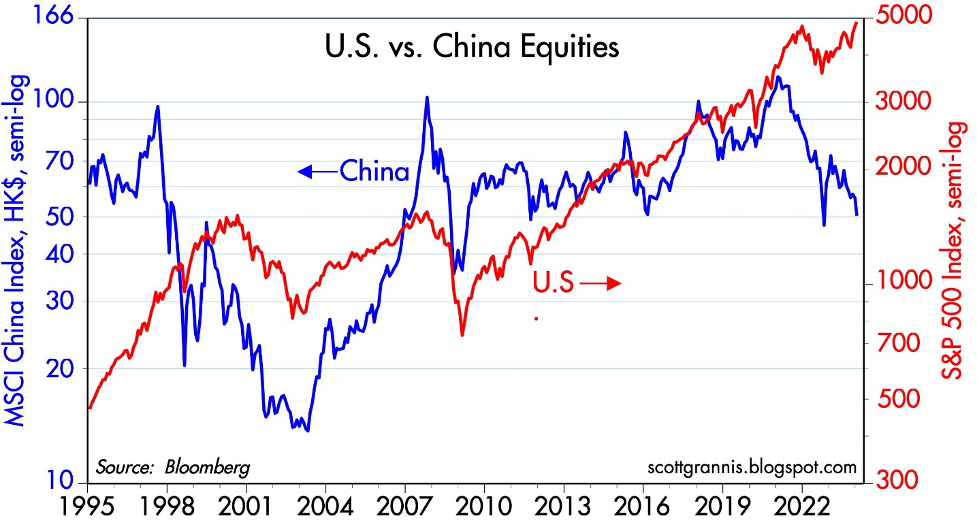
Source: Calafia Beach Pundit
For years, market critics and pessimists have been screaming doom-and-gloom as it relates to the United States. The story goes, the U.S. is falling apart, government spending and debt levels are out of control, politicians are corrupt, and we’re going into recession, thanks in part to higher interest rates and inflation. Well, if that’s the case, then why has the value of the U.S. dollar increased over the last 10 years (see chart below)? And why is the stock market at all-time record-highs?
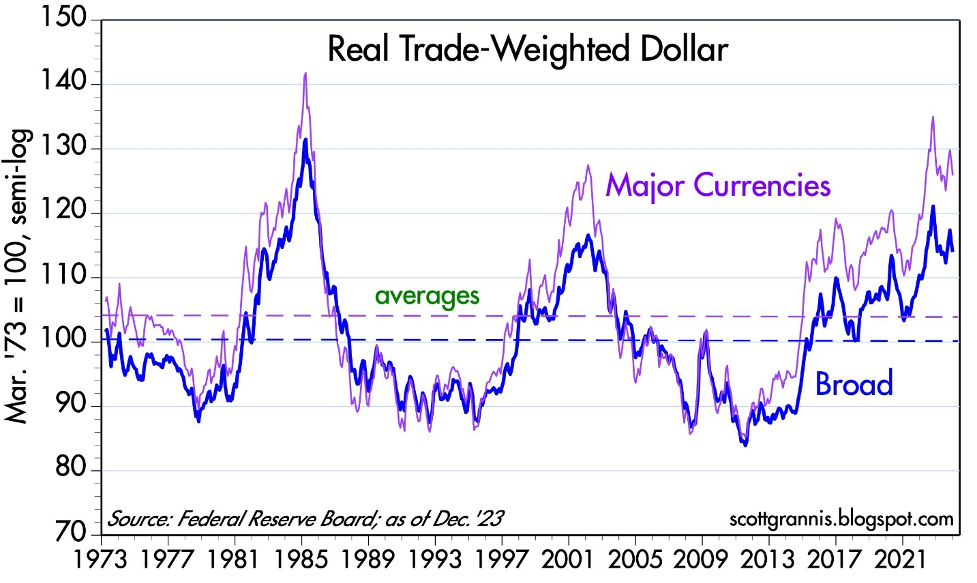
Source: Calafia Beach Pundit
Global investors are discerning in which countries they invest their hard-earned money. Global capital will flow to those countries with a rule of law, financial transparency, prudent tax policy, lower inflation, higher profit growth, lower interest rates, sensible fiscal and monetary policies, among other pragmatic business practices. There’s a reason they call it the “American Dream” and not the “Chinese Dream.” Our capitalist economy is far from perfect, but finding another country with a better overall investing environment is nearly impossible. There’s a reason why venture capitalists, private equity managers, sovereign wealth funds, hedge funds, and foreign institutions are investing trillions of their dollars in the United States. Money goes where it is treated best!
As money sloshes around the world, the 2024 investing race has a long way before it’s over, but at least the stock market has quickly gotten out of the gate and built a small lead.
Wade W. Slome, CFA, CFP®
Plan. Invest. Prosper.
This article is an excerpt from a previously released Sidoxia Capital Management complimentary newsletter (February 1, 2024). Subscribe Here to view all monthly articles.
DISCLOSURE: Sidoxia Capital Management (SCM) and some of its clients hold positions in NVDA, and certain exchange traded funds (ETFs), but at the time of publishing had no direct position in any other security referenced in this article. No information accessed through the Investing Caffeine (IC) website constitutes investment, financial, legal, tax or other advice nor is to be relied on in making an investment or other decision. Please read disclosure language on IC Contact page.
Sidoxia Webinar: The Keys to ’23 & What’s in Store for ’24 – Market Update

Unlock valuable insights at our upcoming webinar:
The Keys to ’23 & What’s in Store for ’24!
Tuesday, January 30th at 12:00 PM
Click the Zoom link below to register:
https://sidoxia.link/Webinar-Registration
Don’t miss out on the latest trends and expert discussions.
We will delve into a comprehensive market update. Register now!
The Douglas Coleman Show Interviews Wade Slome

Wade Slome, President and Founder of Sidoxia Capital Management, recently had the pleasure of being featured on The Douglas Coleman Show hosted by Douglas Coleman.
Drawing from professional and personal life lessons, Wade shares his knowledge about navigating market trends, building investment strategies, and also discuss the books he has authored.
If you are interested in learning more about the books Wade has authored, please visit: https://www.sidoxia.com/wades-books
This Baby Bull Has Time to Grow

You may have witnessed some fireworks on New Year’s Eve, but those weren’t the only fireworks exploding. The last two months of 2023 finished with a bang! More specifically, over this short period, the S&P 500 index skyrocketed +13.7%, NASDAQ +16.8%, and the Dow Jones Industrial Average +14.0%. The gains have been even more impressive for the cheaper, more interest-rate-sensitive small-cap stocks (IJR +21.8%), which I have highlighted for months (see also AI Revolution).
For the full year, the bull market was on an even bigger stampede: S&P 500 +24%, NASDAQ +43%, and Dow +14%.
Although 2023 closed with a festive explosion, 2022 ended with a bearish growl. Effectively, 2023 was a reverse mirror image of 2022. In 2022, the stock market fell -19% (S&P) due to a spike in inflation. Directionally, interest rates followed inflation higher as the Fed worked through the majority of its 0% to 5.5% Federal Funds rate hiking cycle.
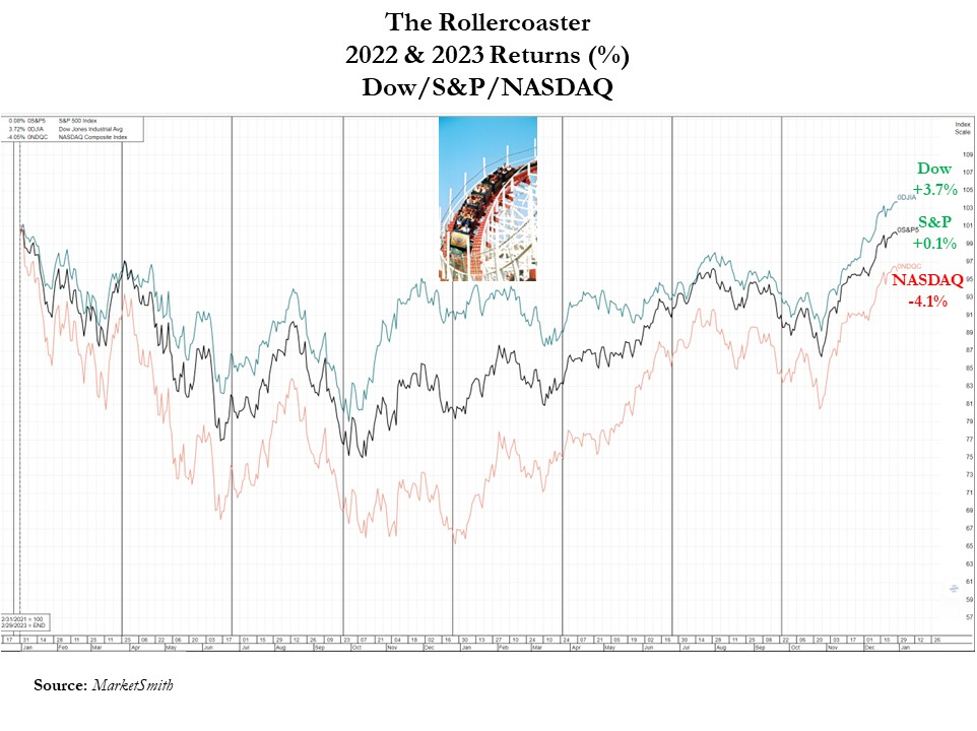
To sum it up simply, the last two years have been like riding a rollercoaster. For the year just ended, much of the year felt like a party, but 2022 felt more like a funeral. When you add the two years together, it was more of a lackluster result. For 2022-2023 combined, results registered at a meager +0.1% for the S&P, +3.7% for the Dow, and -4.0% for the NASDAQ (see chart below).
For those saying the good times of 2023 cannot continue, investors should understand that history paints a different picture. As you can see from the stock market cycles chart (below) that spans back to 1962, the average bull market lasts 51 months (i.e., 4 years, 3 months), while the average bear market persists a little longer than 11 months. This data suggests the current one-year-old baby bull market has plenty of room to grow more.
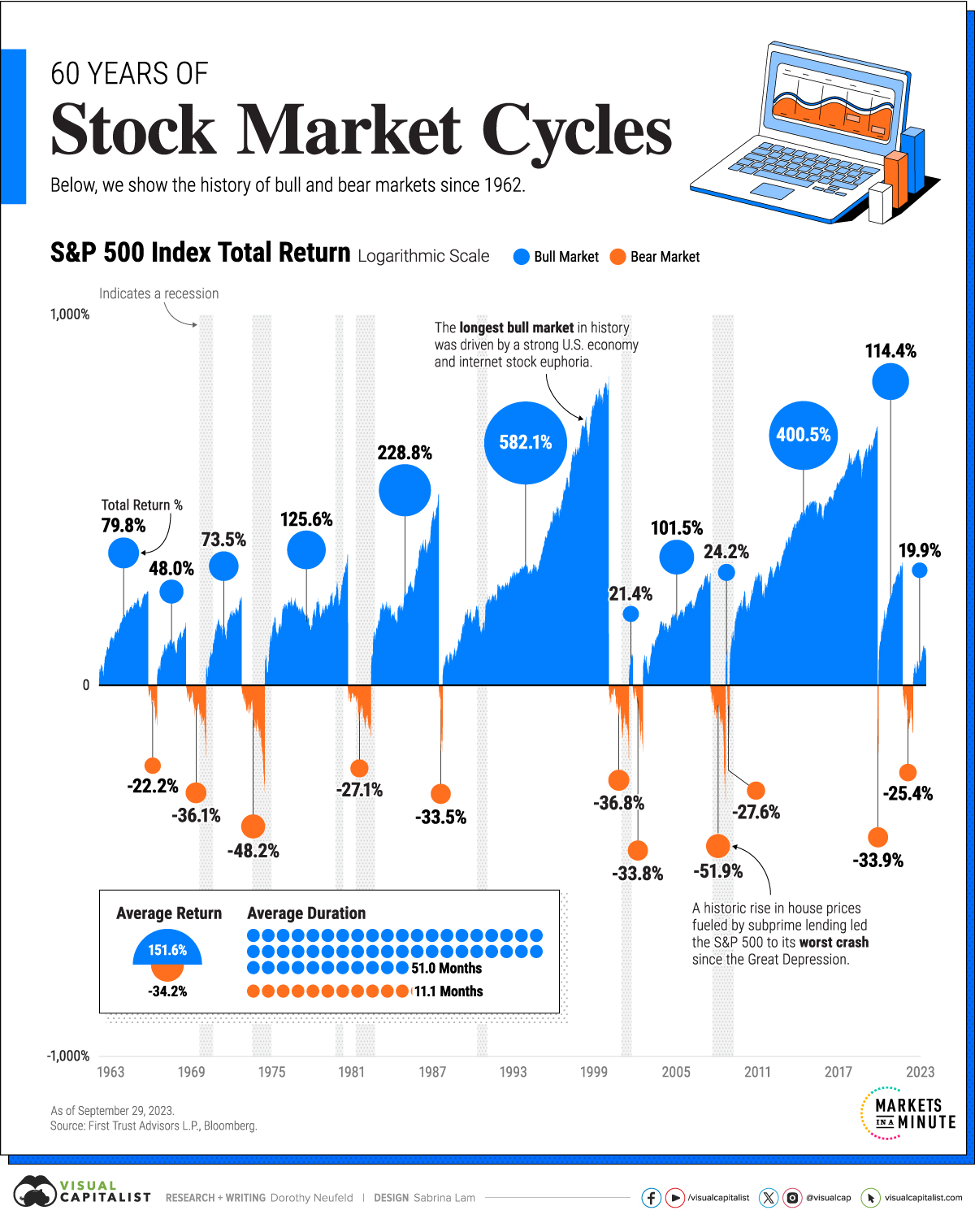
Source: Visual Capitalist
Why So Bullish?
What has investors so jazzed up in recent months? For starters, inflation has been on a steady decline for many months. With China’s stagnating economy, it has helped our inflationary cause by exporting deflationary goods to our country. As you can see from the Personal Consumption Deflator chart below, this broad inflation measure has declined to the Federal Reserve’s 2% target level. Jerome Powell, the Federal Reserve Chairman has been paying attention to these statistics, as evidenced by the central bank’s forecast at the Fed’s recent policy meeting last month on December 13th for three interest rate cuts in 2024. This so-called “Powell Pivot” is a reversal in tone by the Fed, which had been on a relentless rampage of interest rate hikes, over the last two years.
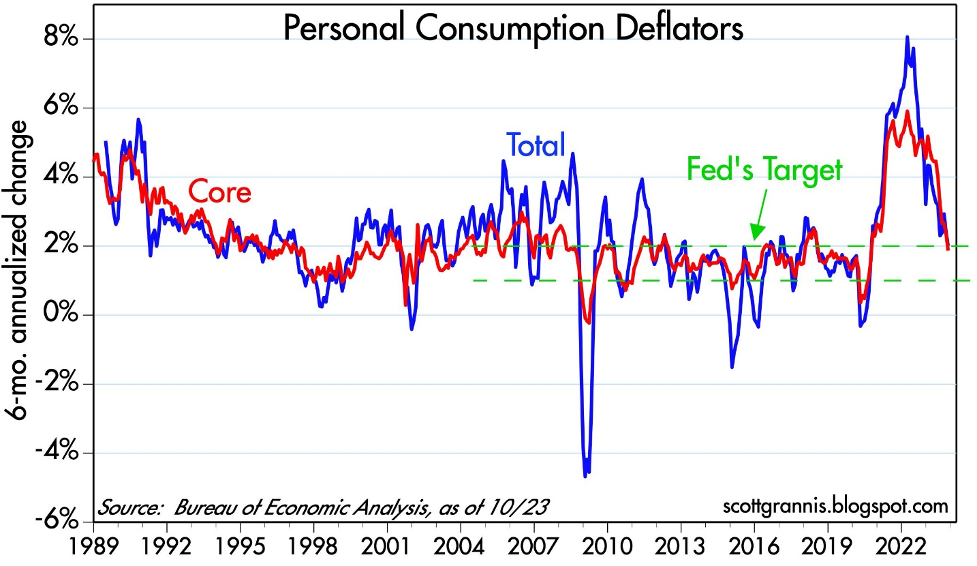
Source: Calafia Beach Pundit
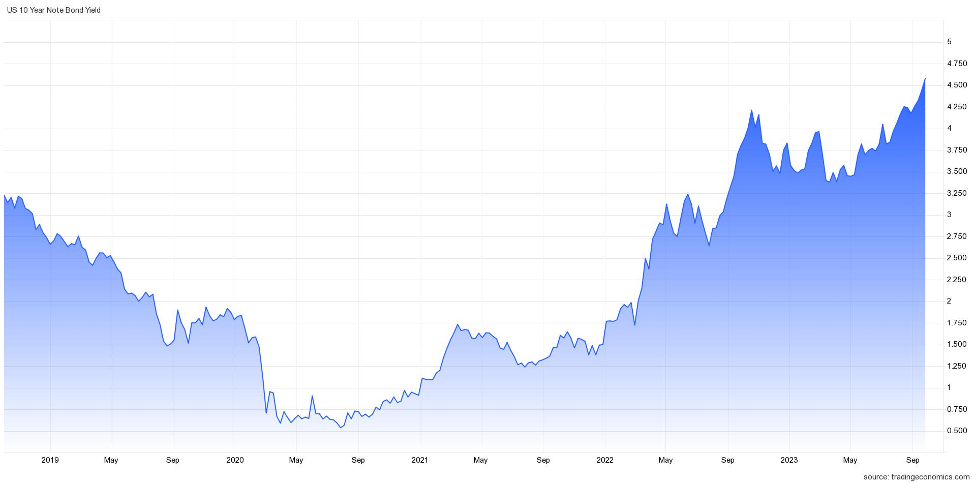
This interest rate cycle headwind has turned into a tailwind as investors now begin to discount the probability of future rate cuts in 2024. The relief of lower interest rates can be felt immediately, whether you consider declining mortgage and car loan rates for consumers, or credit line and corporate loan rates for businesses. This trend can be seen in the benchmark 10-Year Treasury Note yield, which has declined from a peak of 5.0% a few months ago to 3.9% today (see chart below).
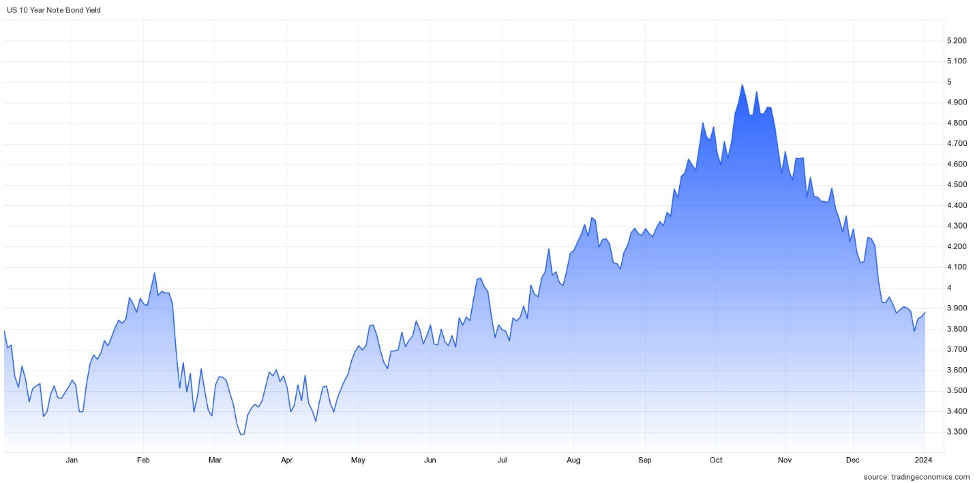
Source: Trading Economics
Declining inflation and interest rates explain a lot of investor optimism, but there are additional reasons to be sanguine. The economy remains strong, unemployment remains low, AI (Artificial Intelligence) applications are improving worker productivity, trillions of potential stock market dollars remain on the sidelines in money market accounts, and corporate profits have resumed rising near all-time record levels (see chart below).
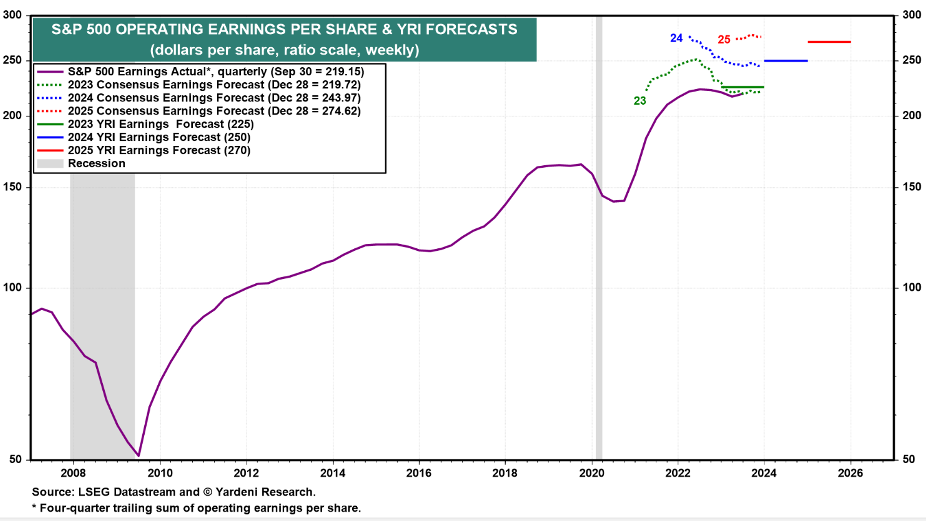
Source: Yardeni.com
What could go wrong? There are always plenty of unforeseen issues that could slow or reverse our economic train. Geopolitical events in Russia or the Middle East are always difficult to predict, and we have a presidential election in 2024, which could always negatively impact sentiment. This new bull market had a great start in 2023, but in historical terms, it is only a baby. Time will tell if 2024 will make this baby cry, but whatever the market faces, declining inflation and interest rates should act as a pacifier.
Wade W. Slome, CFA, CFP®
Plan. Invest. Prosper.
This article is an excerpt from a previously released Sidoxia Capital Management complimentary newsletter (January 2, 2024). Subscribe Here to view all monthly articles.
DISCLOSURE: Sidoxia Capital Management (SCM) and some of its clients hold positions in individual stocks, and certain exchange traded funds (ETFs), but at the time of publishing had no direct position in any other security referenced in this article. No information accessed through the Investing Caffeine (IC) website constitutes investment, financial, legal, tax or other advice nor is to be relied on in making an investment or other decision. Please read disclosure language on IC Contact page.
No Market Roar Due to War

The devastating damage to humanity from the Israeli-Hamas war that is in and around the Gaza strip should not be diminished or understated – innocent lives on both sides suffer in any conflict. However, the economic impact should not be overstated either. In other words, the hundreds of billions of dollars in financial stock market losses this month are not proportional to the Mideast economic losses incurred thus far.
To put the events in perspective, the population of Israel approximates 10 million people and the population located in the Gaza Strip is about two million people. There are more than eight billion people on the planet, so Israel/Gaza represents roughly 1/7 of 1% of the global population.
From an economic standpoint, the combined economic output of Israel/Gaza Strip accounts for around ½ of 1% of global GDP (see chart below – small slivers in the blue section).
And let’s not forget, economic activity is not dropping to zero. From an economic standpoint, the war’s financial impact is even smaller – a rounding error.

Source: Visual Capitalist
However, wars do not exist in a vacuum, and tensions in the Middle East have the potential of having a ripple effect. Whenever rumblings occur in the Mideast, one of the largest global sectors to be first impacted is the oil market. Approximately 20-30% of the world’s oil is trafficked through the Strait of Hormuz in the Persian Gulf, so it was not surprising to see a short-term spike in oil prices to almost $90 per barrel in early October after the Gaza invasion of Israel. By the end of the month, oil has settled back down to about $81 per barrel, almost precisely the same price right before the war started. On a year-over-year basis, oil prices are actually down approximately -5%, thereby providing minor relief to gas-powered car drivers.
If Iran, or Iran-backed militant group Hezbollah, throws their hat into the Israel-Hamas war ring, the U.S. and other Western allies may retaliate and escalate tensions in the region, which would unlikely be received well by the financial markets.
As a result of these domino effect fears in the region, the stock market took another leg down last month with the S&P 500 index declining -2.2%, the Dow Jones Industrial Average -1.4%, and the NASDAQ index fell the most, -2.8%. The world is a dangerous place, but we have seen this movie before – this is nothing new. We would all prefer world peace, but unfortunately, wars and skirmishes have gone on for centuries.
As Interest Rates Soar, Bonds Offer More
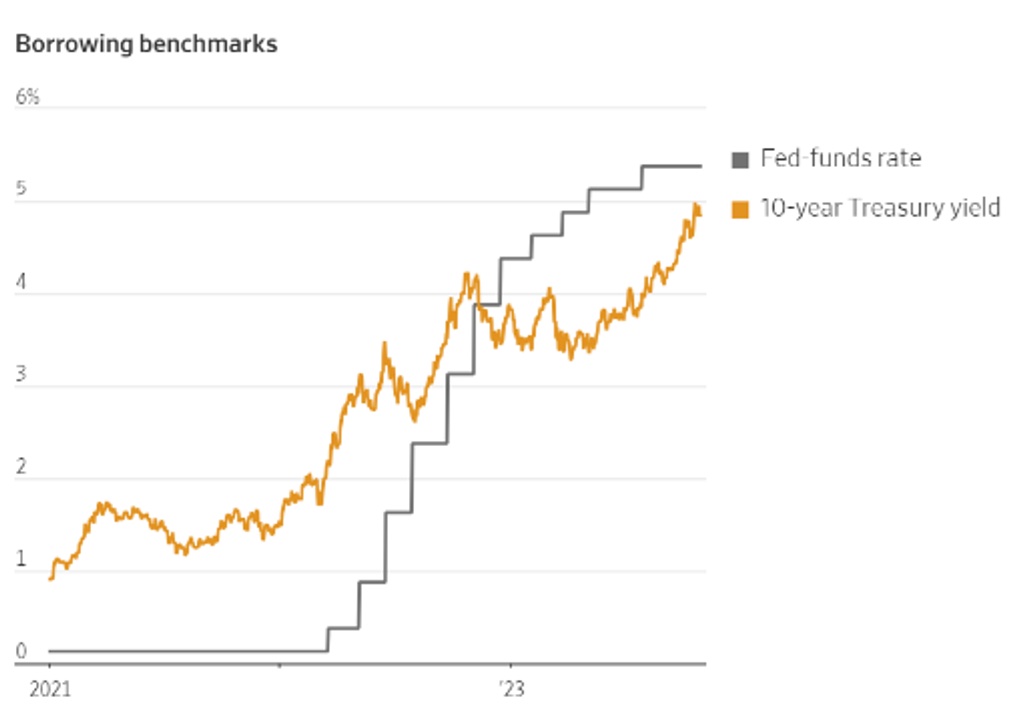
Source: Wall Street Journal
No, TINA is not the name of my high school girlfriend or wife, but rather the acronym TINA (There Is No Alternative) existed in recent years during the Federal Reserve’s zero-interest rate policy days. More specifically, TINA referred to the lack of investment alternatives to equities (i.e., stocks) when money effectively earned 0% in the bank and close-to-0% in many fixed income securities (i.e., bonds). In fact, at one point, although it is still hard to believe, there were more than $16 trillion in bonds paying negative interest rates – pure insanity.
TINA Turns into FIONA
Given the large increase in interest rates by the Federal Reserve over two years (from 0% to 5.50%), investors have been given a short-term gift. As you can see from the chart above, yields on 10-Year Treasury Notes have risen to almost 5.0%. And believe it or not, shorter term bonds are currently providing yields even higher than this. The three-month, six-month, one-year, and two-year Treasuries are all yielding higher rates than 10-Year Treasury yields (i.e., inverted yield curve) – see table below. So, TINA has changed to FIONA – Fixed Income Opens New Alternatives. What’s more, for individuals with taxable accounts, the interest earned on Treasuries is tax-free at the state level, thereby making this short-term gift in yields even more attractive for investors.
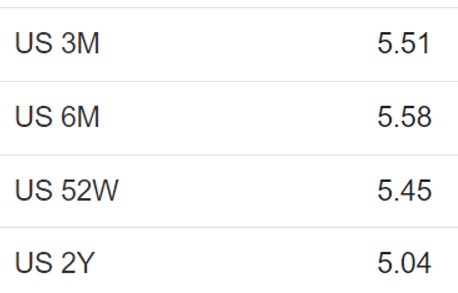
Source: Trading Economics
Stock prices were down again for the month, and investment sentiment has been souring due to the war in the Middle East, but there is still plenty of reasons to remain constructive. Not only is the economy strong (e.g., 3rd quarter GDP of +4.9%), but the consumer also remains strong (see Consumer Wallets Strong) in large part because the unemployment rate remains near record lows (+3.8%). While anxiety rises due to the war, stock prices get cheaper, and opportunities increase. And although interest rates remain elevated, the Federal Reserve is signaling they are closer to a rate hiking end, inflation is cooling and FIONA is offering more attractive yields than during the TINA era. It’s true, this month stocks did not roar due to the war, but patient and opportunistic investors will be rewarded with more.
Wade W. Slome, CFA, CFP®
Plan. Invest. Prosper.
This article is an excerpt from a previously released Sidoxia Capital Management complimentary newsletter (November 1, 2023). Subscribe Here to view all monthly articles.
DISCLOSURE: Sidoxia Capital Management (SCM) and some of its clients hold positions in individual stocks, and certain exchange traded funds (ETFs), but at the time of publishing had no direct position in any other security referenced in this article. No information accessed through the Investing Caffeine (IC) website constitutes investment, financial, legal, tax or other advice nor is to be relied on in making an investment or other decision. Please read disclosure language on IC Contact page.
Consumer Wallets Strong, Rate Hikes Long, What Could Go Wrong?

Consumer wallets and balance sheets remain flush with cash as employment remains near record-high levels. Cash in consumer wallets and money in the bank help the economy keep chugging along at a healthy clip. More specifically, as you can see in the chart below, the net worth of U.S. households has reached a record $154.3 trillion dollars in the most recent month, thanks to appreciation in stocks, gains in real estate, and relatively stable levels of debt.

Source: Calafia Beach Pundit
Unemployment Remains Low
In addition, the unemployment rate is sitting at 3.8%, near multi-decade lows (see chart below).
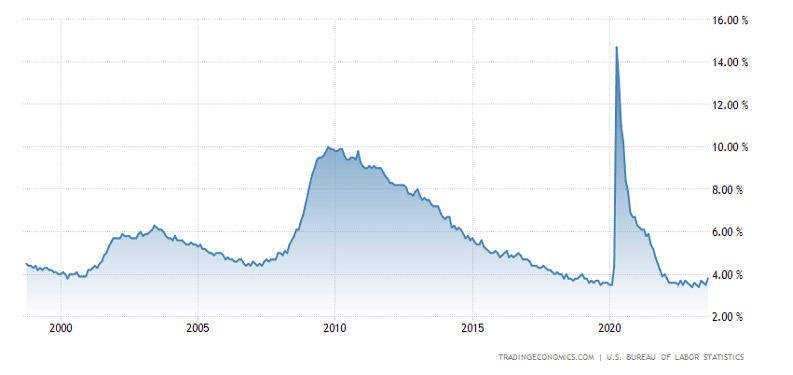
Source: Trading Economics
As long as consumers continue to hold a job, they will continue spending to buoy economic activity – remember, consumer spending accounts for roughly 70% of our country’s economic activity. Case in point are the most recently released GDP (Gross Domestic Product) forecasts by the Atlanta Federal Reserve, which show 3rd quarter GDP growth estimated at a 4.9% rate (see chart below).

Rates Up, Housing Prices Up?
Yes, it’s true, despite a dramatic surge in mortgage rates over the last few years, the housing market remains strong due to a very tight supply of homes available for sale. Most homeowners with a mortgage have refinanced to a rate in the range of 3% (or in some cases even lower), so selling and moving into a new home with a mortgage at current rates of 7.3% is not that appealing. In other words, if you decide to move, your monthly mortgage payment could potentially go up by more > 50%, which could equate to thousands of dollars per month. Under this scenario, you are likely to stay put and not sell your home.
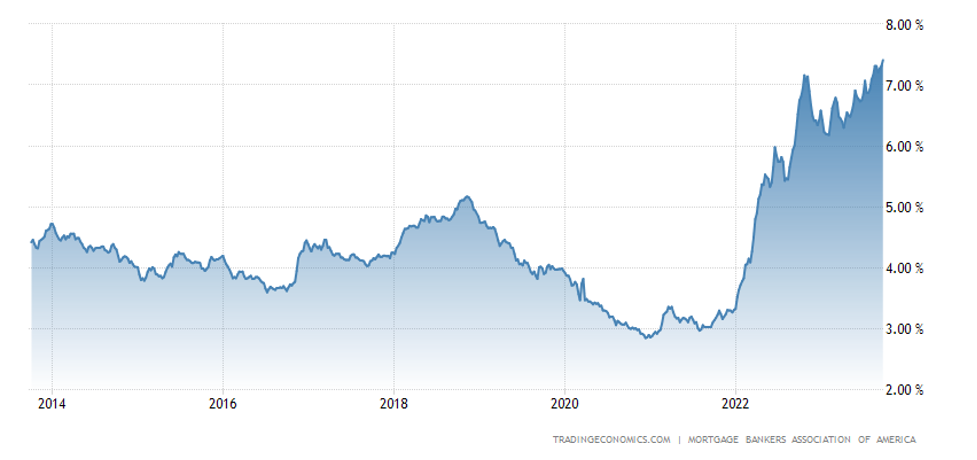
Source: Trading Economics
The embedded economic disincentive of selling a home with a mortgage has really put a real crimp on the supply of homes available for sale (chart below). As you can see, the inventory of homes has dramatically collapsed from a peak of about four million homes, circa the 2008 Financial Crisis, to around one million homes today.
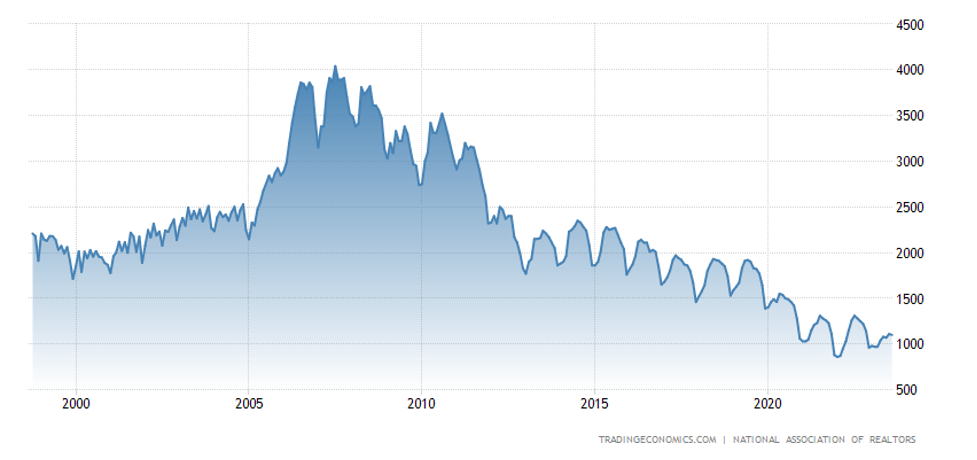
Source: Trading Economics
In the face of this mixed data, the stock market finished a hot summer with a cool whimper last month, in large part due to a 0.49% increase in the 10-Year Treasury Note yield to 4.58% (see chart below). The S&P 500 index fell -4.9% for the month, the technology-heavy NASDAQ index dropped even further by -5.8%, while the Dow Jones Industrial Average outperformed, down -3.5% for the month. Worth noting, however, the Dow has significantly underperformed the other indexes so far this year.
Source: Trading Economics
Inflation on the Mend
The Fed continues to talk tough about fighting inflation after taking interest rates from 0% to 5.5% over the last two years, nevertheless inflation continues to come down. The Fed’s go-to Core PCE inflation datapoint that came out last Friday at +0.1% is consistent with the downward inflation trend we have been witnessing for many months now (see chart below). As you can see, inflation on annualized basis has reached 2.2%, nearly achieving the Federal Reserve’s target of 2.0%.
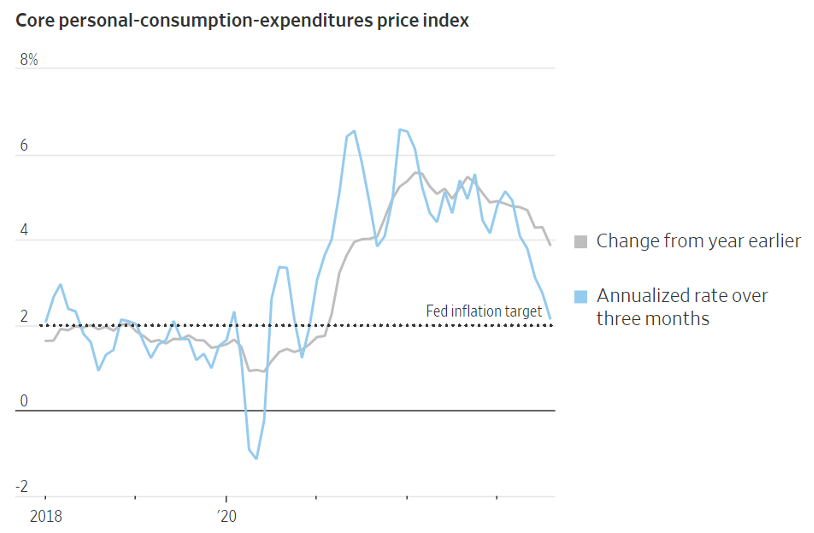
Source: The Wall Street Journal and Commerce Department
There is never a shortage of investor concerns. Today, worries include Federal Reserve policy; restarting of school loan repayments (after a three-year hiatus); a potential government shutdown; an auto and Hollywood strike; higher oil prices; and a presidential election that is heating up. Many of these worries are nothing new. The bull market took a pause for the month, but consumer wallets remain fat, the economy keeps chugging, the employment picture remains strong, and stock prices remain up +12% for the year (S&P 500). For the time being, betting on a soft economic landing over an imminent recession could be a winning use for that cash in your wallet.
Wade W. Slome, CFA, CFP®
Plan. Invest. Prosper.
This article is an excerpt from a previously released Sidoxia Capital Management complimentary newsletter (October 2, 2023). Subscribe Here to view all monthly articles.
DISCLOSURE: Sidoxia Capital Management (SCM) and some of its clients hold positions in individual stocks, and certain exchange traded funds (ETFs), but at the time of publishing had no direct position in any other security referenced in this article. No information accessed through the Investing Caffeine (IC) website constitutes investment, financial, legal, tax or other advice nor is to be relied on in making an investment or other decision. Please read disclosure language on IC Contact page.
March Madness Leads to Gladness

As usual, there was plenty of “madness” in March, and this year did not disappoint. Just as is the case with the annual NCAA basketball tournament, certain investors suffered the agony of defeat in the financial markets, but overall, the thrill of victory triumphed in March. So much so that the S&P 500 index posted its largest first-quarter gain in more than 20 years. Not only did the major indexes post gains for the month, but the winning record looks even better for the year-to-date results. For 2019, the S&P 500 index is up +13.1%; the Dow Jones Industrial Average +11.2%; and the tech-heavy NASDAQ index +16.5% for the year. The monthly gains in the major indexes were more muted, ranging from 0% for the Dow to +2.6% for the NASDAQ.
Busy? Listen to Wade discuss this article and other topics each week on the Weekly Grind podcast:
While 2018 ended with a painful injury (S&P 500 -6.2% in Q4), on fears of a deteriorating China trade deal and a potentially overly aggressive Federal Reserve hiking interest rates, the stock market ultimately recovered in 2019 on changing perceptions. Jerome Powell, the Federal Reserve Chairman, indicated the Fed would be more “patient” going forward in increasing interest rates, and President Trump’s tweet-storm on balance has been optimistic regarding the chances of hammering out a successful trade deal with China.
With the new cautious Fed perspective on interest rates, the yield on the 10-Year Treasury Note fell by -0.28% for the quarter from 2.69% to 2.41%. In fact, investors are currently betting there is a greater than 50% probability the Fed will cut interest rates before year-end. Moreover, in testimony before Congress, Powell signaled the economic dampening policy of reducing the Fed’s balance sheet was almost complete. All else equal, the shift from a perceived rate-hiking Fed to a potentially rate-cutting Fed has effectively turned an apparent headwind into tailwind. Consumers are benefiting from this trend in the housing market, as evidenced by lower 30-year fixed mortgage rates, which in some cases have dropped below 4%.
Economy: No Slam Dunk
However, not everything is a slam dunk in the financial markets. Much of the change in stance by the Fed can be attributed to slowing economic growth seen both here domestically and abroad, internationally.
Here in the U.S., the widely followed monthly jobs number last month only showed a gain of 20,000 jobs, well below estimates of 180,000 jobs. This negative jobs surprise was the biggest miss in more than 10 years. Furthermore, the overall measure for our nation’s economic activity, growth in Gross Domestic Product (GDP), was revised downward to +2.2% in Q4, below a previous estimate of +2.6%. The so-called “inverted yield curve” (i.e., short-term interest rates are higher than long-term interest rates), historically a precursor to a recession, is consistent with slowing growth expectations. This inversion temporarily caused investors some heartburn last month.
If you combine slowing domestic economic growth figures with decelerating manufacturing growth in Europe and China (e.g. contracting Purchasing Managers’ Index), then suddenly you end up with a slowing global growth picture. In recent months, the U.S. economy’s strength was perceived as decoupling from the rest of the world, however recent data could be changing that view.
Fortunately, the ECB (European Central Bank) and China have not been sitting on their hands. ECB President Mario Draghi announced three measures last month that could cumulatively add up to some modest economic stimulus. First, it “expects the key ECB interest rates to remain at their present levels at least through the end of 2019.” Second, it committed to reinvesting all maturing bond principal payments in new debt “for an extended period of time.” And third, the ECB announced a new batch of “Targeted Long-Term Refinancing Operations” starting in September. Also, Chinese Premier Li Keqiang announced the government will reduce taxes, primarily Value Added Taxes (VAT) and social security taxes (SST). Based on the rally in equities, it appears investors are optimistic these stimulus efforts will eventually succeed in reigniting growth.
Volume of Political Noise Ratcheted Higher
While I continually try to remind investors to ignore politics when it comes to their investment portfolios, the deafening noise was especially difficult to overlook considering the following:
- Mueller Report Completed: Robert Mueller’s Special Counsel investigation into potential collusion as it relates Russian election interference and alleged obstruction of justice concluded.
- Michael Cohen Testifies: Former President Trump lawyer, Michael Cohen, testified in closed sessions before the House and Senate intelligence committees, and in public to the House Oversight Committee. In the open session, Cohen, admitted to paying hush money to two women during the election. Cohen called President Trump a racist, a conman, and a cheat but Cohen is the one heading to jail after being sentenced for lying to Congress among other charges.
- Manafort Sentenced: Former Trump Campaign Chairman Paul Manafort was sentenced to prison on bank and tax fraud charges.
- North Korea No Nuke Deal: In geopolitics,President Trump flew 21 hours to Vietnam to meet for a second time with North Korean leader Kim Jong Un on denuclearization of the Korean peninsula. The U.S. president ended up leaving early, empty handed, without signing an agreement, after talks broke down over sanction differences.
- Brexit Drama Continues: The House of Commons in the lower house of the U.K. Parliament continued to stifle Prime Minister Theresa May’s plan to exit the European Union with repeated votes rejecting her proposals. Brexit outcomes remain in flux, however the European Union did approve an extension to May 22 to work out kinks, if the House can approve May’s plan.
Positive Signals Remain
March Madness reminds us that a big lead can be lost quickly, however a few good adjustments can also swiftly shift momentum in the positive direction. Although growth appears to be slowing both here and internationally, corporate profits are not falling off a cliff, and earnings remain near record highs (see chart below).
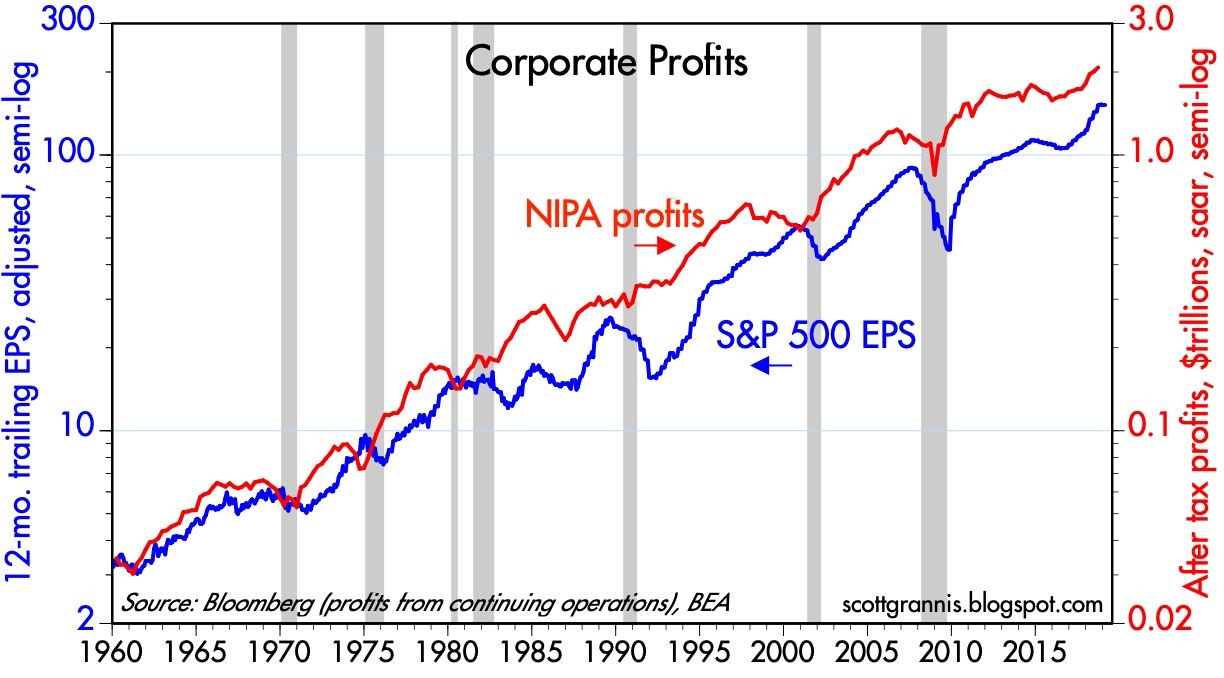
Source: Calafia Beach Pundit
Similar to the stock market, commodities can be a good general barometer of current and future economic activity. As you can see from the chart below, not only have commodity prices remained stable in the face of slowing economic data, but gold prices have not spiked as they did during the last financial crisis.
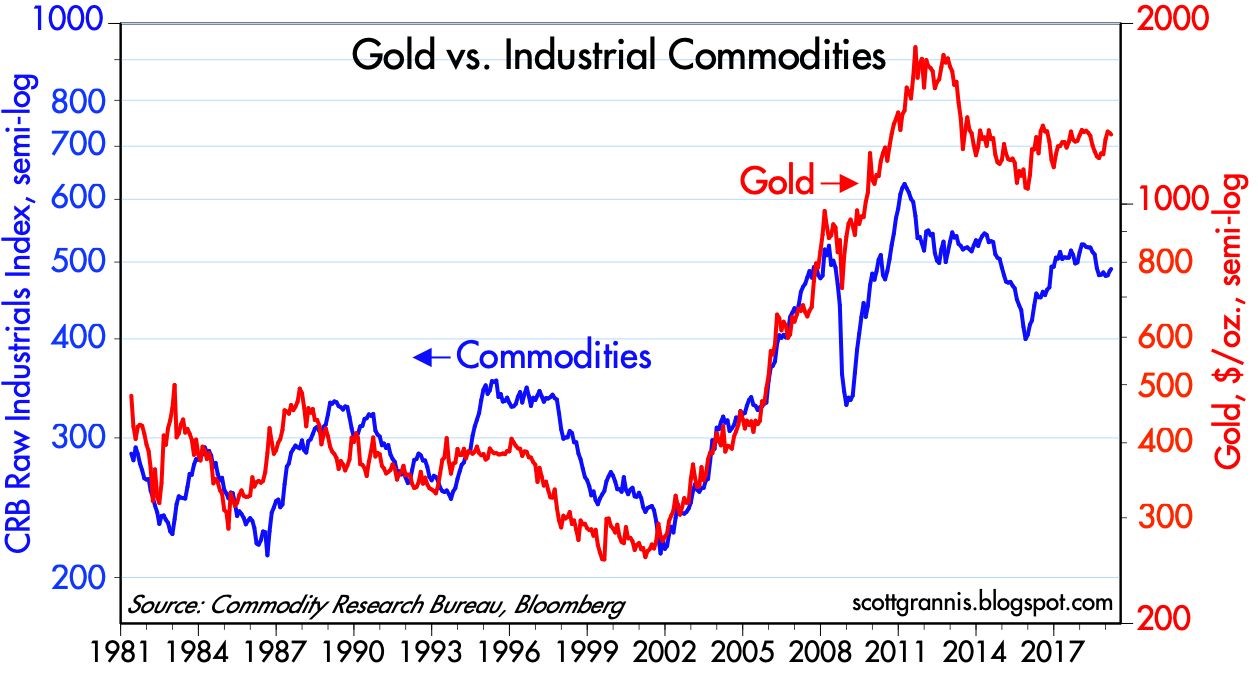
Source: Calafia Beach Pundit
After 2018 brought record growth in corporate profits and negative returns, 2019 is producing a reverse mirror image – slow profit growth and record returns. The volatile ending to 2018 and triumphant beginning to 2019 is a reminder that “March Madness” does not need to bring sadness…it can bring gladness.

Wade W. Slome, CFA, CFP®
Plan. Invest. Prosper.
This article is an excerpt from a previously released Sidoxia Capital Management complimentary newsletter (April 1, 2019). Subscribe on the right side of the page for the complete text.
DISCLOSURE: Sidoxia Capital Management (SCM) and some of its clients hold positions and certain exchange traded funds (ETFs), but at the time of publishing had no direct position in any other security referenced in this article. No information accessed through the Investing Caffeine (IC) website constitutes investment, financial, legal, tax or other advice nor is to be relied on in making an investment or other decision. Please read disclosure language on IC Contact page.
PIMCO and Stocks: The Slow Motion Train Wreck

I believe it was Bill Clinton who said, “If you don’t toot your horn, it usually stays untooted.” Good advice, but keeping his horn concealed may have helped his political and personal career in a few instances too.
In sticking with the horn metaphor, I will toot my own horn as it relates to my skepticism about bond behemoth PIMCO’s long failed attempt to enter the equity fund market. Since 2009, watching PIMCO’s efforts of gaining credibility in stock investing has been like observing a slow motion train wreck.
Although, PIMCO may continue its flailing struggles in its so-called equity offerings, the proverbial nail in the coffin was announced last week when PIMCO’s chief investment officer of global equities, Virginie Maisonneuve, left the bond giant after only a year. This departure adds to the list of high profile departures, including Bill Gross, Mohamed El-Erian, Paul McCulley, Neel Kashkari, and others.
The Wall Street Journal states PIMCO only has $3 billion (0.2%) of the firms $1.6 trillion of assets remaining in actively traded stock funds. PIMCO claims to have more assets in equity funds managed by Research Affiliates but good luck finding any stocks in these portfolios – for example, Morningstar lists 0 Stock Holdings and 698 Bond Holdings in its PIMCO RAE Fundamental Plus EMG Stock Fund. And please explain to me how this is a stock fund?
Regardless, any way you look at it PIMCO continues to flounder in its stock fund efforts. If you would like to read more about my victory lap, please reference my previous February 2013 PIMCO article, Beware: El-Erian & Gross Selling Buicks…Not Chevys.
Here is a partial excerpt:
PIMCO Smoke & Mirrors: Stock Funds with NO Stocks
Just when I thought I had seen it all, I came across PIMCO’s Equity-Related funds. Never in my career have I seen “equity” mutual funds that invest solely in “bonds.” Well, apparently PIMCO has somehow creatively figured out how to create stock funds without investing in stocks. I guess that is one strategy for a bond-centric company of getting into the equity fund market? This is either ingenious or bordering on the line of criminal. I fall into the latter camp. How the SEC allows the world’s largest bond company to deceivingly market billions in bond-filled stock funds to individual investors is beyond me. After innocent people got fleeced by unscrupulous mortgage brokers and greedy lenders, in this Dodd-Frank day and age, I can’t help but wonder how PIMCO is able to solicit a StockPlus Fund that has 0% invested in common stocks. You can judge for yourself by reviewing their equity-related funds on their website (see also chart below):
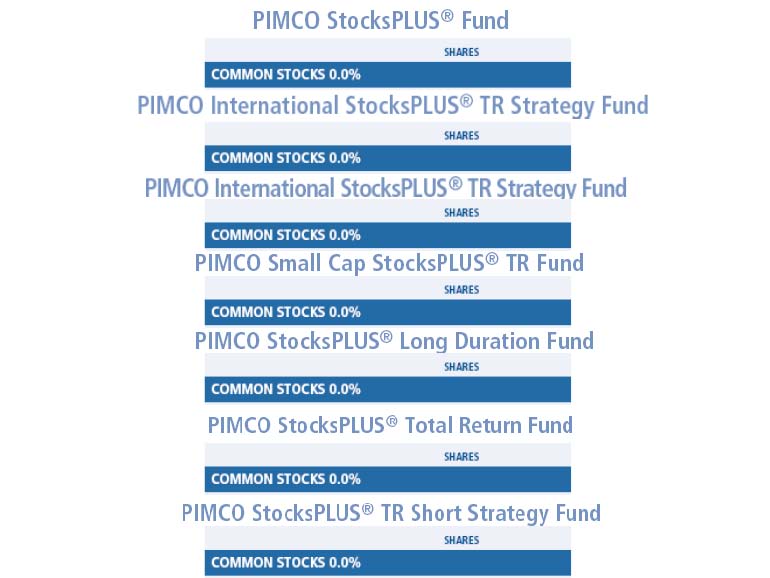
PIMCO Equity-Related Funds with No Equity
PIMCO Active Equity Funds Struggle
With more than 99% of PIMCO’s $2 trillion in assets under management locked into bonds, company executives have made a half-hearted effort of getting into the equity markets, even though they’ve enjoyed high-fiving each other during the three-decade-long bond bull market (see Downhill Marathon Machine). In hopes of diversifying their bond-heavy revenue stream, in 2009 they hired the head of the high-profile $700 billion, government TARP program (Neil Kashkari). Subsequently, PIMCO opened its first set of actively managed funds in 2010. Regrettably for PIMCO, the sledding has been quite tough. In 2012, all six actively managed equity funds lagged their benchmarks. Moreover, just a few weeks ago, Kashkari their rock star hire decided to quit and pursue a return to politics.
Mohamed El-Erian and Bill Gross have never been camera shy or bashful about bashing stocks. PIMCO has virtually all their bond eggs in one basket and their leaderless equity division is struggling. What’s more, like some car salesmen, they have had a creative way of describing the facts. If it’s a Chevy or unbiased advice you’re looking for, I recommend you steer clear from Buick salesmen and PIMCO headquarters.

Wade W. Slome, CFA, CFP®
Plan. Invest. Prosper.
DISCLOSURE: Sidoxia Capital Management (SCM) and some of its clients hold positions in certain exchange traded funds (ETFs), but at the time of publishing, SCM had no direct position in PEFAX or any other PIMCO security referenced in this article. No information accessed through the Investing Caffeine (IC) website constitutes investment, financial, legal, tax or other advice nor is to be relied on in making an investment or other decision. Please read disclosure language on IC Contact page.
Vice Tightens for Those Who Missed the Pre-Party

The stock market pre-party has come to an end. Yes, this is the part of the bash in which an exclusive group is invited to enjoy the fruits of the festivities before the mobs arrive. That’s right, unabated access to the nachos; no lines to the bathroom; and direct access to the keg. For those of us who were invited to the stock market pre-party (or crashed it on their own volition), the spoils have been quite enjoyable – about a +128% rebound for the S&P 500 index from the bottom of 2009, and a +147% increase in the NASDAQ Composite index over the same period (excluding dividends paid on both indexes).
Although readers of Investing Caffeine have received a personal invitation to the stock market pre-party since I launched my blog in early 2009, many have shied away, out of fear the financial market cops may come and break-up the party.
Rather than partake in stock celebration over the last four years, many have chosen to go down the street to the bond market party. Unlike the stock market party, the fixed-income fiesta has been a “major-rager” for more than three decades. However, there are a few signs that this party has gotten out-of-control. For example, crowds of investors are lined up waiting to squeeze their way into some bond indulgence; after endless noise, neighbors are complaining and the cops are on their way to shut the party down; and PIMCO’s Bill Gross has just jumped off the roof to do a cannon-ball into the pool.
Even though the stock-market pre-party has been a blast, stock prices are still relatively cheap based on historical valuation measurements, meaning there is still plenty of time for the party to roll on. How do we know the party has just started? After five years and about a half a trillion dollars hemorrhaging out of domestic funds (see Calafia Beach Pundit), there are encouraging signs that a significant number of party-goers are beginning to arrive to the party. More specifically, as it relates to stocks, a fresh $10 billion has flowed into domestic equity mutual funds during this January (see ICI chart below). This data is notoriously volatile, and can change dramatically from month-to-month, but if this month’s activity is any indication of a changing mood, then you better hurry to the stock party before the bouncer stops letting people in.
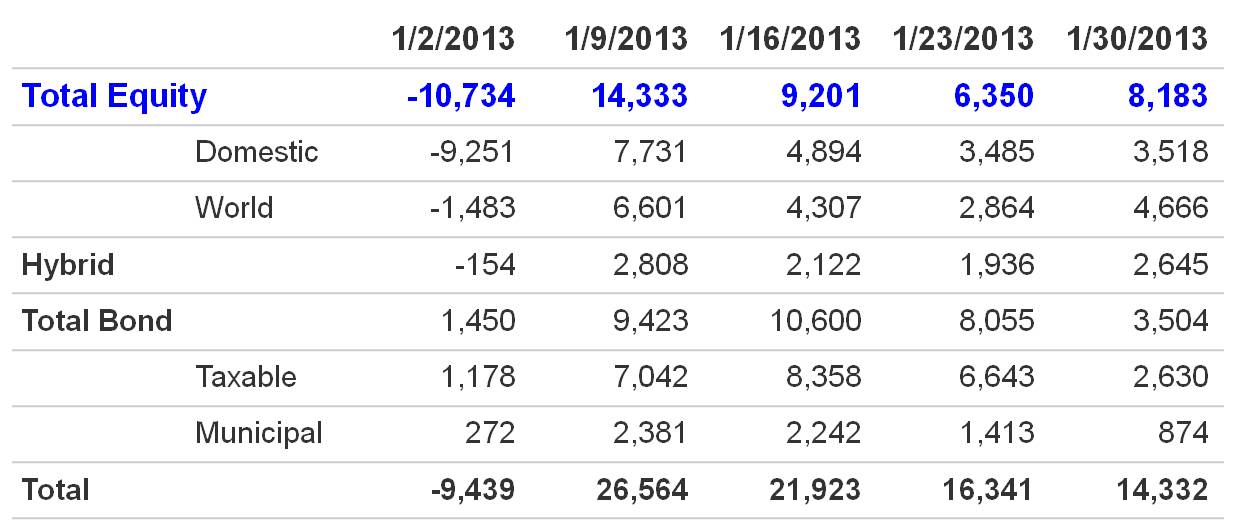
Source: Investment Company Institute (ICI)
Vice Begins to Tighten on Party Outsiders

Many stock market outsiders have either been squeezed into the bond market, hidden in cash, or hunkered down in a bunker with piles of gold. While some of these asset classes have done okay since early 2009, all have underperformed stocks, but none have performed worse than cash. For those doubters sitting on the equity market sidelines, the pain of the vice squeezing their portfolios has only intensified, especially as the economy and employment picture slowly improves (see chart below) and stock prices persist directionally upward. For years, fear-mongering stock skeptics have warned of an imploding dollar, exploding inflation, a run-away deficit/debt, a reckless money-printing Federal Reserve, and political gridlock. Nevertheless, none of these issues have been able to kill this equity bull market.
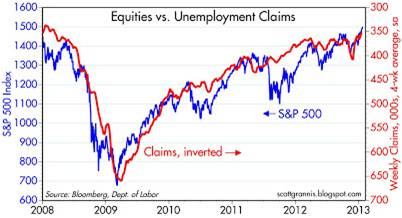
Source: Calafia Beach Pundit
But for those willing and able investors to enter the stock party today, one must realize this party will only get riskier over time. As we exit the pre-party and enter into the main event, you never know who may join the party, including some uninvited guests who may steal money, get sick on the carpet, participate in illegal activities, and/or ruin the fun by clashing with guests. We have already been forced to deal with some of these uninvited guests in recent years, including the “flash crash,” debt ceiling debate, European financial crisis, fiscal cliff, and lastly, sequestration is about to arrive as well (right after parking his car).
New investors can still objectively join the current equity party, but it is necessary to still be cognizant of not over-staying your welcome. However, for those party-pooping doubters who already missed the pre-party, the vice will continue to tighten, leaving stock cynics paralyzed as they watch additional missed opportunities enjoyed by the rest of us.
Wade W. Slome, CFA, CFP®
Plan. Invest. Prosper.
DISCLOSURE: Sidoxia Capital Management (SCM) and some of its clients hold positions in certain exchange traded funds (ETFs), but at the time of publishing SCM had no direct position in HLF, Japanese ETFs, or any other security referenced in this article. No information accessed through the Investing Caffeine (IC) website constitutes investment, financial, legal, tax or other advice nor is to be relied on in making an investment or other decision. Please read disclosure language on IC Contact page.
Performance Beauty in Eye of Beholder

The average person may be a good judge in picking the winner of a beauty contest, but unfortunately your average investor is ill-equipped to sift through the thousands of mutual funds and hedge funds and thoughtfully discern the relevant performance metrics for investment purposes.
Investment firms however, are well-equipped with smoke, mirrors, and a tool-chest filled with numerous tricks. Here are a few of the investment firms’ gimmicks:
- Cherry Picking: Fund firms are notorious with cutting out the bad performance numbers and cherry picking the good periods. As investment guru Charles Ellis reminds us, the wow factor results of “investment performance become quite ordinary by simply adding or subtracting one or two years at the start or the end of the period shown. Investors should always get the whole record – not just selected excerpts.”
- Limited Time Period: Often the period highlighted by investment firms is insufficient to make a proper conclusion regarding a manager’s outperformance capabilities. Ellis acknowledges that gathering enough yearly performance information can be practically challenging:
“By the time you had gathered enough data to determine whether your fund manager really was skillful or just lucky, at least one of you would probably have died of old age.”
- Fee Disclosure: Some managers’ performance figures look stupendous until one realizes once hefty fees are subtracted from the reported figures, what previously looked top-notch is now average or below-average. It is important to read the small print or ask tough questions of the broker peddling a fund.
- Audited Figures: Legitimacy of performance is key, and there are different levels of audited figures. Global Investment Performance Standards (GIPS) compliance is an industry accepted standard. For pooled investment vehicles, audited results from regional or national accounting firms can be important too.
- Misused Rating Systems: Morningstar is the 800 pound gorilla in the mutual fund world and provides some useful data. Unfortunately, most Morningstar investors use the data incorrectly. A 2000 study by the Journal of Financial and Quantitative Analysis discovered, “There is little statistical evidence that Morningstar’s highest-rated funds outperform the medium-rated funds.” On this subject, Charles Ellis points out the following:
“While Morningstar candidly admits that its star ratings have little or no predictive power, 100 percent of net new investment money going into mutual funds goes to funds that were recently awarded five stars and four stars…Indeed, in the months after the ratings are handed out each year, the five-star funds generally earn less than half as much as the broad market index!…Morningstar ratings are misleading investors into buying high and selling low.”
Investors need to be careful in how they use the ratings – simply buying 4-5 star funds and selling star-losing funds can be a heartburning recipe for bad results. Buying high and selling low usually doesn’t turn out very well.
Find Winners…Then What?
Even if you are successful in identifying the winning funds, those same funds tend to underperform in subsequent periods. Ellis, a believer in passive index investing, noticed only 10% of active managers outperformed over 25 years, and the odds of sustaining outperformance in subsequent periods diminished even further.
Charles Ellis also noticed a fat-tail syndrome of losers versus winners. For example, Ellis found 2% of active managers outperformed over a set time period, but a whopping 16% underperformed the market over a similar timeframe. Consistent with these findings, Ellis stresses that past performance does not predict future results, with one exception: “The worst losers do tend to keep losing. If you do decide to select active investment managers, promise yourself you will stay with your chosen manager for many years…changing managers is not only expensive, but it usually doesn’t work.”
Professionals to the Rescue
Well, if individuals are not in a position to pick future winning fund managers, then thank heavens the professional consultants can help out…not exactly. Ellis was blunt about the capabilities of those professionals selecting active investment managers:
“Pension executives and investment consultants who specialize in selecting the best managers have, as a group, been unsuccessful at selecting managers who can beat the market.”
Ellis uses a respected firm as an example to prove his point:
“Cambridge Associates reports candidly, ‘There is no sound basis for hiring or firing managers solely on the basis of recent performance.’”
At the end of the day, finding current winners is not a problem, but sifting through the massive quantity of funds and selecting future winners is very challenging for individuals and professionals alike. The financial industry would like you to believe picking the future performance beauty winner is a simple task – the data seems to indicate otherwise. Rather than wasting your money attempting to pick the beauty winner, perhaps your money would be better spent on purchasing a tiara for yourself.
Wade W. Slome, CFA, CFP®
Plan. Invest. Prosper.
DISCLOSURE: Sidoxia Capital Management (SCM) and some of its clients own certain exchange traded funds, but at the time of publishing SCM had no direct position in MORN, Cambridge Associates, or any other security referenced in this article. No information accessed through the Investing Caffeine (IC) website constitutes investment, financial, legal, tax or other advice nor is to be relied on in making an investment or other decision. Please read disclosure language on IC “Contact” page.


