Posts filed under ‘Financial Markets’
Opening the Broker Departure Floodgates

Even though the equity markets have rebounded massively, investors remain in a sour mood in light of sluggish domestic economic headlines. Technology, for example High Frequency Trading (HFT – read more), along with the harsh realities of financial regulatory reform is creating profit growth challenges for the global financial gargantuans. More specifically, the floodgates have sprung open with respect to broker departures from the big four brokerage firms.
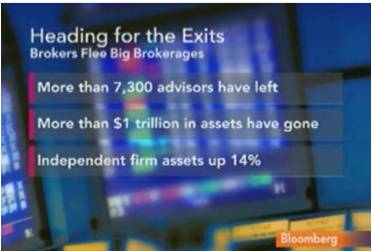
According to Bloomberg, more than 7,300 brokers have left the four largest full-service brokerage firms (Merrill Lynch [BAC], Morgan Stanley Smith Barney [MS], UBS Wealth Management [UBS], and Wells Fargo Advisors [WFC]) since the beginning of 2009. But the brokers have not floated away quietly – more than $1 trillion in assets have fled these major brokerage firms and followed the brokers to their new employers.
Several factors have led to the deluge of departures of bodies and bucks:
1) Mergers: The financial crisis triggered an all-out economic assault on the brokerage firm industry. A subsequent game of musical chairs resulted in the marriage of disparate cultures (e.g., B of A-Merrill; Morgan Stanley-Smith Barney; Wells Fargo-Wachovia). Not only did the clashing cultures rub brokers the wrong way, but the surviving executives were left with redundant and unproductive brokers to cut.
2) Heightened Recruiting: With a shrinking pie and less growth comes more fierce competition. The discount brokerage firms have realized the Darwinian challenges and reacted to them accordingly. Take TD Ameritrade (AMTD) for example. In the first seven months of 2010, the discount brokerage firm added 212 independent advisers to its network, a +44% increase over the previous year. Charles Schwab Corp. (SCHW) with its network of 6,000 independent advisers is also ratcheting up its efforts to poach brokers away from the large brokerage firms.
3) Economics: Would you like 40-50% of profits generated from new clients, or 80-100%? In many instances, the broker from the large branded institution funnels the majority of the commissions to the mother-ship. Sure, the broker receives back-office, marketing, and branding support, but some brokers are now asking themselves is the brand an asset or liability? Wall Street has gotten a large black eye and it will take time to heal their corporate images…if they ever manage to succeed at all.
4) Customer Choice: Lastly, and most importantly, customers are voting with their dollars. As I have indicated in the past, I strongly believe the current system is structurally flawed (see Financial Sharks article). Financial institutions craft incentives designed to line the pockets of brokers (salespeople) and prioritize corporate profits over client wealth creation and preservation. The existing failed industry structure is based upon smoke, mirrors, opacity, and small print. Many independent, fee-only advisors are structuring financial relationships that align with portfolio performance and make transparency a top priority. Customers appreciate these benefits and are shifting dollars away from the brokerage firms.
LPL Loving IPO Life
If you are having a difficult time processing the magnitude of this investment advice shift, then consider the $4.4 billion estimated value being placed on the planned IPO (Initial Public Offering) of LPL Financial, the independent brokerage firm of 12,000+ financial advisors. LPL serves as a conduit for legacy brokers to become independent, and still allow them to benefit from an array of ala carte support services. Growth has been strong too – over the last decade the advisor count at LPL has more than tripled and assets under their umbrella now exceed $250 billion.
The Wall Street broker floodgates have opened, so unless regulatory changes are enacted, the old flawed way of doing things will require a life support raft. If not, independent, fee-only advisors like Sidoxia Capital Management will benefit from the current sinking migration of brokers.
Wade W. Slome, CFA, CFP®
Plan. Invest. Prosper.
DISCLOSURE: Sidoxia Capital Management (SCM) and some of its clients own certain exchange traded funds, but at the time of publishing SCM had no direct position in BAC, MS, UBS, WFC, AMTD, SCHW, LPL Financial or any other security referenced in this article. No information accessed through the Investing Caffeine (IC) website constitutes investment, financial, legal, tax or other advice nor is to be relied on in making an investment or other decision. Please read disclosure language on IC “Contact” page.
P/E Binoculars, Not Foggy Rearview Mirror

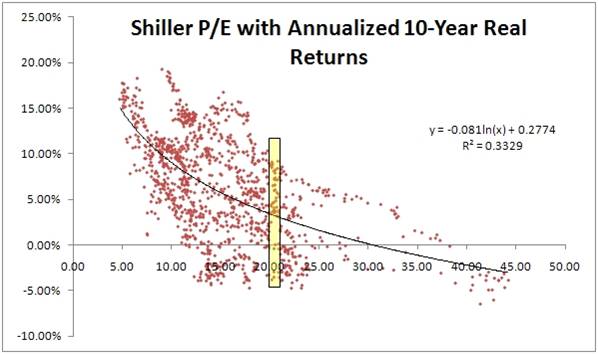
Robert Shiller is best known for his correctly bearish forecasts on the housing market, which we are continually reminded of through the ubiquitous Case-Shiller housing index, and his aptly timed 2000 book entitled Irrational Exuberance. Shiller is also well known for his cyclically adjusted 10-year price-earnings tool, also known as P/E-10. This tool chooses to take a rearview mirror look at the 10-year rolling average of the S&P composite stock index to determine whether the equity market is currently a good or bad buy. Below average multiples are considered to be predictive of higher future returns, and higher than average multiples are considered to produce lower future returns (see scatterplot chart).
Source: http://www.mebanefaber.com (June 2010)
Foggy Mirror
If you were purchasing a home, would the price 10 years ago be a major factor in your purchase decision? Probably not. Call me crazy, but I would be more interested in today’s price and even more interested in the price of the home 10 years into the future. The financial markets factor in forward looking data (not backward looking data). Conventional valuation techniques applied to various assets, take for example a bond, involve the discounting of future cash flow values back to the present – in order to determine the relative attractiveness of today’s asset price. The previous 10-years of data are irrelevant in this calculation.
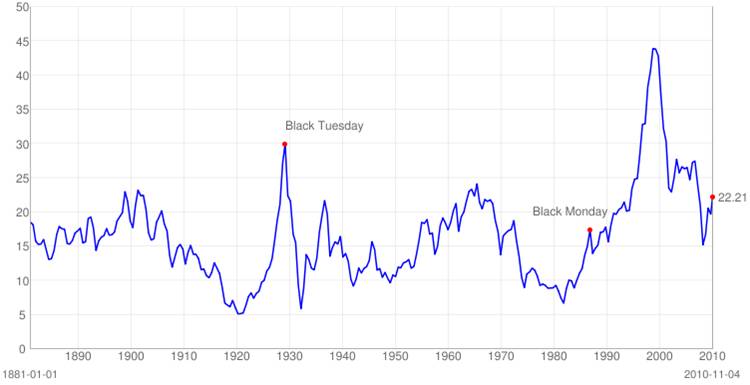
Although I believe current and future expectations are much more important than stale historical data, I can appreciate the insights that can be drawn by comparing current information with historical averages. In other words, if I was purchasing a house, I would be interested in comparing today’s price to the historical 10-year average price. Currently, the P/E-10 ratio stands at a level around 22x – 38% more expensive than the 16x average value for the previous decade. That same 22x current P/E-10 ratio compares to a current forward P/E ratio of 13x. A big problem is the 22x P/E-10 is not adequately taking into account the dramatic growth in earnings that is taking place (estimated 2010 operating earnings are expected to register in at a whopping +45% growth).
Mean P/E 10 Value is 16.4x Source: http://www.multpl.com
Additional problems with P/E-10:
1) The future 10 years might not be representative of the extreme technology and credit bubble we experienced over the last 10 years. Perhaps excluding the outlier years of 2000 and 2009 would make the ratio more relevant.
2) The current P/E-10 ratio is being anchored down by extreme prices from a narrow sector of technology a decade ago. Value stocks significantly outperformed technology over the last 10 years, much like small cap stocks outperformed in the 1970s when the Nifty Fifty stocks dominated the index and then unraveled.
3) Earnings are rising faster than prices are increasing, so investors waiting for the P/E-10 to come down could be missing out on the opportunity cost of price appreciation. The distorted P/E ratios earlier in the decade virtually guarantee the P/E-10 to drop, absent a current market melt-up, because P/E ratios were so high back then.
4) The tool has been a horrible predictor over very long periods of time. For example, had you followed the tool, the red light would have caused you to miss the massive appreciation in the 1990s, and the green light in the early 1970s would have led to little to no appreciation for close to 10 years.
Shiller himself understands the shortcomings of P/E-10:
“It is also dangerous to assume that historical relations are necessarily applicable to the future. There could be fundamental structural changes occurring now that mean that the past of the stock market is no longer a guide to the future.”
How good an indicator was P/E-10 for the proponent himself at the bottom of the market in February 2009? Shiller said he would get back in the market after another 30% drop in the ratio (click here for video). As we know, shortly thereafter, the market went on a near +70% upwards rampage. I guess Shiller just needs another -55% drop in the ratio from here to invest in the market?
Incidentally, Shiller did not invent the cyclically adjusted P/E tool, as famed value investor Benjamin Graham also used a similar tool. The average investor loves simplicity, but what P/E-10 offers with ease-of-use, it lacks in usefulness. I agree with the P/E-10 intent of smoothing out volatile cycle data (artificially inflated in booms and falsely depressed in recessions), but I recommend investors pull out a pair of binoculars (current and forward P/Es) rather than rely on a foggy rearview mirror.
Wade W. Slome, CFA, CFP®
Plan. Invest. Prosper.
DISCLOSURE: Sidoxia Capital Management (SCM) and some of its clients own certain exchange traded funds, but at the time of publishing SCM had no direct position in any other security referenced in this article. No information accessed through the Investing Caffeine (IC) website constitutes investment, financial, legal, tax or other advice nor is to be relied on in making an investment or other decision. Please read disclosure language on IC “Contact” page.
Flying to the Moon via Hyperinflation

With Ben Bernanke and his fellow Fed friends about to crank up the printing presses to overdrive, QE2 (quantitative easing part II) is top of mind among investors. QE2 talks of purchasing Treasuries and mortgage backed securities to pump more dollars into the financial system has been cited by many observers as a key factor in the upward progression in the equity markets over the last couple months. But is too much of a good thing in the short-run, detrimental in the long run due to inflationary pressures?
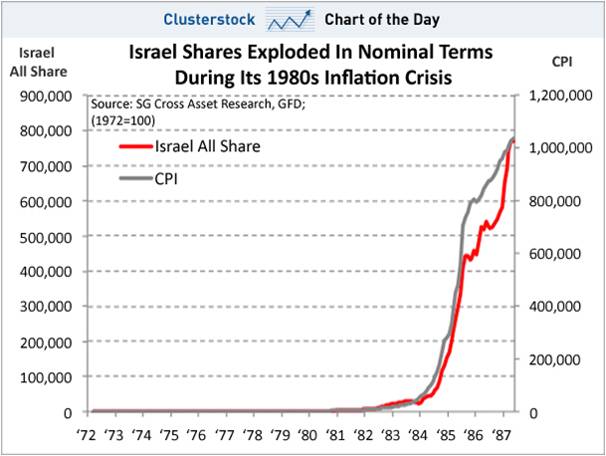
Not necessarily, if you consider the path of stocks in the hyperinflationary Israeli market of the 1970s and 1980s. Dylan Grice from Societe Generale notes that Israeli inflation averaged 84% from 1972 – 1987. During that period, Israeli equity markets managed to increase by a factor of 6,500 times according to Grice. So while inflation skyrocketed to the moon, so did stock prices. Will QE2 ignite dormant core inflation, which is hovering around 1%? If a declining U.S. dollar and rising commodity prices are the canary in the coalmine, then maybe piling into bonds like the majority of Americans is not the best idea?
Source: Business Insider - Clusterstock
Grice may be worried about inflation in the U.S., but Japan is at the forefront on his radar. Supporting that view, he has a modest 63,00,000.00 target on the Nikkei index by 2025 (the index sits at 9,160 today). That’s right…63 million. A near 7,000-fold increase may sound insane, but with exploding debt levels and deficits, coupled with declining demographics from an aging population, perhaps hyperinflation is not out of the question?
If push comes to shove, the Japanese government may print enough money to monetize debt the marketplace cannot absorb. Crazier things have happened in world history – during 1923 in the Weimar Republic of Germany hyperinflation led to a 4,200,000,000,000 German Mark to $1 U.S. dollar exchange rate. More recently we experienced a 79,600,000,000% inflation rate in Zimbabwe and the government actually issued a $100 trillion note. These astronomical inflation rates make our domestic inflationary worries seem like kids-play, but eventually the simple laws of economics will take over, if we do not get our fiscal house in order.
Double digit inflation in the U.S. during the stagflation era of the 1970s crimped Price-Earnings (P/E) ratios to single-digit levels, but this is not surprising with a Federal Funds rate that hit 20% in 1980 – 1981. Today the Fed Funds rate is at 0%, so I don’t think single-digit P/Es will be upon us anytime soon.
The great thing about money is it goes where it is treated best over the long run. In the short-run, money will slosh around and chase performance based on speculative animal spirits, but over time what Adam Smith called the “invisible hand” directs capital to appropriate investments. It was just a few months ago that pundits were talking about double-dip and deflation scenarios (see Double-Dip Guesses), and now on the brink of QE2, the pendulum has swung back to inflation fears. Printing excess amounts of money may provide temporarily fuel to help lift the economy off the ground, but if irresponsible fiscal decisions continue, then the economic rocket scheduled for the moon may come crashing back down with the economy. Do yourself a favor and pack a parachute filled with an adequate amount of equities – they will help protect you if your bond portfolio comes crashing down on higher rates and inflation.
Wade W. Slome, CFA, CFP®
Plan. Invest. Prosper.
DISCLOSURE: Sidoxia Capital Management (SCM) and some of its clients own certain exchange traded funds, but at the time of publishing SCM had no direct position in any other security referenced in this article. No information accessed through the Investing Caffeine (IC) website constitutes investment, financial, legal, tax or other advice nor is to be relied on in making an investment or other decision. Please read disclosure language on IC “Contact” page.
From Merger Wedding to eHarmony

Source: Photobucket
“Keep your eyes wide open before marriage, and half-shut afterwards.”
– Benjamin Franklin
Stocks share a lot of the same dynamics with dating and marriage. Some may choose to play the field through partnerships and joint ventures, while others may choose to remain independent as eternal bachelors/bachelorettes. Others, however, are willing to take the plunge. Unfortunately some marriages don’t last. But if things don’t work out, there is no need to worry because eHarmony.com (or resident investment bank) will always be there to help find your next perfect match.
Unlucky in Love
An example of a bloody divorce is the mega-merger between AOL Inc. and Time Warner (TWX) in 2000. The relationship was so destructive that investors witnessed AOL’s peak value of $222 billion in December 1999 (Fortune) plummet to around $3 billion today…ooooph!
Compared to some relationships, AOL lasted much longer. In fact Yahoo! Inc. (YHOO) didn’t even get to celebrate a honeymoon with Microsoft Corp. (MSFT) in February 2008 when the behemoth software company offered a +62% premium ($31 per share) for the gigantic portal. Microsoft’s $45 billion cash and stock offer was ruled unworthy by Yahoo’s board, so the company decided to leave Microsoft at the altar. Even after considering Yahoo’s latest price spike on acquisition rumors, Microsoft’s original bid is still almost double Yahoo’s current stock price of $16 per share.
Merger Scuttlebutt
As I discussed in my earlier mergers and acquisitions article (M&A) conditions are ripening with large corporate cash piles, a continued economic recovery, improved capital markets availability, and cheap credit costs (at least for those that qualify). With the clouds slowly lifting in the M&A world, suitors are shaking the trees for more potential opportunities.
While some acquirers may have altruistic intentions in combining companies, some marriages are done for pure gold-digging purposes. Private equity firms Blackstone Group (BX) and Silver Lake are rumored to be circling the Yahoo wagons and courting AOL as a potential partner in a joint bid. Whatever the expectations, if private equity plays a role in a Yahoo bid, the internet company should not become disillusioned with romantic warm and fuzzies – private equity firms like to get straight down to dirty business. Yahoo owns a 35% stake in Yahoo Japan and a 43% interest in leading Chinese e-commerce company, Alibaba Group. If a joint private equity bid were ever to win, I believe there would be a strong impetus to realize shareholder value by carving up these non-operating stakes. Consolidating overhead and streamlining expenses would likely be a top priority as well.
The Perfect Marriage
A “perfect marriage” could almost be called an oxymoron because like any relationship, there is significant work required by both parties. The divorce rate is estimated at around 40-50% in North America (Europe around the same), however mergers even fail at a higher 70% rate, according to Bain and Company study. I would argue successfully integrating larger deals are even more difficult, hampering the success rate even further. Merging two poorly managed companies purely for cost purposes is probably not the best way to go. Crashing two garbage trucks together is not going to create a Ferrari. I wouldn’t go as far as to say Yahoo and AOL are garbage trucks, but they face numerous, substantial challenges. Maybe these two companies are more akin to Mazdas transforming into a Toyota Camry (TM).
From my perspective, if companies really are dead set on engaging in acquisitions, then I urge management teams to focus on smaller digestible deals. Specifically, concentrate on those deals with experienced senior management teams who understand and respect the unique culture of the acquirer. Mergers also often fail due to excessive optimism and overly optimistic assumptions. This is an area in which Warren Buffett excels. Rarely do you observe the Oracle of Omaha overpaying for an acquisition, but rather he patiently waits for his fat pitch, and when it floats over the plate, Buffett is quick to throw out a lowball offer that will dramatically increase the probabilities of long-term merger success (think Geico, Sees Candy, Burlington Northern, etc.).
In the end, a joint relationship may not be forged between Yahoo, AOL and private equity firms, but if talks disintegrate, no need to worry – alternative partnerships can be explored on eHarmony.
Wade W. Slome, CFA, CFP®
Plan. Invest. Prosper.
DISCLOSURE: Sidoxia Capital Management (SCM) and some of its clients own certain exchange traded funds, but at the time of publishing SCM had no direct position in YHOO, MSFT, TWX, BX, BRKA, TM, Alibaba, or any other security referenced in this article. No information accessed through the Investing Caffeine (IC) website constitutes investment, financial, legal, tax or other advice nor is to be relied on in making an investment or other decision. Please read disclosure language on IC “Contact” page.
September Surge: Stop, Go, or Proceed Cautiously?

The stock market just posted its strongest September and third quarter performance in more than seven decades (S&P 500 +8.8% and +10.7%, respectively), yet people are still waiting for a clear green light to signal blue investment skies ahead. Well of course, once it is apparent to everyone that the economy is obviously back on track, the opportunities persisting today will either be gone or vastly diminished. I’m not a blind optimist, but a sober realist that understands, like Warren Buffett, that it pays to “buy fear and sell greed.” And fear is exactly what we are witnessing today. The $2.6 trillion sitting in CDs earning a horrendously low 1% is simple proof (Huffington Post).
Like the fresh memory of a recent hand burned on the stove, the broader general public is still feeling the pain and recovering from the financial crisis. Each gloomy real estate or unemployment headline triggers agonizing flashbacks (read Unemployment Hypochondria) of the 2008-2009 financial collapse and leads to harmful emotional investment decisions. However, for some of us finance geeks that have cut through the monotony of “pessimism porn” blasted over the airwaves, we have discovered plenty of positive leading economic indicators bubbling up below the surface, like the following:
- Continued Economic Growth: Gross Domestic Product (GDP) grew +1.7% in the second quarter and current estimates stand in the +2.0% to +2.5% range for third quarter GDP, which will mark the fifth consecutive quarter of growth.
- Growing Corporate Profits: S&P 500 earnings are estimated to expand by +45.6% in 2010 and are estimated to grow by another +15% or so next year (Standard & Poor’s September 2010).
- Escalating M&A: Mergers and acquisitions activity increased to $566.5 billion in the third quarter. The value of announced transactions is up +60% from a year ago according to Bloomberg. If you have a tough time comprehending the pickup in M&A, then take a peek here.
- Record Cash Piles: The top 1,000 largest global corporations held a whopping $2.87 trillion in cash (Bloomberg).
- Accelerating Share Buybacks: Share buybacks totaled $77.6 billion in the second quarter, up +221% from a record low last year – Barron’s).
- Dividends Galore: S&P 500 companies have lifted their payouts by $15 billion so far this year versus a reduction of $40 billion for the same period last year (The Wall Street Journal). Tech giant Cisco Systems Inc. (CSCO) announced the pending initiation of a dividend, while Microsoft Corp. (MSFT) increased its dividend by a significant +23%.
I’m not naïve enough to believe choppy waters will disappear for good, but despite the depressing headlines there are constructive undercurrents. Beyond the points above, equity market prices remain attractive relative to the broader fixed-income markets (see Bubblicious Bonds) . More specifically, the S&P 500 is priced at about a 25% discount to historic valuation averages over the last 55 years (currently trading at about 12.5 Price/Earnings ratio vs 16.5x historic Price/Earnings ratio – Bloomberg). Now may not be the time to recklessly run a red light, but if you fearfully remain halted in front of the green light then prepare to receive a pricey ticket.
Wade W. Slome, CFA, CFP®
Plan. Invest. Prosper.
DISCLOSURE: Sidoxia Capital Management (SCM) and some of its clients own certain exchange traded funds and CSCO, but at the time of publishing SCM had no direct position in MSFT, or any other security referenced in this article. No information accessed through the Investing Caffeine (IC) website constitutes investment, financial, legal, tax or other advice nor is to be relied on in making an investment or other decision. Please read disclosure language on IC “Contact” page.
Why it’s NOT Different This Time

“Those who don’t know history are destined to repeat it.”
– Edmund Burke – British Statesman and Philosopher (1729-1797)
I wasn’t a history major in college, but I’ve learned two things by studying history books: 1) The unchanging psyche of human nature leads history consistently to repeats itself; and 2) There is never a shortage of goofballs willing to make zany predictions.
Robert Zuccaro is no exception to lesson number two, as evidenced by his 2001 book, Why it’s Different this Time…Dow 30,000 by 2008! Sticking one’s neck out is never too difficult when you have a multi-decade trend behind your back – I guess Dow “14,000” just didn’t sound sexy enough back then. Unfortunately the herd reacting to these bold, extreme predictions eventually realize (usually post-mortem) that they are quickly approaching a tail-end of a cycle. The cab driver, hair dresser, and mechanic realized the dangers of following the “New Economy” cheerleaders in 1999 when everyone was piling into dot-com stocks (see Bubblicious technology table ).
Dow 1,000 Here We Come!

- Source: Yahoo! Finance

Today, the Zuccaros of the world have been washed to the curb, and new “Armageddon” extremists have sprouted up to the surface, like perma-bear Peter Schiff and his call for Dow 2,000 or his $5,000 per ounce gold estimate. More recently, Robert Prechter has one-upped Schiff by forecasting Dow 1,000 with the assistance of the not-so ironclad Elliott Wave Theory philosophy (see Technical Analysis: Astrology or Lob Wedge). If you’re in the Prechter camp, either crawl back into your bunker or start digging that dream cave you always wanted.

Source: Elliott Wave International
“Hey, Look Here at My Crazy Forecast!”
Publicity doesn’t necessarily rain praise on those parroting the consensus view (although the warmth of job security is appreciated), but rather the extreme outliers love to bask in the glow of media attention. The extremists consistently repeat “why it’s different this time.” What is different is the set of circumstances, but what history shows us over and over again is the emotions of fear and greed feeding the bubbles of excess are exactly the same. Whether you’re talking about the Tulip-Mania of the 1630s, the Nifty Fifty stocks of 1973-1974, the technology Four Horsemen of the mid-1990s, or the Icelandic Banks of 2008, what we learn from the lessons of history is that human nature will never change and fear and greed will continue creating and bursting future bubbles.
People playing the game long enough understand, “It’s NOT different this time.” Not only have we endured repeated wars, recessions, banking crises, currency crises, but we have also survived every exotic animal disease known to man, including Mad Cow, Swine Flu, Bird Flu, West Nile, etc.
Robert Zuccaro and Robert Prechter may get an “A” for their attention grabbing forecasts, but thus far the grade earned on accuracy is closer to an “F.” More specifically, Zuccaro’s prediction never came close to 30,000 by the end of 2008 (only off by about 21,000 points), and guess what, Bob Prechter has a long way to go before reaching his Dow 1,000 target. So here is my proposition: Why don’t we just split the difference between Zuccaro’s 2008 and Prechter’s 2016 forecasts and take the average? If it turns out they are equally bad forecasters, then Dow 15,500 by 2012 should be no problem ([30,000 + 1,000] ÷ 2)!
Regardless of the ultimate outcome of this market (double-dip or sustained recovery), what I do know is there will continue to be wacky outlandish forecasters rationalizing why a trend will go on for infinity and why “this time is different.” In reality these attention mongers will always be around ensuring this time (or next time) will never be different…just the same fear and greed as always.
Wade W. Slome, CFA, CFP®
Plan. Invest. Prosper.
DISCLOSURE: Sidoxia Capital Management (SCM) and some of its clients own certain exchange traded funds, but at the time of publishing SCM had no direct position in any other security referenced in this article. No information accessed through the Investing Caffeine (IC) website constitutes investment, financial, legal, tax or other advice nor is to be relied on in making an investment or other decision. Please read disclosure language on IC “Contact” page.
Professional Double-Dip Guesses are “Probably” Wrong

As you may have noticed from previous articles, I take a significant grain (or pound) of salt when listening to economists and strategists like Peter Schiff, Nouriel Roubini, Meredith Whitney, John Mauldin, et.al. Typically, these financial astrologists weave together convincing, elaborate, grand guesses that extrapolate every short-term, fleeting economic data point into an imposing (or magnificent) long-term secular trend.
With all this talk of “double-dip” recession, I cannot help but notice the latest verbal tool implemented by every Tom, Dick, and Harry economist when discussing this topic… the word “probability”. Rather than honestly saying I have no clue on what the economy will do, many strategists place a squishy numerical “probability” around the possibility of a “double-dip” recession consistent with the news du jour. Over recent weeks, unstable U.S. economic data have been coming in softer than expectations. So, guess what? Economists have become more pessimistic about the economy and raised the “probability” of a double dip recession. Thanks Mr. Professor “Obvious!” I’m going to go out on a limb, and say the probability of a double-dip recession will likely go down if economic data improves. Geez…thanks.
Here is a partial list of double-dip “probabilities” spouted out by some well-known and relatively unknown economists:
- Robert Shiller (Professor at Yale University): “The probability of that kind of double-dip is more than 50 percent.”
- Bill Gross (Founder/Managing Director at PIMCO): The New York Times described Gross’s double-dip radar with the following, “He put the probability of a recession — and of an accompanying bout of deflation — at 25 to 35 percent.”
- Mohamed El-Erian (CEO of PIMCO): “If you wonder how meaningful 25 per cent is, ask yourself the following question: if I offered you that I drive you back to work, but there’s a one in four chance that I get into a big accident, would you come with me?”
- David Rosenberg (Chief Economist at Gluskin Chef): In a recent newsletter, Rosenberg has raised the odds of a double-dip recession from 45 per cent a month ago to 67 per cent currently.
- Nouriel Roubini (Professor at New York University): “As early as August 2009 I expressed concern in a Financial Times op-ed about the risk of a double-dip recession, even if my benchmark scenario characterizes the risk of a W as still a low probability event (20% probability) as opposed to a 60% probability for a U-shaped recovery.”
- Robert Reich (Former Secretary of Labor): According to Martin Fridson, Global Credit Strategist at BNP Paribas, Robert Reich has assigned a 50% probability of a double dip, even if Reich believes we are actually in one “Long Dipper.”
- Graeme Leach (Chief Economist at the Institute of Directors): “I would give a 40 per cent probability to what I call ‘one L of a recovery’, in other words a fairly weak flattish cycle over the next 12 months. A double-dip recession would get a 40 per cent probability as well.”
- Ed McKelvey (Sr. U.S. Economist at Goldman Sachs): “We think the probability is unusually high — between 25 percent and 30 percent — but we do not see double dip as the base case.”
- Avery Shenfeld (Chief Economist at CIBC): “The probability estimate is likely more consistent with a slowdown rather than a true double-dip recession but, given the uncertainties, fiscal tightening ahead and the potential for a slow economy to be vulnerable to shocks, we will keep an eye on our new indicator nevertheless.” This guy can’t even be pinned down for a number!
- National Institute for Economic and Social Research (NIESR) : “The probability of seeing a contraction of output in 2011 as compared to 2010 has risen from 14 per cent to 19 per cent.”
- New York Fed Treasury Spread Model (see chart below): Professor Mark J. Perry notes, “For July 2010, the recession probability is only 0.06% and by a year from now in June of next year the recession probability is only slightly higher, at only 0.3137% (less than 1/3 of 1%).”
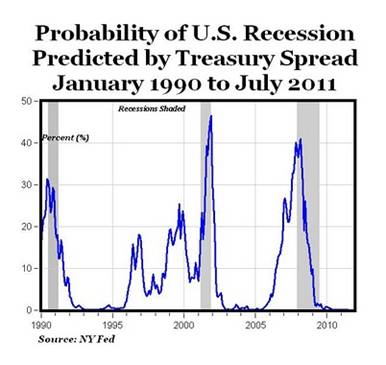
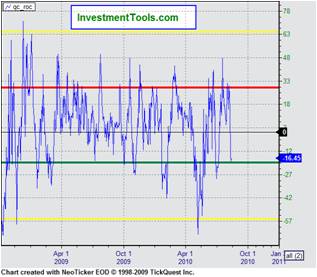
Listening to these economic armchair quarterbacks predict the direction of the financial markets is as painful as watching Jim Gray’s agonizing hour-long interview of Lebron James’s NBA contract decision (see also Lebron: Buy, Sell, or Hold?). Just what I want to hear – a journalist that probably has never dribbled a ball in his life, inquiring about cutting edge questions like whether Lebron is still biting his nails? Most of these economists are no better than Jim Gray. In many instances these professionals don’t invest in accordance with their recommendations and their probability estimates are about as reliable as an estimate of the volatility index (see chart below) or a prediction about Lindsay Lohan’s legal system status.
I can virtually guarantee you at least one of the previously mentioned economists will be correct on their forecasts. That isn’t much of an achievement, if you consider all the strategists’ guesses effectively cover every and any economic scenario possible. If enough guesses are thrown out there, one is bound to stick. And if they’re wrong, no problem, the economists can simply blame randomness of the lower probability event as the cause of the miscue.
Unlike Wayne Gretzky, who said, “I skate to where the puck is going to be, not where it has been,” economists skate right next to the puck. Because the economic data is constantly changing, this strategy allows every forecaster to constantly change their outlook in lock-step with the current conditions. This phenomenon is like me looking at the dark clouds outside my morning window and predicting a higher probability of rain, or conversely, like me looking at the blue skies outside and predicting a higher chance of sunshine.
Using this “probability” framework is a convenient B.S. means of saving face if a directional guess is wrong. By continually adjusting probability scenarios with the always transforming economic data, the strategist can persistently waffle with the market sentiment vicissitudes.
What would be very refreshing to see is a strategist on CNBC who declares he was dead wrong on his prediction, but acknowledges the world is inherently uncertain and confesses that nobody can predict the market with certainty. Instead, the rent-o-strategists consistently change their predictions in such a manner that it is difficult to measure their accuracy – especially when there is rarely hard numbers to hold these professional guessers accountable for.
Economists and strategists may be well-intentioned people, just as is the schizophrenic trading advice of Jim Cramer of CNBC’s Mad Money, but the “probability” of them being right over relevant investing time horizons is best left to an experienced long-term investor that understands the pitfalls of professional guessing.
Wade W. Slome, CFA, CFP®
Plan. Invest. Prosper.
*DISCLOSURE: Sidoxia Capital Management (SCM) and some of its clients own certain exchange traded funds, but at the time of publishing SCM had no direct position in GS, NYT or any security referenced in this article. No information accessed through the Investing Caffeine (IC) website constitutes investment, financial, legal, tax or other advice nor is to be relied on in making an investment or other decision. Please read disclosure language on IC “Contact” page.
Private Equity: Hitting Maturity Cliff

Photo source: 1Funny.com
Wow, those were the days when money was as cheap and available as that fragile, sandpaper-like toilet paper you find at gas stations. Private equity took advantage of this near-free, pervasive capital and used it to the greatest extent possible. The firms proceeded to lever up and gorge themselves on a never-ending list of target companies with reckless abandon (see also Private Equity Shooting Blanks). Now the glory days of abundant, ultra-cheap capital are history.
Rather than rely on low-cost bank debt, private equity firms are now turning to the fixed income markets – specifically the high yield market (a.k.a. junk bonds). As The Financial Times points out, more than $170 billion of junk bonds have been issued this year, in large part to refinance debt issued in the mid-2000s that has gone sour due to overoptimistic projections and a flailing U.S. economy. In special instances, private equity owners are fattening their own wallets by declaring special dividends for themselves.
Even though some of these over-levered, private equity portfolio companies have received a temporary reprieve from facing the harsh economic realities thanks to these refinancings, the cliff of maturing debt in 2012 is fast approaching. Some have estimated that $1 trillion in maturing debt will roll through the market in the 2012-2014 timeframe. Either the economy (or operating performance) improves enough for these companies to service their debt, or these companies will find themselves falling off these maturity cliffs into bankruptcy.
Junk is Not Risk-Free
Driving this trend of loan recycling is risk aversion to stocks and a voracious appetite for yield in a yield desert. Stuffing the money under the mattress, earning next to nothing on CDs (Certificates of Deposit) and money market accounts, will not help in meeting many investors’ long-term objectives. The “uncertain uncertainty” swirling around global equity markets has nervous investors flocking to bonds. The opening of liquidity in the high yield markets has served as a life preserver for these levered companies desperate to refinance their impending debt. This high-yield debt refinancing window is also an opportunity for companies to lower their interest expense burden because of the current, near record-low interest rates.
But as the name implies, these “junk bonds” are not risk free. For starters, embedded in these bonds is interest rate risk – with a Federal Funds rate at effectively zero, there is only one upward direction for interest rates to go (bad for bond prices). In addition, credit risk is a concern as well. In the midst of the financial crisis, many of these high-yield bonds corrected by more than -40% from their highs in 2008 until the bottom achieved in early 2009. If the economy regresses back into a double-dip recession, many of these bonds stand to get pummeled as default rates escalate (see also, bond risks).
Pace Not Slowing
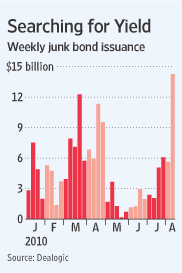
Source: Dealogic via WSJ
Does the appetite for high yield appear to be slowing? Au contraire. In the most recent week, Dealogic noted $15.4 billion in junk bonds were sold. The FT sees the pace of junk deals handily outpacing the record of $185.4 billion set in 2006.
The Wall Street Journal used the following deals to provide a flavor of how companies are using high-yield debt in the present market:
“First Data Corp. sold $510 million of 10-year notes this week, at 9.125%, to pay down bank debt due in 2014. Peabody Energy sold $650 million of 6.5%, 10-year notes to pay off the same amount of higher-priced debt due in three years. MultiPlan Inc., a health-care cost-management provider, sold $675 million of notes this week, at 9.875%, to help fund a buyout of the company. Cott Corp., a maker of store-branded soft drinks, sold $375 million of debt at 8.125% to fund its purchase of another company, Cliffstar Corp.”
The roads on the junk bond highway appear to be pothole free at the moment, however a cliff of debt is rapidly approaching over the next few years, so high-yield investors should travel carefully as conditions in the junk market potentially worsen. As we witnessed in 2008-2009, it can take a while to hit rock bottom in the riskier areas of the credit spectrum.
Read full Financial Times and Wall Street Journal articles on the high yield market.
Wade W. Slome, CFA, CFP®
Plan. Invest. Prosper.
*DISCLOSURE: Sidoxia Capital Management (SCM) and some of its clients own certain exchange traded funds (including HYG and JNK), but at the time of publishing SCM had no direct position in First Data Corp., Peabody Energy (BTU), MultiPlan Inc., Cott Corp. (COT), Cliffstar Corp., or any security referenced in this article. No information accessed through the Investing Caffeine (IC) website constitutes investment, financial, legal, tax or other advice nor is to be relied on in making an investment or other decision. Please read disclosure language on IC “Contact” page.
“De-Risking” – It’s All Greek to Me

Source: Photobucket
In the classic comedy Animal House John Belushi (who played the character Bluto) gave new meaning to the Greek toga party (who cares if the Romans actually invented the garment?). Belushi also added some flare to Sam Cooke’s timeless song, Wonderful World:
“Don’t know much about history
Don’t know much biology
Don’t know much about the science book
Don’t know much about the French I took.”
Another line should have been added: “Don’t know much about Wall Street jargon.”
“Derisking” – New Wall Street Word Du Jour
Wading through and keeping up with the ever expanding dictionary of Wall Street lingo and acronyms can be a difficult task – much like deciphering the Greek writings of Plato, the famous ancient philosopher.
A recent term repeated constantly by CNBC commentators and hedge fund managers at the annual SALT (SkyBridge Alternatives) conference in Las Vegas, Nevada deserves some more attention…“derisking.” Elegant, simple, chic, and yes, pure B.S. Why not use “mis-risking,” “un-risking,” “dis-risking?” I suppose when charging people 2 and 20 (a 2% management fee plus 20% of profits above a hurdle), one must try to make the most prosaic terms and expressions sound mysterious and dazzling.
Asking one hedge fund manager after another, CNBC commentator David Faber continually asked managers at the May conference what investing strategies were being employed. Faber asked Marc Lasry, CEO and Co-Founder of Avenue Capital Group, the following:
“I have spoken to number of other large hedge fund managers this morning. Derisking, that’s what they are all talking about Marc. So, given that, are you derisking at all?”
Translation: “The market is going down, so are you following all the other lemmings and becoming more conservative because of the panicked-induced headlines we’re shoveling 24/7?”
Glenn Dubin, Co-Founder and CEO of Highbridge Capital Management, a hedge fund company owned by JP Morgan (JPM) got in the “derisking” mood too: “At this point…we are seeing massive de-risking.”
At the time of the SALT conference, European economic concerns were top of mind for all the fast-money traders, as fears of a credit contagion spreading from Greece to larger countries like Italy and Spain felt more palpable to many. Some nine weeks later, the European bank stress tests have been completed, some overseas economic indicators have come in better than anticipated (i.e., U.K. GDP, German business confidence, exports), and some European markets are up about +10% from the “derisking” phase. So, I wonder what those same hedge funds and traders are doing now?
Perhaps they are “rerisking?” I just made that one up out of thin air, but if I hear “rerisking” on CNBC or see it in the Wall Street Journal, I demand a credit in the Merriam-Webster dictionary, or a citation in Wikipedia at a minimum.
The “derisking” wave did not stop at the SALT conference, but remains alive and well today. In fact, a conference has been created in its honor: The 3rd Annual De-Risking Strategies Summit for Pension Funds, Foundations, and Endowments on October 25 – 27, 2010 in New York.
Obviously, this is just one of many terms, acronyms, and euphemisms that the Wall Street machine is constantly churning out. If “derisking” doesn’t float your boat, then why not try on a “swaption” and “straddle” or “contango” and “crawling peg?”
If the never-ending list of Wall Street jargon is weighing you down and a financial professional is speaking Greek to you with confusing financial terminology, then do yourself a favor and slap that person into silence. More often than not, these financial concepts can be explained to a fifth grader (or Bluto). Unfortunately, a convoluted combination of jargon and acronyms is often used in an attempt to impress the listener. The result is usually confusion and a blank stare.
If you are frustrated with learning the language of Wall Street, you are not alone. I recommend you “derisk” your education by adding Greek 101 to your coursework. If you are going to be confused, you might as well do it with a gyro and some Ouzo in hand.
Wade W. Slome, CFA, CFP®
Plan. Invest. Prosper.
*DISCLOSURE: Sidoxia Capital Management (SCM) and some of its clients own certain exchange traded funds, but at the time of publishing SCM had no direct position in JPM or any security referenced in this article. No information accessed through the Investing Caffeine (IC) website constitutes investment, financial, legal, tax or other advice nor is to be relied on in making an investment or other decision. Please read disclosure language on IC “Contact” page.
Marathon Investing: Genesis of Cheap Stocks

It was Mark Twain who famously stated, “The reports of my death have been greatly exaggerated.” So too has the death of equities been overstated. Long-term stock bulls don’t have a lot to point to since the market, as measured by the S&P 500 index, has done absolutely nothing over the last 12 years (see Lost Decade). Over the last 10 years, the market is actually down about -20% without dividends (and about flat if you account for reinvested dividends). So if equities belong at the morgue, why not just short the market, burn your dollars, and hang out in a cave with a pile of gold? Well, behind the scenes, and off the radar of nanosecond, high frequency, day-trading CNBC junkies, there has been a quiet but deliberate strengthening in the earnings foundation of the market. In the investing world it’s difficult to move forward through sand. Even without a sturdy running foundation, sprinters can race to the front of the pack, but those disciplined runners who systematically train for marathons are the ones who successfully make it to the finish line.
Prices Chopped in Half
What many pundits and media mavens fail to recognize is S&P corporate profits have virtually doubled since 1998 (a historically elevated base), despite market prices stuck in quicksand for a dozen years. What does this say about the valuation of the market when prices go nowhere and profits double? Simple math tells us that all stock market inventory is selling for -50% off (the market multiple has been chopped in half). That’s exactly what we have seen – the June 1998 market multiple (valuation) stood around 27x’s earnings and today’s 2010 earnings estimates imply a multiple of about 13.5 x’s projected profits. With the rear-view mirror assisting us, it’s easy to understand why pre-2000 (tech bubble) valuations were expensive. By coupling more reasonable valuations with a 10-Year Treasury Note trading at 3.19% and lofty bond prices, I would expect stocks to be poised for a much better decade of relative performance versus bonds. The case becomes even stronger if you believe 2011 S&P 500 estimates are achievable (12x’s earnings).
In order to make the decade long valuation contraction more apparent, I wanted include a random group of stocks (mixture of healthcare, media, retailer, consumer non-discretionary, and financial services) to liven up my argument:
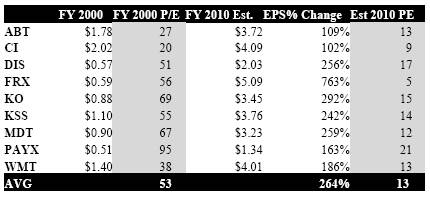
Data sources: S&P, ADVFN & Yahoo! Finance
What Next?
From a stock market standpoint, there are certainly plenty of believable “double dip” scenarios out there along with thoughtful observers who question the attainability of next year’s earnings forecasts. With that said, I do have problems with those bears like John Mauldin (read The Man Who Cries Wolf) who just last year pointed to a market trading at a “(negative) -467” P/E ratio, only to subsequently watch stocks advance some 80%+ over the following months.
Regardless of disparate economic views, I contend objective market observers (even bearish ones) have trouble indicating the market is ridiculously expensive with a straight face – based on current corporate profit expectations. At the end of the day, sustainable earnings and cash flow growth are what ultimately drive durable, long-term price appreciation. As Peter Lynch stated with technical precision, “People may bet on hourly wiggles of the market but it’s the earnings that waggle the wiggle long term.”
Running a marathon is always challenging, but with a sturdy foundation in which prices have been chopped in half (see also Market Dipstick article), reaching the goal and finish line for long-term investors will be much more achievable.
Wade W. Slome, CFA, CFP®
Plan. Invest. Prosper.
*DISCLOSURE: Sidoxia Capital Management (SCM) and some of its clients own certain exchange traded funds, WMT, and PAYX, but at the time of publishing SCM had no direct positions in ABT, CI, DIS, FRX, KO, KSS, MDT or any other security referenced in this article. No information accessed through the Investing Caffeine (IC) website constitutes investment, financial, legal, tax or other advice nor is to be relied on in making an investment or other decision. Please read disclosure language on IC “Contact” page.




 Investing Caffeine
