Posts filed under ‘Financial Markets’
1994 Bond Repeat or 2013 Stock Defeat?

Interest rates are moving higher, bond prices are collapsing, and fear regarding a stock market plunge is palpable. Sound like a recent news headline or is this a description of a 1994 financial market story? For those with a foggy, double-decade-old memory, here is a summary of the 1994 economic environment:
- The economy registered its 34th month of expansion and the stock market was on a record 40-month advance
- The Federal Reserve embarked on its multi-hike, rate-tightening monetary policy
- The 10-year Treasury note exhibited an almost 2.5% jump in yields
- Inflation was low with a threat of rising inflation lurking in the background
- An upward sloping yield curve encouraged speculative bond carry-trade activity (borrow short, invest long)
- Globalization and technology sped up the pace of price volatility
Many of these listed items resemble factors experienced today, but bond losses in 1994 were much larger than the losses of 2013 – at least so far. At the time, Fortune magazine called the 1994 bond collapse the worst bond market loss in history, with losses estimated at upwards of $1.5 trillion. The rout started with what might have appeared as a harmless 0.25% increase in the Federal Funds rate (the rate that banks lend to each other) from 3% to 3.25% in February 1994. By the time 1994 came to a close, acting Federal Reserve Chairman Alan Greenspan had jacked up this main monetary tool by 2.5%.
Rising rates may have acted as the flame for bond losses, but extensive use of derivatives and leverage acted as the gasoline. For example, over-extended Eurobond positions bought on margin by famed hedge fund manager Michael Steinhardt of Steinhardt Partners lead to losses of about-30% (or approximately $1.5 billion). Renowned partner of Omega Partners, Leon Cooperman, took a similar beating. Cooperman’s $3 billion fund cratered -24% during the first half of 1994. Insurance company bond portfolios were hit hard too, as collective losses for the industry exceeded $20 billion, or more than the claims paid for Hurricane Andrew’s damage. Let’s not forget the largest casualty of this era – the public collapse of Orange County, California. Poor derivatives trades led to $1.7 billion in losses and ultimately forced the county into bankruptcy.
There are plenty of other examples, but suffice it to say, the pain felt by other bond investors was widespread as a massive number of margin calls caused a snowball of bond liquidations. The speed of the decline was intensified as bond holders began selling short and using derivatives to hedge their portfolios, accelerating price declines.
Just as the accommodative interest rate punch bowl was eventually removed by Greenspan, so too is Ben Bernanke (current Fed Chairman) threatening to do today. Even if Bernanke unleashes a cold-turkey tapering of the $85 billion per month in bond-purchases, massive losses in bond values won’t necessarily mean catastrophe for stock values. For evidence, one needs to look no further than this 1994-1995 chart of the stock market:
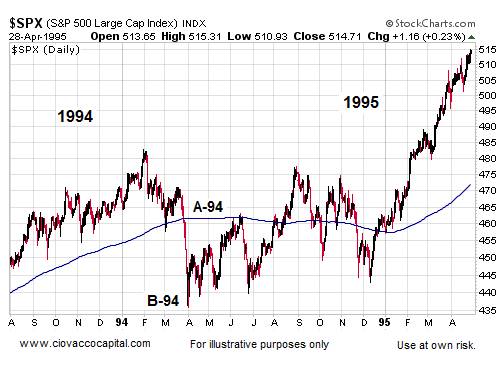
Source: Ciovaccocapital.com
Volatility for stocks definitely increased in 1994 with the S&P 500 index correcting about -10% early in the year. But as you can see, by the end of the year the market was off to the races, tripling in value over the next five years. Volatility has been the norm for the current bull market rally as well. Despite the more than doubling in stock prices since early 2009, we have experienced two -20% corrections and one -10% pullback.
What’s more, the onset of potential tapering is completely consistent with core economic principles. Capitalism is built on free trading markets, not artificial intervention. Extraordinary times required extraordinary measures, but the probabilities of a massive financial Armageddon have been severely diminished. As a result, the unprecedented scale of quantitative easing (QE) will eventually become more harmful than beneficial. The moral of the story is that volatility is always a normal occurrence in the equity markets, therefore any significant stock pullback associated with potential bond tapering (or fed fund rate hikes) shouldn’t be viewed as the end of the world, nor should a temporary weakening in stock prices be viewed as the end to the bull market in stocks.
Why have stocks historically provided higher returns than bonds? The short answer is that stocks are riskier than bonds. The price for these higher long-term returns is volatility, and if investors can’t handle volatility, then they shouldn’t be investing in stocks.
If you are an investor that thinks they can time the market, you wouldn’t be wasting your time reading this article. Rather, you’d be spending time on your personal island while drinking coconut drinks with umbrellas (see Market Timing Treadmill).
Although there are some distinct similarities between the economic backdrop of 1994 and 2013, there are quite a few differences also. For starters, the economy was growing at a much healthier clip then (+4.1% GDP growth), which stoked inflationary fears in the mind of Greenspan. Moreover, unemployment was quite low (5.5% by year-end vs. 7.6% today) and the Fed did not communicate forward looking Fed policy back then.
It’s unclear if the recent 50 basis point ascent in 10-year Treasury rates was just an appetizer for what’s to come, but simple mathematics indicate there is really only one direction left for interest rates to go…higher. If history repeats itself, it will likely be bond investors choking on higher rates (not stock investors). For the sake of optimistic bond speculators, I hope Ben Bernanke knows the Heimlich maneuver. Studying history may help bond bulls avoid indigestion.
Wade W. Slome, CFA, CFP®
Plan. Invest. Prosper.
DISCLOSURE: Sidoxia Capital Management (SCM) and some of its clients hold positions in certain exchange traded funds (ETFs), but at the time of publishing SCM had no direct position in any other security referenced in this article. No information accessed through the Investing Caffeine (IC) website constitutes investment, financial, legal, tax or other advice nor is to be relied on in making an investment or other decision. Please read disclosure language on IC Contact page.
Bond-Choking Central Banks Expand Investment Menu

Central banks around the globe are choking on low-yielding bonds, and as result are now expanding their investment menu beyond Treasuries into equities. Expansionary monetary policies purchasing short-term, low-rate bonds means that central banks have been gobbling up securities on their balance sheets that are earning next to nothing. To counteract the bond-induced indigestion of the central banks, many of them are considering increasing their equity purchasing strategies. How can you blame them? With the 10-year U.S. Treasury notes yielding 1.66%; 10-year German bonds eking out 1.21%; and 10-year Japanese Government Bonds (JGBs) paying a paltry 0.59%, it’s no wonder central banks are looking for better alternatives.
More specifically, the Bank of Japan (BOJ) is planning to pump $1.4 trillion into its economy over the next two years to encourage some inflation through open-ended asset purchases. Earlier this month, the BOJ said it has a goal of more than doubling equity related exchange traded funds (ETFs) by the end of 2014. According to Business Insider, the BOJ is currently holding $14.1 billion in equity ETFs with an objective to reach $35.3 billion in 2014.
I can only imagine how stock market bears feel about this developing trend when they have already blamed central banks’ quantitative easing initiatives as the artificial support mechanism for stock prices (see also The Central Bank Dog Ate my Homework).
While expanded equity purchases could break the backs of bond bulls and stock naysayers, some smart people agree that this strategy makes sense. Take Jim O’Neill, the chairman of Goldman Sachs Asset Management, who is retiring next week. Here’s what he has to say about expanded central bank stock purchases:
“Frankly, it makes a huge amount of sense in a world of floating exchange rates and such incredible opportunity, why should central banks keep so much money in very short term, liquid things when they’re not going to ever need it? To help their future returns for their citizens, why would they not invest in equity?”
How big is this shift towards equities? The Royal Bank of Scotland conducted a survey of 60 central banks that have about $6.7 trillion in reserves. There were 13% of the central banks already invested in equities, and almost 25% of them said they are or will be invested in equities within the next five years.
While I may agree that stocks generally are a more attractive asset class than bubblicious bonds right now, I may draw the line once the Fed starts buying houses, gasoline, and groceries for all Americans. Until then, dividend yields remain higher than Treasury yields, and the earnings yields (earnings/price) on stocks will remain more attractive than bond yields. Once stocks gain more in price and/or bonds sell off significantly, it will be a more appropriate time to reassess the investment opportunity set. A further stock rise or bond selloff are both possible scenarios, but until then, central banks will continue to look to place its money where it is treated best.
The central bank menu has been largely limited to low-yielding, overpriced government bonds, but the appetite for new menu items has heightened. Stocks may be an enticing new option for central banks, but let’s hope they delay buying houses, gasoline, and groceries.
Wade W. Slome, CFA, CFP®
Plan. Invest. Prosper.
DISCLOSURE: Sidoxia Capital Management (SCM) and some of its clients hold positions in certain exchange traded funds (ETFs), but at the time of publishing SCM had no direct position in any other security referenced in this article. No information accessed through the Investing Caffeine (IC) website constitutes investment, financial, legal, tax or other advice nor is to be relied on in making an investment or other decision. Please read disclosure language on IC Contact page.
Damned if You Do, and More Damned if You Don’t

Source: Photobucket
In the stock market you are damned if you do, and more damned if you don’t.
There are a million reasons why the market should or can go down, and the press, media, and bears come out with creative explanations every day. The “Flash Crash,” debt ceiling debate, credit downgrades, elections, and fiscal cliff were all credible events supposed to permanently crater the market. Now we have higher taxes (capital gains, income, and payroll), sequester spending cuts, and a nagging recession in Europe. What’s more, the pessimists point to the unsustainable nature of elevated corporate profit margins, and use the ludicrous Robert Shiller 10-year Price-Earnings ratio as evidence of an expensive market (see also Foggy Rearview Mirror). If an apple sold for $10 ten days ago and $0.50 today, would you say, I am not buying an apple today because the 10-day average price is too high? If you followed Robert Shiller’s thinking, this logic would make sense.
Despite the barrage of daily concerns and excuses, the market continues to set new record highs and the S&P 500 is up by more than +130% since the 2009 lows – just a tad higher than the returns earned on cash, gold, and bonds (please note sarcasm). Cash has trickled into equities for the first few months of 2013 after years of outflows, but average investors have only moved from fear to skepticism (see also Investing with the Sentiment Pendulum ). With cash and bonds earning next to nothing; gold underperforming for years; and inflationary pressures eroding long-term purchasing power, the vice is only squeezing tighter on the worrywarts.
Are there legitimate reasons to worry? Certainly, and the opportunities are not what they used to be a few years ago (see also Missing the Pre-Party). Although an endangered species, long-term investors understand backwards looking economic news is useless. Or as Peter Lynch wisely stated, “If you spend 13 minutes a year on economics, you’ve wasted 10 minutes.” The fact remains that the market is up 70% of the time, on an annual basis, and has been a great place to beat inflation over time. It’s a tempting endeavor to avoid the down markets that occur 30% of the time, but those who try to time the market fail miserably over the long-run (see also Market Timing Treadmill).
Equity investors would be better served by looking at their investment portfolios like real estate. Homeowners implicitly know the value of their home changes on a daily basis, but there are no accurate, real-time quotes to reference your home value on a minute by minute basis, as you can with stocks. Most property owners know that real estate is a cyclical asset class that is not impacted by daily headlines, and if purchased at a reasonable price, will generally go up in value over many years. Unfortunately, for many average investors, equity portfolios are treated more like gambling bets in Vegas, and get continually traded based on gut instincts.
Volatility is at six-year lows, and investors are getting less uncomfortable with owning stocks. Although everybody and their mother has been waiting for a pullback (myself included), don’t get too myopically focused. For the vast majority of investors, who should have more than a ten year time horizon, you should understand that volatility is normal and recessions will cause stocks to gown significantly, twice every ten years on average. If you are a long-term investor, like you should be, and you understand these dynamics, then you will also understand that you will be more damned if you don’t invest in equities as part of a diversified portfolio.
Wade W. Slome, CFA, CFP®
Plan. Invest. Prosper.
DISCLOSURE: Sidoxia Capital Management (SCM) and some of its clients hold positions in certain exchange traded funds (ETFs), but at the time of publishing SCM had no direct position in any other security referenced in this article. No information accessed through the Investing Caffeine (IC) website constitutes investment, financial, legal, tax or other advice nor is to be relied on in making an investment or other decision. Please read disclosure language on IC Contact page.
Fine Tuning Your Stock Fishing Skills

If you are one of those fishing hobbyists crowded among a large group while hunting for a big fish, mathematics dictates your odds of reeling in a grand prize are significantly diminished. Expert fishermen are generally the first to arrive because they understand once the masses appear the opportunities will disappear. Like big fish, colossal stocks are rarely discovered by a large herd of investors. Financial bubbles occur in this manner, however these periods are usually short-lived and the investor pack often ends up losing more money on the way down relative to the profits earned on the way up. Successful investors are usually the ones following a disciplined systematic approach that is often contrarian in nature. In other words, not chasing performance requires patience, an elusive quality in these fast-paced, frenetic financial markets.
More prevalent in these markets are impulsive day-traders, unruly high frequency traders, and tempestuous hedge funds. Why own stocks, if you can rent them? Like a fisherman who constantly casts his/her bait in and out of the water, a short-sighted investor cannot realize outsized gains, unless the bait is given sufficient time to lure (find) the next winning idea.
Like many professions, experts often optimally mix the quantitative science and behavioral art of their craft. Whether it’s a teacher, doctor, accountant, attorney, or bus driver, the people who excel in their profession are the ones who move beyond the statistical and procedural basics of their trade. Practicing and understanding the nuts and bolts of your job is important, but developing those intangible, artistic skills only comes with experience. Unfortunately, many investing hobbyists don’t appreciate these artistic nuances and as a result go on destroying their portfolios, even though they act as if they were experts.
On the flip-side, decisions purely based on gut instincts will also lead to sub-par outcomes. The fisherman who does not account for the wind, temperature, geography, light, and seasonal differences will be at a distinct disadvantage to those who have studied these scientific factors.
In the fishing world, there is no miracle GPS device that will guide fish onto your hook, and the same is true for stocks. No software package or technical pattern will be a panacea for profits, however having some type of scientific tool to assist in the identification of investment opportunities should be exploited to its fullest. For us at Sidoxia Capital Management (www.Sidoxia.com), our tool is called SHGR (pronounced “SUGAR”), or Sidoxia Holy Grail Ranking. The name was created tongue-in-cheek; however its purpose is crucial. Following a quantitative system like SHGR ensures that a healthy dosage of discipline and objectivity is factored into our investment decisions, so inherent biases do not creep into our process and detract from performance. Specifically, our proprietary SHGR model incorporates multiple factors, including valuation, growth, sentiment indicators, profitability, and other qualitative measurements.
Although we use a “Holy Grail” ranking system, the fact of the matter is there are none in existence – for fishermen or investors. Experience teaches us the best opportunities are found where few are looking, and if proper quantitative tools are integrated into a multi-pronged process, then you will be uniquely positioned to catch a big fish.
Wade W. Slome, CFA, CFP®
Plan. Invest. Prosper.
DISCLOSURE: Sidoxia Capital Management (SCM) and some of its clients hold positions in certain exchange traded funds (ETFs) and CMCSA, but at the time of publishing SCM had no direct position in BRKB, HNZ, HRL, UL, T, VZ, CAR, ZIP, AMR, LCC, ORCL, APKT, DELL, MSFT, RDSA, Repsol, ODP, OMX, HLF, BUD, STZ, GE, or any other security referenced in this article. No information accessed through the Investing Caffeine (IC) website constitutes investment, financial, legal, tax or other advice nor is to be relied on in making an investment or other decision. Please read disclosure language on IC Contact page.
Vice Tightens for Those Who Missed the Pre-Party

The stock market pre-party has come to an end. Yes, this is the part of the bash in which an exclusive group is invited to enjoy the fruits of the festivities before the mobs arrive. That’s right, unabated access to the nachos; no lines to the bathroom; and direct access to the keg. For those of us who were invited to the stock market pre-party (or crashed it on their own volition), the spoils have been quite enjoyable – about a +128% rebound for the S&P 500 index from the bottom of 2009, and a +147% increase in the NASDAQ Composite index over the same period (excluding dividends paid on both indexes).
Although readers of Investing Caffeine have received a personal invitation to the stock market pre-party since I launched my blog in early 2009, many have shied away, out of fear the financial market cops may come and break-up the party.
Rather than partake in stock celebration over the last four years, many have chosen to go down the street to the bond market party. Unlike the stock market party, the fixed-income fiesta has been a “major-rager” for more than three decades. However, there are a few signs that this party has gotten out-of-control. For example, crowds of investors are lined up waiting to squeeze their way into some bond indulgence; after endless noise, neighbors are complaining and the cops are on their way to shut the party down; and PIMCO’s Bill Gross has just jumped off the roof to do a cannon-ball into the pool.
Even though the stock-market pre-party has been a blast, stock prices are still relatively cheap based on historical valuation measurements, meaning there is still plenty of time for the party to roll on. How do we know the party has just started? After five years and about a half a trillion dollars hemorrhaging out of domestic funds (see Calafia Beach Pundit), there are encouraging signs that a significant number of party-goers are beginning to arrive to the party. More specifically, as it relates to stocks, a fresh $10 billion has flowed into domestic equity mutual funds during this January (see ICI chart below). This data is notoriously volatile, and can change dramatically from month-to-month, but if this month’s activity is any indication of a changing mood, then you better hurry to the stock party before the bouncer stops letting people in.
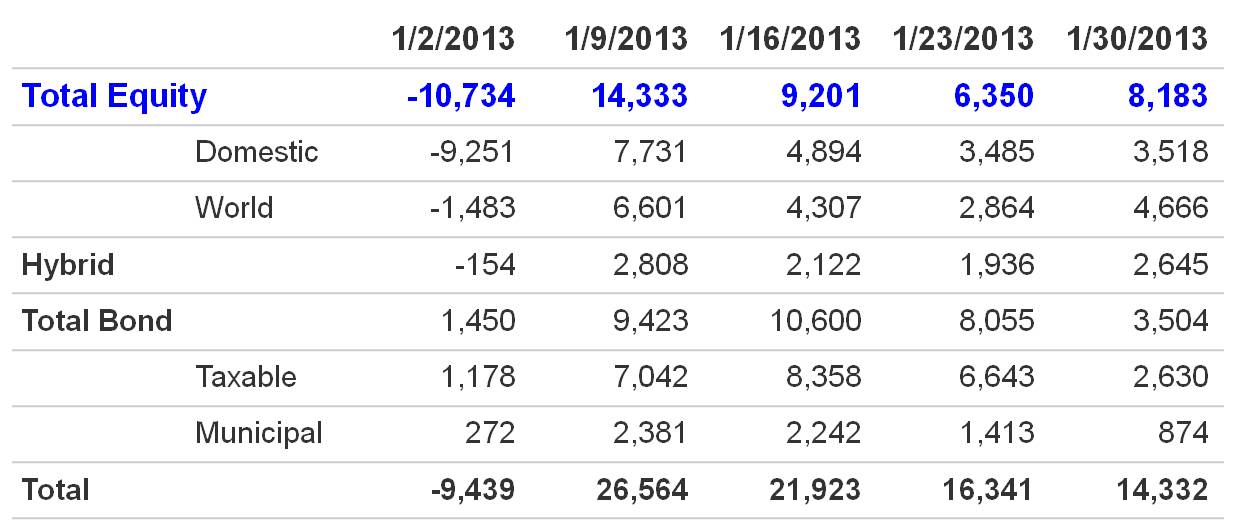
Source: Investment Company Institute (ICI)
Vice Begins to Tighten on Party Outsiders

Many stock market outsiders have either been squeezed into the bond market, hidden in cash, or hunkered down in a bunker with piles of gold. While some of these asset classes have done okay since early 2009, all have underperformed stocks, but none have performed worse than cash. For those doubters sitting on the equity market sidelines, the pain of the vice squeezing their portfolios has only intensified, especially as the economy and employment picture slowly improves (see chart below) and stock prices persist directionally upward. For years, fear-mongering stock skeptics have warned of an imploding dollar, exploding inflation, a run-away deficit/debt, a reckless money-printing Federal Reserve, and political gridlock. Nevertheless, none of these issues have been able to kill this equity bull market.
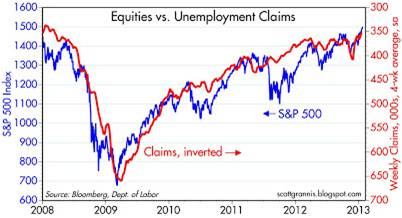
Source: Calafia Beach Pundit
But for those willing and able investors to enter the stock party today, one must realize this party will only get riskier over time. As we exit the pre-party and enter into the main event, you never know who may join the party, including some uninvited guests who may steal money, get sick on the carpet, participate in illegal activities, and/or ruin the fun by clashing with guests. We have already been forced to deal with some of these uninvited guests in recent years, including the “flash crash,” debt ceiling debate, European financial crisis, fiscal cliff, and lastly, sequestration is about to arrive as well (right after parking his car).
New investors can still objectively join the current equity party, but it is necessary to still be cognizant of not over-staying your welcome. However, for those party-pooping doubters who already missed the pre-party, the vice will continue to tighten, leaving stock cynics paralyzed as they watch additional missed opportunities enjoyed by the rest of us.
Wade W. Slome, CFA, CFP®
Plan. Invest. Prosper.
DISCLOSURE: Sidoxia Capital Management (SCM) and some of its clients hold positions in certain exchange traded funds (ETFs), but at the time of publishing SCM had no direct position in HLF, Japanese ETFs, or any other security referenced in this article. No information accessed through the Investing Caffeine (IC) website constitutes investment, financial, legal, tax or other advice nor is to be relied on in making an investment or other decision. Please read disclosure language on IC Contact page.
Risk of “Double-Rip” on the Rise
Okay, you heard it here first. I’m officially anointing my first new 2013 economic term of the year: “Double-Rip!” No, the biggest risk of 2013 is not a “double-dip” (the risk of the economy falling back into recession), but instead, the larger risk is of a double-rip – a sustained expansion of GDP after multiple quarters of recovery. I know, this sounds like heresy, given we’ve had to listen to perma-bears like Nouriel Roubini, Peter Schiff, John Mauldin, Mohamed El-Erian, Bill Gross, et al shovel their consistently wrong pessimism for the last 14 quarters. However, those readers who have followed me for the last four years of this bull market know where I’ve stood relative to these unwavering doomsday-ers. Rather than endlessly rehash the erroneous gospel spewed by this cautious clan, you can decide for yourself how accurate they’ve been by reviewing the links below and named links above:
Roubini calling for double-dip in 2012
Roubini calling for double-dip in 2011
Roubini calling for double-dip in 2010
Roubini calling for double-dip in 2009
If we switch from past to present, Bill Gross has already dug himself into a deep hole just two weeks into the year by tweeting equity markets will return less than 5% in 2013. Hmmm, I wonder if he’d predict the same thing now that the market is up about +4.5% during the first 18 days of the year?
Why Double-Rip Over Double-Dip?

How can stocks rip if economic growth is so sluggish? If forced to equate our private sector to a car, opinions would vary widely. We could probably agree the U.S. economy is no Ferrari. Faster growing countries like China, which recently reported 4th quarter growth of +7.9% (up from +7.4% in 3rd quarter), have lapped us complacent, right-lane driving Americans in recent years. But speed alone should not be investors’ only key objective. If speed was the number one priority, the only places investors would be placing their money would be in countries like Rwanda, Turkmenistan, and Libya (see Business Insider article). However, freedom, rule of law, and entrepreneurial spirit are other important investment factors to be considered. The U.S. market is more like a Toyota Camry – not very flashy, but it will reliably get you from point A to point B in an efficient and safe manner.
Beyond lackluster economic growth, corporate profit growth has slowed remarkably. In fact, with about 10% of the S&P 500 index companies reporting 4th quarter earnings thus far, earnings growth is expected to rise a measly 2.5% from a year ago (from a previous estimate of 3.0% growth). With this being the case, how can stock prices go up? Shrewd investors understand the stock market is a discounting mechanism of future fundamentals, and therefore stocks will move in advance of future growth. It makes sense that before a turn in the economy, the brakes will often be activated before accelerating into another fast moving straight-away.
In addition, valuation acts like shock absorbers. With generational low interest rates and a below-average forward 12-month P/E (Price-Earnings) ratio of 13x’s, this stock market car can absorb a significant amount of fundamental challenges. The oft quoted message that “In the short run, the market is a voting machine but in the long run it is a weighing machine,” from value icon Benjamin Graham holds as true today as it did a century ago. The recent market advance may be attributed to the voters, but long-term movements are ultimately tied to the sustainable scales of sales, earnings, and cash flows.
If that’s the case, how can someone be optimistic in the face of the slowing growth challenges of this year? What 2013 will not have is the drag of election uncertainty, the fiscal cliff, Superstorm Sandy, and an end-of-the-world Mayan calendar concern. This is setting the stage for improved fundamentals as we progress deeper into the year. Certainly there will be other puts and takes, but the absence of these factors should provide some wind under the economy’s sails.
What’s more, history shows us that indeed stock prices can go up quite dramatically (more than +325% during the 1990s) when consensus earnings forecasts continually get trimmed. We have seen this same dynamic since mid-2012 – earnings forecasts have come down and stock prices have gone up. Strategist Ed Yardeni captures this point beautifully in a recent post on his Dr. Ed’s Blog (see charts below).
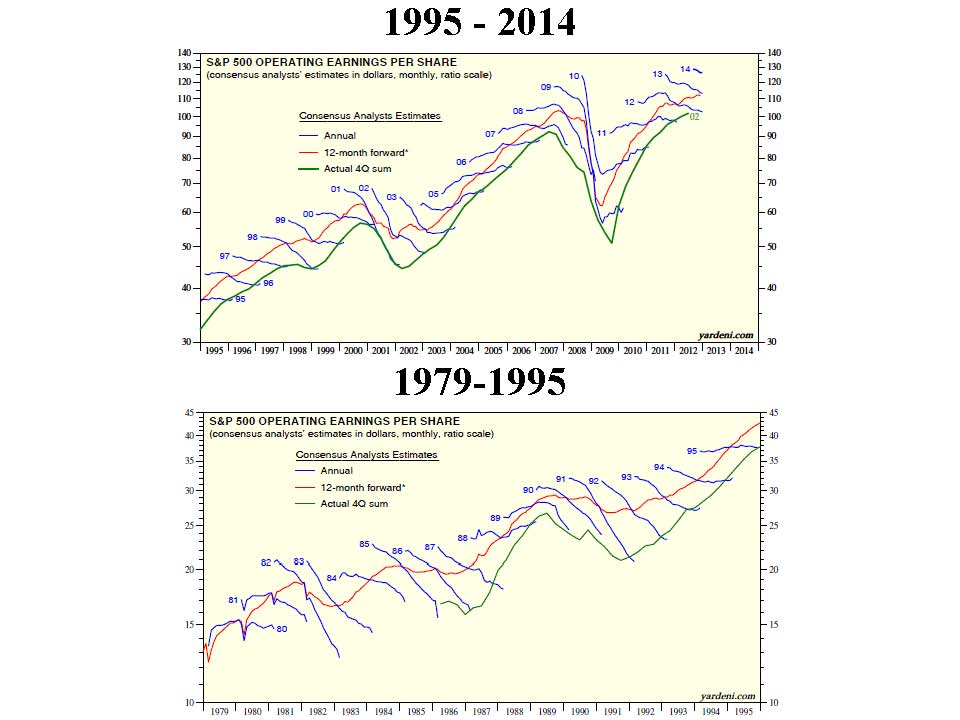
CLICK TO ENLARGE – Source: Dr. Ed’s Blog
What Will Make Me Bearish?
Am I a perma-bull, incessantly wearing rose-colored glasses that I refuse to take off? I’ll let you come to your own conclusion. When I see a combination of the following, I will become bearish:
#1. I see the trillions of dollars parked in near-0% cash start coming outside to play.
#2. See Pimco’s Bill Gross and Mohammed El-Erian on CNBC fewer than 10 times per week.
#3. See money flow stop flooding into sub-3% bonds (Scott Grannis) and actually reverse.
#4. Observe a sustained reversal in hemorrhaging of equity investments (Scott Grannis).
#5. Yield curve flattens dramatically or inverts.
#6. Nouriel and his bear buds become bullish and call for a “triple-rip” turn in the equity markets.
#7. Smarter, more-experienced investors than I, á la Warren Buffett, become more cautious. I arrogantly believe that will occur in conjunction with some of the previously listed items.
Despite my firm beliefs, it is evident the bears won’t go down without a fight. If you are getting tired of drinking the double-dip Kool-Aid, then perhaps it’s time to expand your bullish horizons. If not, just wait 12 months after a market rally, and buy yourself a fresh copy of the Merriam-Webster dictionary. There you can locate and learn about a new definition…double-rip!
Read Also: Double-Dip Guesses are “Probably Wrong”
Wade W. Slome, CFA, CFP®
Plan. Invest. Prosper.
DISCLOSURE: Sidoxia Capital Management (SCM) and some of its clients hold positions in certain exchange traded funds (ETFs), but at the time of publishing SCM had no direct position in Fiat, Toyota, or any other security referenced in this article. No information accessed through the Investing Caffeine (IC) website constitutes investment, financial, legal, tax or other advice nor is to be relied on in making an investment or other decision. Please read disclosure language on IC Contact page.
Sleeping Through Bubbles and Decade Long Naps

We have lived through many investment bubbles in our history, and unfortunately most investors sleep through the early wealth-creating inflation stages. Typically, the average investor wakes up later to a hot idea once every man, woman, and child has identified the clear trend…right as the bubble is about burst. Sadly, the masses do a great job of identifying financial bubbles at the end of a cycle, but have a tougher time realizing the catastrophic consequences of exiting a tired winner. Or as strategist Jim Stack states, “Bubbles, for the most part, are invisible to those trapped inside the bubble.” The challenge of recognizing bubbles explains why they are more easily classified as bubbles after a colossal collapse occurs. For those speculators chasing a precise exit point on a bubblicious investment, they may be better served by waiting for the prick of the bubble, then take a decade long nap before revisiting the fallen angel investment idea.
Even for the minority of pundits and investors who are able to accurately identify these financial bubbles in advance, a much smaller number of these professionals are actually able to pinpoint when the bubble will burst. Take for example Alan Greenspan, the ex-Federal Reserve Chairman from 1987 to 2006. He managed to correctly identify the technology bubble in late-1996 when he delivered his infamous “irrational exuberance” speech, which questioned the high valuation of the frothy, tech-driven stock market. The only problem with Greenspan’s speech was his timing was massively off. Stated differently, Greenspan was three years premature in calling out the pricking of the bubble, as the NASDAQ index subsequently proceeded to more than triple from early 1997 to early 2000 (the index exploded from about 1,300 to over 5,000).
One of the reasons bubbles are so difficult to time during their later stages is because the deflation period occurs so quickly. As renowned value investor Howard Marks fittingly notes, “The air always goes out a lot faster than it went in.”
Bubbles, Bubbles, Everywhere
Financial bubbles do not occur every day, but thanks to the psychological forces of investor greed and fear, bubbles do occur more often than one might think. As a matter of fact, famed investor Jeremy Grantham claims to have identified 28 bubbles in various global markets since 1920. Definitions vary, but Webster’s Dictionary defines a financial bubble as the following:
A state of booming economic activity (as in a stock market) that often ends in a sudden collapse.
Although there is no numerical definition of what defines a bubble or collapse, the financial crisis of 2008 – 2009, which was fueled by a housing and real estate bubble, is the freshest example in most people minds. However, bubbles go back much further in time – here are a few memorable ones:
Dutch Tulip-Mania: Fear and greed have been ubiquitous since the dawn of mankind, and those emotions even translate over to the buying and selling of tulips. Believe it or not, some 400 years ago in the 1630s, individual Dutch tulip bulbs were selling for the same prices as homes ($61,700 on an inflation adjusted basis). This bubble ended like all bubbles, as you can see from the chart below.

Source: The Stock Market Crash.net
British Railroad Mania: In the mid-1840s, hundreds of companies applied to build railways in Britain. Like all bubbles, speculators entered the arena, and the majority of companies went under or got gobbled up by larger railway companies.
Roaring 20s: Here in the U.S., the Roaring 1920s eventually led to the great Wall Street Crash of 1929, which finally led to a nearly -90% plunge in the Dow Jones Industrial stock index over a relatively short timeframe. Leverage and speculation were contributors to this bust, which resulted in the Great Depression.
Nifty Fifty: The so-called Nifty Fifty stocks were a concentrated set of glamour stocks or “Blue Chips” that investors and traders piled into. The group of stocks included household names like Avon (AVP), McDonald’s (MCD), Polaroid, Xerox (XRX), IBM and Disney (DIS). At the time, the Nifty Fifty were considered “one-decision” stocks that investors could buy and hold forever. Regrettably, numerous of these hefty priced stocks (many above a 50 P/E) came crashing down about 90% during the1973-74 period.
Japan’s Nikkei: The Japanese Nikkei 225 index traded at an eye popping Price-Earnings (P/E) ratio of about 60x right before the eventual collapse. The value of the Nikkei index increased over 450% in the eight years leading up to the peak in 1989 (from 6,850 in October 1982 to a peak of 38,957 in December 1989).

Source: Thechartstore.com
The Tech Bubble: We all know how the technology bubble of the late 1990s ended, and it wasn’t pretty. PE ratios above 100 for tech stocks was the norm (see table below), as compared to an overall PE of the S&P 500 index today of about 14x.

Source: Wall Street Journal – March 14, 2000
The Next Bubble
What is/are the next investment bubble(s)? Nobody knows for sure, but readers of Investing Caffeine know that long-term bonds are one fertile area. Given the generational low in yields and rates, and the near doubling of long-term Treasury prices over the last twelve years, it can be difficult to justify heavy allocations of inflation losing bonds for long time-horizon investors. Gold, another asset class that has increased massively in price (over 6-fold rise since about 2000) and attracted swaths of speculators, is another target area. However, as we discussed earlier, timing bubble bursts is extremely challenging. Nevertheless, the great thing about long-term investing is that probabilities and valuations ultimately do matter, and therefore a diversified portfolio skewed away from extreme valuations and speculative sectors will pay handsome dividends over the long-run.
Many traders continue to daydream as they chase performance through speculative investment bubbles, looking to squeeze the last ounce of an easily identifiable trend. As the lead investment manager at Sidoxia Capital Management, I spend less time sucking the last puff out of a cigarette, and spend more time opportunistically devoting resources to less popular growth trends. As demonstrated with historical examples, following the trend du jour eventually leads to financial ruin and nightmares. Avoiding bubbles and pursuing fairly priced growth prospects is the way to achieve investment prosperity…and provide sweet dreams.
Wade W. Slome, CFA, CFP®
Plan. Invest. Prosper.
DISCLOSURE: Sidoxia Capital Management (SCM) and some of its clients hold positions in certain exchange traded funds (ETFs) and are short TLT, but at the time of publishing SCM had no direct positions in AVP, MCD, XRX, IBM, DIS, or any other security referenced in this article. No information accessed through the Investing Caffeine (IC) website constitutes investment, financial, legal, tax or other advice nor is to be relied on in making an investment or other decision. Please read disclosure language on IC Contact page.
Equity Quicksand or Bond Cliff?

The markets are rigged, the Knight Capital Group (KCG) robots are going wild, and the cheating bankers are manipulating Libor. I guess you might as well pack it in…right? Well, maybe not. While mayhem continues, equity markets stubbornly grind higher. As we stand here today, the S&P 500 is up approximately +12% in 2012 and the NASDAQ market index has gained about +16%? Not bad when you consider 15 countries are offering negative yields on their bonds…that’s right, investors are paying to lose money by holding pieces of paper until maturity. As crazy as buying technology companies in the late 1990s for 100x’s or 200x’s earnings sounds today, just think how absurd negative yields will sound a decade from now? For heaven’s sake, buying a gun and stuffing money under the mattress is a cheaper savings proposition.
Priced In, Or Not Priced In, That is the Question?
So how can stocks be up in double digit percentage terms when we face an uncertain U.S. presidential election, a fiscal cliff, unsustainable borrowing costs in Spain, and S&P 500 earnings forecasts that are sinking like a buried hiker in quicksand (see chart below)?
I guess the answer to this question really depends on whether you believe all the negative news announced thus far is already priced into the stock market’s below average price-earnings (P/E) ratio of about 12x’s 2013 earnings. Or as investor Bill Miller so aptly puts it, “The question is not whether there are problems. There are always problems. The question is whether those problems are already fully discounted or not.”

Source: Crossing Wall Street
While investors skeptically debate how much bad news is already priced into stock prices, as evidenced by Bill Gross’s provocative “The Cult of Equity is Dying” article, you hear a lot less about the nosebleed prices of bonds. It’s fairly evident, at least to me, that we are quickly approaching the bond cliff. Is it possible that we can be entering a multi-decade, near-zero, Japan-like scenario? Sure, it’s possible, and I can’t refute the possibility of this extreme bear argument. However with global printing presses and monetary stimulus programs moving full steam ahead, I find it hard to believe that inflation will not eventually rear its ugly head.
Again, if playing the odds is the name of the game, then I think equities will be a better inflation hedge than most bonds. Certainly, not all retirees and 1%-ers should go hog-wild on equities, but the bond binging over the last four years has been incredible (see bond fund flows).
While we may sink a little lower into the equity quicksand while the European financial saga continues, and trader sentiment gains complacency (Volatility Index around 15), I’ll choose this fate over the inevitable bond cliff.
Wade W. Slome, CFA, CFP®
Plan. Invest. Prosper.
DISCLOSURE: Sidoxia Capital Management (SCM) and some of its clients own certain exchange traded funds, but at the time of publishing SCM had no direct position in KCG or any other security referenced in this article. No information accessed through the Investing Caffeine (IC) website constitutes investment, financial, legal, tax or other advice nor is to be relied on in making an investment or other decision. Please read disclosure language on IC “Contact” page.
Digesting the Anchovy Pizza Market

Source: Photobucket
Article is an excerpt from previously released Sidoxia Capital Management’s complementary July 2012 newsletter. Subscribe on right side of page.
I love pizza, and most fellow connoisseurs have difficulty refusing a hot, fresh slice of heaven too. Pizza is so universally appreciated that people consider pizza like ice cream – it’s good even when it’s bad (I agree). However, even the biggest, diehard pizza-lover will sheepishly admit their fondness for the flat and circular cheesy delight changes when you integrate anchovies into the mix. Not many people enjoy salty, slimy, marine creatures layered onto their doughy mozzarella and marinara pizza paradise.
With all the turmoil and uncertainty going on in the global financial markets, prudently investing in a widely diversified portfolio, including a broad range of equity securities, is viewed as palatable as participating in an all-you-can-eat anchovy pizza contest. Why are investors’ appetites so salty now? Hmmm, let me think. Oh yes, here are a few things that come to mind:
- Presidential Election Uncertainty
- European Financial Crisis
- Impending Fiscal Cliff (tax cut expirations, automatic spending cuts, termination of stimulus, etc.)
- Unsustainable Fiscal Debt & Deficits
- Slowing Subpar Domestic Economic Growth
- Partisan Politics and Gridlock in Washington
- High Unemployment
- Fears of a Hard Economic Landing in China
Doesn’t sound too appealing, does it? So, what are most investors doing in this unclear market? Rather than feasting on a pungent pie of anchovies, investors are flocking to the perceived safety of low yielding asset classes, no matter the price. In other words, the short-term warmth and comfort of CDs, money market, checking, and fixed income assets are being gobbled up like nicotine-laced pepperoni pizzas selling for $29.95/each + tax. The anchovy alternative, like stocks, is much more attractively priced now. After accounting for dividends, earnings, and cash flows, the anchovy/stock option is currently offering a 2-for-1 special with breadsticks and a salad…quite the bargain!
Nonetheless, the plain and expensive pepperoni/bond option remains the choice du jour and there are no immediate signs of a pepperoni hangover just quite yet. However, this risk aversion addiction cannot last forever. The bond gorging buffet has gone on relatively unabated for the last three decades, as you can see from the chart below. In spite of this, the bond binging game is quickly approaching a mathematical terminal end-game, as interest rates cannot logically go below zero.

Source: Calafia Beach Pundit with Sidoxia comments
Since my firm (Sidoxia Capital Management) is based in Newport Beach, next to PIMCO’s global headquarters, we get to follow the progression of the bond binging game firsthand. I’ve personally learned that if I manage close to $2 trillion in assets under management, I too can construct a 23-story Taj Mahal-esque headquarters that overlooks the Pacific Ocean from a stones-throw away.
Beyond glorified headquarters, there is evidence of other low-risk appetite examples. Here are some reinforcing pictures:
The Bond Binge

Source (The Financial Times): Bond purchases have exploded in the last three years.
Cash Hoarding

Source (Calafia Beach Pundit): Stuffing money under the mattress has accelerated in recent years as fear, uncertainty, and doubt have reigned supreme.
The Anchovy Special
Even though anchovy pizza, or a broadly diversified portfolio across asset class, size, geography, and style may not sound appealing, there are plenty of reasons to fight the urges of caving to fear and skepticism. Here are a few:
1) Growth Rolls On: Despite the aforementioned challenges occurring domestically and abroad, growth has continued unabated for 11 consecutive quarters, albeit at a rate less than desired. We are not immune to global recessionary forces, but regardless of European forces, the U.S. has been resilient in its expansion.

Source: Calafia Beach Pundit
2) Jobs and Housing on the Upswing: Unemployment remains high, but our country has experienced 27 consecutive months of private creation, leading to more than 4 million new jobs being added to our workforce. As you can see from the clear longer-term downward trend in unemployment claims, we are moving in the right direction.

Source: Calafia Beach Pundit
3) Eurozone Slowly Healing its Wounds: The Greek political and fiscal soap opera is grabbing all the headlines, but quietly in the background there are signs that the eurozone is slowly healing the wounds of the financial crisis. If you look at the 2-year borrowing costs of Europe’s troubled countries (ex-Greece), there is an unambiguous and beneficial decline. There is no doubt that Spain and Italy play a larger role than Portugal and Ireland, but at least some seeds of change have been planted for optimism.

Source: Calafia Beach Pundit
4) Record Corporate Profits: Investors are not the only people reading uncertain newspaper headlines and watching CNBC business television. CEOs are reading the same gloomy sensationalistic stories, and as a result, corporations have been cautious about dipping their short arms into their deep pockets. Significant expense reductions and a reluctance to hire have led to record profits and cash hoards. As evidenced by the chart below, profits continue to rise, and these earnings are being applied to shareholder friendly uses like dividends, share buybacks, and accretive acquisitions.

Source: Yardeni.com
5) Attractive Valuations (Pricing): We have already explored the lofty prices surrounding bonds and $30 pepperoni pizzas, but counter-intuitively, stock prices are trading at a discount to historical norms, despite record low interest rates. All else equal, an investor should pay higher prices for stocks when interest rates are at a record low (and vice versa), but currently we are seeing the opposite dynamic occur.

Source: Calafia Beach Pundit
Even though the financial markets may look, smell, and taste like an anchovy pizza, the price, value, and return benefits may outweigh the fishy odor. And guess what…anchovies are versatile. If you don’t like them on your pizza, you can always take them off and put them on your Caesar salad or use them for bait the next time you go fishing. The gloom-filled headlines haven’t been spectacular, but if they were, the return opportunities would be drastically reduced. Therefore you are much better off by following investor legend Warren Buffett’s advice, which is to “buy fear and sell greed.”
Investing has never been more difficult with record low interest rates, and it has also never been more important. Excluding a small minority of late retirees and wealthy individuals, efficiently investing your retirement dollars has become even more critical. The safety nets of Social Security and Medicare are likely to be crippled, which will require better and more prudent investing by individuals. Inflation relating to food, energy, healthcare, gasoline, and entertainment is dramatically eroding peoples’ nest eggs.
Digesting a pepperoni pizza may sound like the most popular and best option given the gloomy headlines and uncertain outlook, but if you do not want financial heartburn you may consider alternative choices. Like the healthier and less loved anchovy pizza, a more attractively valued strategy based on a broadly diversified portfolio across asset class, size, geography, and style may be the best financial choice to satiate your long-term financial goals.
Wade W. Slome, CFA, CFP®
Plan. Invest. Prosper.
DISCLOSURE: Sidoxia Capital Management (SCM) and some of its clients own certain exchange traded funds, but at the time of publishing SCM had no direct position in any other security referenced in this article. No information accessed through the Investing Caffeine (IC) website constitutes investment, financial, legal, tax or other advice nor is to be relied on in making an investment or other decision. Please read disclosure language on IC “Contact” page.
Broken Record Repeats Itself

Article is an excerpt from previously released Sidoxia Capital Management’s complementary June 2012 newsletter. Subscribe on right side of page.
Traditional music records have been replaced with CDs (compact discs) and digital downloads. Although the problem of a broken record repeating itself is no longer an issue, our financial markets have not conquered the problem of repetition. More specifically, the timing of the -6.3% stock market decline during May (as measured by the S&P 500 index), coincides with the same broken sell-offs we have temporarily experienced over the last two summers. First, we had the “Flash Crash” in the summer of 2010, and then the debt ceiling debate and credit downgrade of 2011.
So far, the “Sell in May and go away” mantra has followed the textbook lessons over the last few years, but as you can see from the chart below, the short-lived seasonal sell-offs have been followed by significant advances (up +33% from 2010 lows and up +29% from the 2011 lows). Given the global challenges, a two-steps forward, one-step back pattern in equity markets should not be seen as overly surprising by investors.

Source: Yahoo Finance
Although the late-spring and summer doldrums have not been a joy-ride in recent years, these overly simplistic seasonal trading rules of thumb have not been exceedingly reliable either. For example, even though the months of May in 2010-2012 produced negative returns, the previous 25 Mays going back to 1985 produced positive returns more than 2/3 of the time. Rather than fiddle with these unreliable, unscientific trading rules, individuals would be better served by listening to famous Jedi Master Yoda from Star Wars, who so astutely noted, “Uncertain, the future is.”
Voting Machines and Scales
Given the spread of globalization and technology, the speed of news dissemination has never been faster. With the 2008-2009 financial crisis still burned into investors’ minds, the default response to any scary news item is to shoot first and ask questions later. Renowned long-term investing legend Ben Graham famously highlighted, “In the short run the market is a voting machine. In the long run it’s a weighing machine.”
As it relates to short-run current events, here are some of the items that investors were voting on (no pun intended) this month:
Europe, Europe, Europe: This problem has been with us for some time now, and there are no signs it will disappear anytime soon. In a game of chicken between the EU (European Union) and Greek legislators, fresh elections are taking place on June 17th, which will ultimately determine if Greece will exit the Euro monetary union or stick to the bitter medicine of austerity prescribed by the key European decision-makers in Germany. As Greece attempts to clean up its own mess, European politicians and G-20 leaders around the globe are scrambling to create plans that ring-fence countries like Spain and Italy from succumbing to a Greek-born contagion.
Presidential Politics: If you haven’t been living in a cave for the last six months, you probably know that 2012 is a presidential election year. Regardless of your politics, there are big questions surrounding the economy, jobs, deficits, debt, taxes, entitlements, defense, gay marriage, and other important issues. Answers to many of these questions will remain unclear until we get closer to the elections. The financial markets do not like uncertainty, so probabilities would indicate volatility will remain par for the course for the foreseeable future.
Facebook Folly: Despite my warnings, Facebook’s initial public offering (IPO) failed to live up to the social media giant’s hype – the share price has fallen -22% since the shares originally priced. Great companies do not always make great stocks, especially when a relatively new kid on the block has his company’s stock initially valued at a hefty price-tag of more than a $100 billion. Finger pointing is being spread liberally on the botched Facebook deal (e.g., Morgan Stanley, NASDAQ, Facebook), but no need to shed a tear for 28-year-old founder Mark Zuckerberg since his ownership stake in the company is still valued at around $15 billion – enough to cover a European trip to McDonald’s with his newlywed wife.
Dimon in a Rough Spot: Jamie Dimon, the poster child of the banking industry (and CEO of JP Morgan Chase – JPM), dropped a bomb on the investment community earlier in the month by explaining how a rogue “whale” trader racked up $2 billion in initial losses (and growing) by taking excessive risk and throwing controls into the wind.
Chinese Dragon Losing Steam: The #2 global economy has been losing some steam as witnessed by slowing industrial production and GDP growth (Gross Domestic Product). In turn, the self correcting economic forces of supply and demand have provided relief to consumers and corporations in the form of lower fuel, energy, and commodity prices. Chinese leaders are not sitting still – there are plans of accelerating infrastructure spending and assisting banks in the form of capital injections and lower reserve requirements.
As I discussed in a previous Investing Caffeine article (see The European Dog Ate My Homework), although the current headlines remain gloomy, that will always be the case. Just a few years ago, Bear Stearns, Lehman Brothers, AIG, CDS (credit default swaps), and subprime mortgages were the boogeymen. In the 1980s, we had the Savings & Loan financial crisis and the infamous 1987 Crash. During the 1970s, the Vietnam War, Nixon’s impeachment proceedings, and rising inflation were the dominating issues. Since then, the equity markets are up over 20x-fold – time will always reward those patient long-term investors. Despite all the doom and gloom, stock markets have roughly doubled over the last three years and all the major indexes remain solidly in the black for the year. Choppy waters are likely to remain as we approach this year’s elections, but for those who understand broken records often repeat themselves, there’s a good chance the music will eventually sound much better.
Wade W. Slome, CFA, CFP®
Plan. Invest. Prosper.
DISCLOSURE: Sidoxia Capital Management (SCM) and some of its clients own certain exchange traded funds (including commodities, inflation protection, floating rate bonds, real estate, dividend, and alternative investment ETFs), but at the time of publishing SCM had no direct position in FB, MCD, JPM, MS, NDAQ, AIG, Lehman Brothers, Bear Stearns, or any other security referenced in this article. No information accessed through the Investing Caffeine (IC) website constitutes investment, financial, legal, tax or other advice nor is to be relied on in making an investment or other decision. Please read disclosure language on IC “Contact” page.


