Posts filed under ‘Financial Markets’
Why Buy at Record Highs? Ask the Fat Turkey

This article is an excerpt from a previously released Sidoxia Capital Management complementary newsletter (December 1, 2014). Subscribe on the right side of the page for the complete text.
I’ve fulfilled my American Thanksgiving duty by gorging myself on multiple helpings of turkey, mash potatoes, and pumpkin pie. Now that I have loosened my belt a few notches, I have had time to reflect on the generous servings of stock returns this year (S&P 500 index up +11.9%), on top of the whopping +104.6% gains from previous 5 years (2009-2013).
Conventional wisdom believes the Federal Reserve has artificially inflated the stock market. Given the perceived sky-high record stock prices, many investors are biting their nails in anticipation of an impending crash. The evidence behind the nagging investor skepticism can be found in the near-record low stock ownership statistics; dismal domestic equity fund purchases; and apathetic investor survey data (see Market Champagne Sits on Ice).
Turkey-lovers are in a great position to understand the predicted stock crash expected by many of the naysayers. As you can see from the chart below, the size of turkeys over the last 50+ years has reached a record weight – and therefore record prices per turkey:
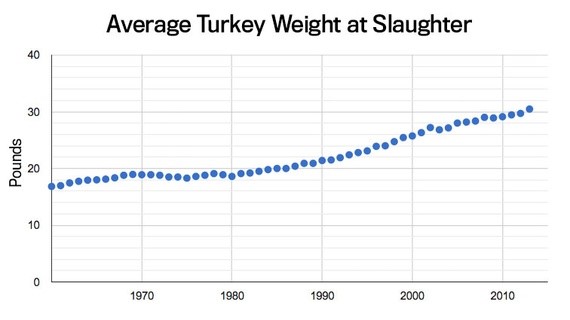
Source: The Atlantic
Does a record size in turkeys mean turkey meat prices are doomed for an imminent price collapse? Absolutely not. A key reason turkey prices have hit record levels is because Thanksgiving stomachs have been buying fatter and fatter turkeys every year. The same phenomenon is happening in the stock market. The reason stock prices have continued to move higher and higher is because profits have grown fatter and fatter every year (see chart below). Profits in corporate America have never been higher. CEOs are sitting on trillions of dollars of cash, and providing stock-investors with growing plump dividends (see also The Gift that Keeps on Giving), $100s of billions in shareholder friendly stock buybacks, while increasingly taking leftover profits to invest in growth initiatives (e.g., technology investments, international expansion, and job hiring).
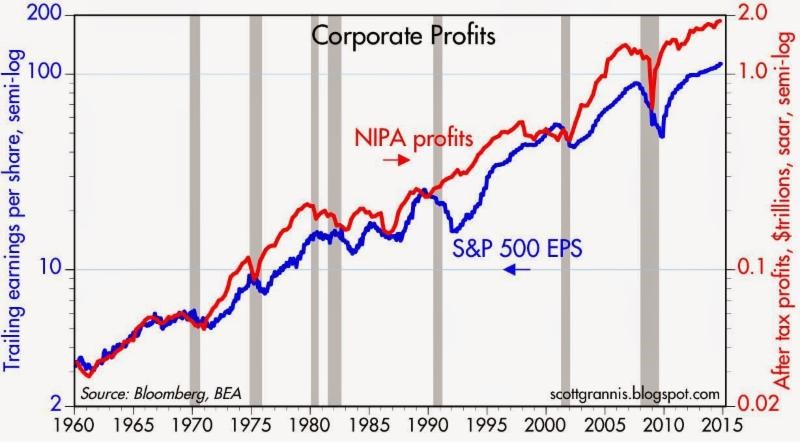
Source: Calafia Beach Pundit
Despite record turkey prices, I will make the bold prediction that hungry Americans will continue to buy turkey. More important than the overall price paid per turkey, the statistic that consumers should be paying more attention to is the turkey price paid per pound. Based on that more relevant metric, the data on turkey prices is less conclusive. In fact, turkey prices are estimated to be -13% cheaper this year on a per pound basis compared to last year ($1.58/lb vs. $1.82/lb).
The equivalent price per pound metric in the stock market is called the Price-Earnings (P/E) ratio, which is the price paid by a stock investor per $1 of profits (or earnings). Today that P/E ratio sits at approximately 17.5x. As you can see from the chart below, the current P/E ratio is reasonably near historical averages experienced over the last 50+ years. While, all else equal, anyone would prefer paying a lower price per pound (or price per $1 in earnings), any objective person looking at the current P/E ratio would have difficulty concluding recent stock prices are in “bubble” territory.
However, investor doubters who have missed the record bull run in stock market prices over the last five years (+210% since early 2009) have clung to a distorted, overpriced measurement called the CAPE or Shiller P/E ratio. Readers of my Investing Caffeine blog or newsletters know why this metric is misleading and inaccurate (see also Shiller CAPE Peaches Smell).
Don’t Be an Ostrich

While prices of stocks arguably remain reasonably priced for many Baby Boomers and retirees, the conclusion should not be to gorge 100% of investment portfolios into stocks. Quite the contrary. Everyone’s situation is unique, and every investor should customize a globally diversified portfolio beyond just stocks, including areas like fixed income, real estate, alternative investments, and commodities. But the exposures don’t stop there, because in order to truly have the diversified shock absorbers in your portfolio necessary for a bumpy long-term ride, investors need exposure to other areas. Such areas should include international and emerging market geographies; a diverse set of styles (e.g., Value, Growth, Blue Chip dividend-payers); and a healthy ownership across small, medium, and large equities. The same principles apply to your bond portfolio. Steps need to be taken to control credit risk and interest rate risk in a globally diversified fashion, while also providing adequate income (yield) in an environment of generationally low interest rates.
While I’ve spent a decent amount of time talking about eating fat turkeys, don’t let your investment portfolio become stuffed. The year-end time period is always a good time, after recovering from a food coma, to proactively review your investments. While most non-vegetarians love eating turkey, don’t be an investment ostrich with your head in the sand – now is the time to take actions into your own hands and make sure your investments are properly allocated.

Wade W. Slome, CFA, CFP®
Plan. Invest. Prosper.
DISCLOSURE: Sidoxia Capital Management (SCM) and some of its clients own a range of positions in certain exchange traded fund positions, but at the time of publishing SCM had no direct position in any other security referenced in this article. No information accessed through the Investing Caffeine (IC) website constitutes investment, financial, legal, tax or other advice nor is to be relied on in making an investment or other decision. Please read disclosure language on IC Contact page.
Fiscal Armageddon Greatly Exaggerated

Source: Photobucket
“The reports of my death are greatly exaggerated.”
-Mark Twain (after a relative’s illness was attributed to Twain)
The same can be said for the exaggerated death of the U.S. economy and stock market. Naysayers have been pounding a consistent stream of fatal economic theories for years as a positive set of broader metrics disassembled those arguments. Debt downgrades, debt defaults, and a domino of European country collapses were supposed to set our financial markets spiraling downwards out of control. That didn’t happen.
A large contributing component to our oversized debt burden was the massive federal, state, and local deficits. Consider the federal fiscal deficit that reached -$1.5 trillion during the 2008-09 Financial Crisis.
Many of the doom-and-gloomer pundits expected a deficit in the uber-trillion dollar range to last for as far as the eye could see, but perception didn’t turn out to be reality. Scott Grannis at Calafia Beach Pundit always does a superb job of summarizing this government related data (see chart below):
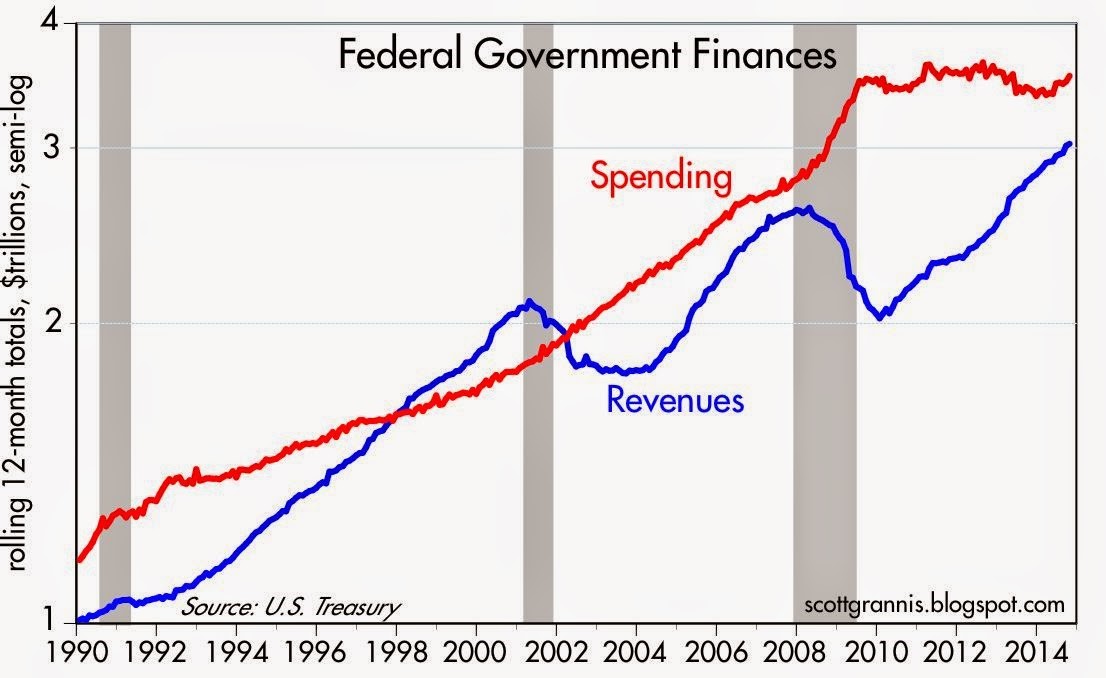
Source: Calafia Beach Pundit
All too often people confuse a secular trend vs. a cyclical move. The collapse in tax revenues during the 2008-2009 timeframe was not the result of some permanent shift in tax policy, but rather a function of a cyclical downturn, much like we have seen in prior recessions.
Extrapolating a short-term trend into a long-term trend is a common investor mistake (see Extrapolation Dangers). While the mean reversion in tax revenues came as a surprise to some, it was no bombshell for me. When the country axes 9 million private jobs and then both companies and consumers rein in spending due to depression fears, a subsequent reduction in tax receipts should not be a shock to market observers. On the flip side, it should then be no revelation that tax revenues will rise when 9 million+ jobs return and confidence rebounds.
We have talked about the shape of tax revenues/receipts, but what about the shape of spending? With all the gridlock occurring in Washington, Americans are fed up with the government’s inability to get anything done, which is evident by the near-record low approval rating of Congress. But as I have written before, not all the effects of gridlock are bad (see Who Said Gridlock is Bad?). What Grannis’s chart above shows is that gridlock has beneficially resulted in about five years of flat spending. Despite the spending stinginess, the slow and steady economic recovery has continued virtually unabated since 2009.
Looked at from a slightly different lens, you can see the deficit reached its worst point in 2009 at about -$1.5 trillion (-10% of GDP) – see chart below. Today, the deficit has almost been cut by 2/3rds to a level of -$0.5 billion (-2.8% of GDP). As you can see, the current deficit/GDP percentage is consistent with the average deficit levels experienced over the last 50 years.
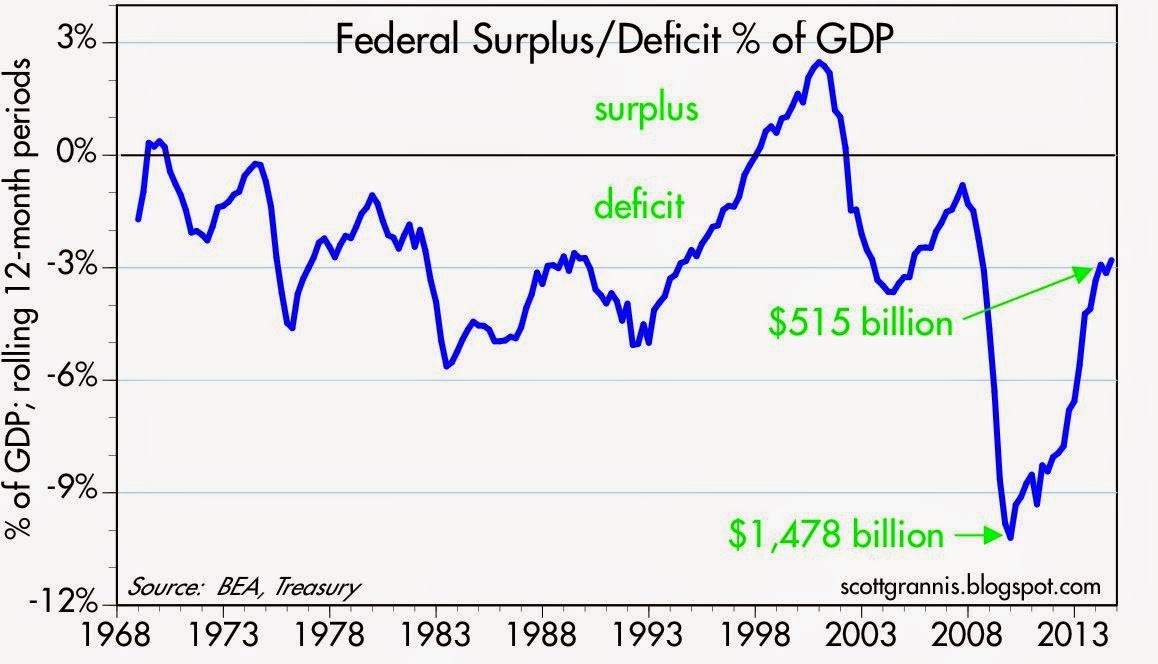
Source: Calafia Beach Pundit
Regardless of your political persuasion, investors are best served by not placing too much focus on what’s going on in Washington D.C. Equal blame and credit can be dispersed across Congress (Democrats & Republicans), the President, and the Federal Reserve. Exaggerating the death of the U.S. economy and stock market may sell more newspapers and advertising, but the resilience of capitalism and innovative spirit of American entrepreneurship has not and will not die.
Wade W. Slome, CFA, CFP®
Plan. Invest. Prosper.
DISCLOSURE: Sidoxia Capital Management (SCM) and some of its clients own a range of positions in certain exchange traded fund positions, but at the time of publishing SCM had no direct position in any other security referenced in this article. No information accessed through the Investing Caffeine (IC) website constitutes investment, financial, legal, tax or other advice nor is to be relied on in making an investment or other decision. Please read disclosure language on IC Contact page.
Sector Weightings: Another Financial Toolbox Gizmo

The ever-elusive $64,000 question of “Where does the stock market go from here?” is as popular a question today as it was a century ago. All you have to do is turn on CNBC to find an endless number of analysts, strategists, journalists, economists, and other talking heads guessing on the direction of stock prices. So many people are looking to make a quick buck or get a hot tip, but unfortunately investing is like dieting…it takes hard work and there are no simple solutions. As much as the pundits would like to make this investment game sound like a scientific certainty, in reality there is a lot of subjective art, experience, and luck that goes into successful investment outcomes. Consistent followers of Investing Caffeine understand there are a number of tools I use to guide me on the direction and level of stock prices, and three of my toolbox gizmos include the following:
- Earnings (Stock prices positively correlated)
- Interest Rates (Stock prices inversely correlated)
- Sentiment (Stock prices inversely correlated)
While these and other devices (see SHGR Holy Grail) are great for guesstimating the direction of longer-term stock prices, sector weightings are also great tools for identifying both overheated and unloved segments of the market. Take an extreme example, such as the S&P 500 Technology historical sector weighting in the year 2000. As you can see from the Bespoke Investment charts, the Technology sector went from about a 5% weighting of the overall market in the early 1990s to around 36% at the 2000 peak before dropping back down to 15% after the Tech Bubble burst. If you fast forward to the 2008-2009 Financial Crisis, we saw a similar “bubblicious” phenomenon rupture in the Financial sector. During 1980 the Financial segment accounted for approximately 5% of the total S&P 500 Index market capitalization in 1980 and skyrocketed to a peak of 23% in 2007, thanks in large part to a three decade bull-run in declining interest rates coupled with financial regulators asleep at the oversight switch.
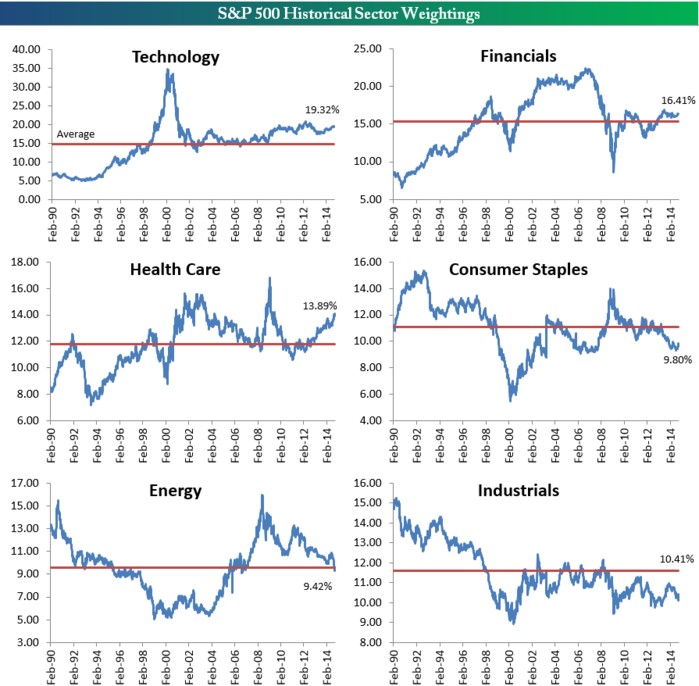
Source: Bespoke Investment
While some segment weightings are currently above and below historical averages, the chart shows there is a tendency for mean reversion to occur over time. As I’ve written in the past, while I believe the broader market can be objectively be interpreted as reasonably priced in light of record earnings, record low interest rates, and a broader skeptical investing public ( see Markets Soar and Investors Snore), I’m still finding expensive, frothy sub-sectors in areas like money losing biotech and social media companies. The reverse can be said if you examined the 2000 period – the overall stock market was overpriced at its 3/24/00 peak (P/E ratio of about ~31x), but within the S&P 500 stocks there were bargains of a lifetime if you looked outside the Tech sector. Consider many of the unloved “Old Economy” stocks that got left behind in the 1990s. Had you invested in these forgotten stocks at the peak of the 2000 market (March 24, 2000), you would have earned an equal-weighted average return of +430% (and significantly higher than that if you included dividends):
Caterpillar Inc (CAT): +416%
Deere & Co (DE): +367%
FedEx Corp (FDX): +341%
Ingersoll-Rand Co (IR): +260%
Lockheed Martin Corp (LMT): +811%
Three M Company (MMM): +254%
Schlumberger Ltd (SLB): +158%
Union Pacific Corp (UNP): +1,114%
Exxon Mobil Corp (XOM): +148%
Average +430%
That +430% compares to a much more modest +36% return for the S&P 500 over the same period. What this data underscores are the perils of pure index investing and highlights the room for active investment managers like Sidoxia Capital Management to generate alpha.
There are many ways of analyzing “Where does the stock market go from here?,” but whatever methods you use, the power of examining sector weightings and mean reversion gizmos should be readily accessible in your investment toolbox.
Wade W. Slome, CFA, CFP®
Plan. Invest. Prosper.
DISCLOSURE: Sidoxia Capital Management (SCM) and some of its clients own FDX; non-discretionary positions in DE, LMT, MMM, SLB, XOM, and a range of positions in certain exchange traded fund positions, but at the time of publishing SCM had no direct position in CAT, IR, UNP, or any other security referenced in this article. No information accessed through the Investing Caffeine (IC) website constitutes investment, financial, legal, tax or other advice nor is to be relied on in making an investment or other decision. Please read disclosure language on IC Contact page.
Scrapes on the Sidewalk

Baron Rothschild, an 18th century British nobleman and member of the Rothschild banking family, is credited with the investment advice to “buy when there’s blood in the streets.” Well, with the Russell 2000 correcting about -14% and the S&P 500 -8% from their 2014 highs, you may not be witnessing drenched, bloody streets, but you could say there has been some “scrapes on the sidewalk.”
Although the Volatility Index (VIX – a.k.a., “Fear Gauge”) reached the highest level since 2011 last week (31.06), the S&P 500 index still hasn’t hit the proverbial “correction” level yet. Even with some blood being shed, the clock is still running since the last -10% correction experienced during the summer of 2011 when the Arab Spring sprung and fears of a Greek exit from the EU was blanketing the airwaves. If investors follow the effective 5-year investment playbook, this recent market dip, like previous ones, should be purchased. Following this “buy-the-dip” mentality since the lows experienced in 2011 would have resulted in stock advancing about +75% in three years.
If you have a more pessimistic view of the equity markets and you think Ebola and European economic weakness will lead to a U.S. recession, then history would indicate investors have suffered about 50% of the pain. Your ordinary, garden-variety recession has historically resulted in about a -20% hit to stock prices. However, if you’re in the camp that we’re headed into another debilitating “Great Recession” as we experienced in 2008-2009, then you should brace for more pain and grab some syringes of Novocaine.
If you’re seriously considering some of these downside scenarios, wouldn’t it make sense to analyze objective data to bolster evidence of an impending recession? If the U.S. truly was on the verge of recession, wouldn’t the following dynamics likely be in place?
- Two quarters of consecutive, negative GDP (Gross Domestic Property) data
- Inverted yield curve
- Rising unemployment and mass layoff announcements
- Declining corporate profits
- Hawkish Federal Reserve
The reality of the situation is the U.S. economy continues to expand; the yield curve remains relatively steep and positive; unemployment declined to 5.9% in the most recent month; corporate profits are at record levels and continue to grow; and the Fed has communicated no urgency to raise short-term interest rates in the near future. While the current headlines may not be so rosy, and the Ebola, eurozone, and Chinese markets may be giving you heartburn, nevertheless, the stock market has steadily climbed a wall of market worry over the last five years.
As the great Peter Lynch stated (see also Inside the Brain of an Investing Genius), “Far more money has been lost by investors preparing for corrections, or trying to anticipate corrections, than has been lost in corrections themselves.” Stated differently, Value investor Seth Klarman noted, “We can predict 10 of the next two recessions,” which highlights pundits’ inabilities of accurately predicting the next downturn (see also 100-Year Flood ≠ 100-Day Flood). As Lynch also adds, rather than trying to time the market, it is better to “assume the market is going nowhere and invest accordingly.”
Now may not be the time to dive into stocks headfirst, but many stocks have fallen -10%, -20%, and -30%, so it behooves long-term investors to take advantage of the correction. It’s true that buying when there is “blood in the streets” is an optimal strategy, but facts show this is a difficult strategy to execute. Rather than get greedy, long-term investors may be better served by opportunistically buying when there are “scrapes on the sidewalk.”
Wade W. Slome, CFA, CFP®
Plan. Invest. Prosper.
DISCLOSURE: Sidoxia Capital Management (SCM) and some of its clients hold positions in certain exchange traded funds (ETFs), but at the time of publishing SCM had no direct position in any other security referenced in this article. No information accessed through the Investing Caffeine (IC) website constitutes investment, financial, legal, tax or other advice nor is to be relied on in making an investment or other decision. Please read disclosure language on IC Contact page.
The Pain of Diversification

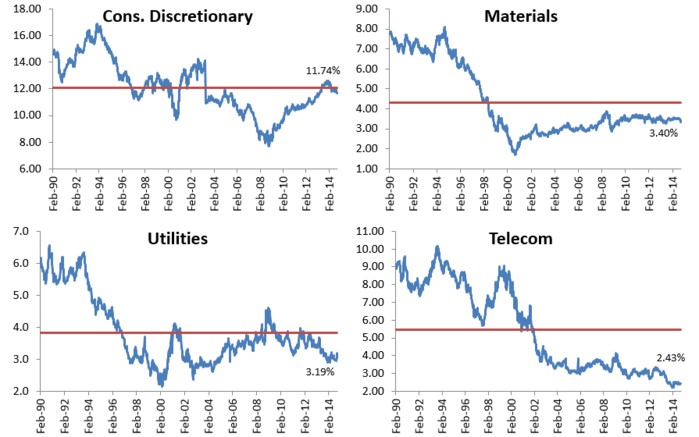
The oft-quoted tenet that diversification should be the cornerstone of any investment strategy has come under assault in the third quarter. As you can see from the chart below, investors could run, but they couldn’t hide. The Large Cap Growth category was the major exception, thanks in large part to Apple Inc.’s (AAPL) +8% appreciation. More specifically, seven out of the nine Russell Investments style boxes were in negative territory for the three month period. The benefits of diversification look even worse, if you consider other large asset classes and sectors such as the Gold/Gold Miners were down about -14% (GDX/GLD); Energy -9% (XLE); Europe-EAFE -6% (EFA); Utilities -5% (XLU); and Emerging Markets -4% (EEM).
*Results are for Q3 – 2014 (Source: Vanguard Group, Inc. & Russell Investments)
On the surface, everything looks peachy keen with all three major indices posting positive Q3 appreciation of +1.3% for the Dow, +0.6% for S&P 500, and +1.9% for the NASDAQ. It’s true that over the long-run diversification acts like shock absorbers for economic potholes and speed bumps, but in the short-run, all investors can hit a stretch of rough road in which shock absorbers may seem like they are missing. Over the long-run, you can’t live without diversification shocks because your financial car will eventually breakdown and the ride will become unbearable.
What has caused all this underlying underperformance over the last month and a half? The headlines and concerns change daily, but the -5% to -6% pullback in the market has catapulted the Volatility Index (VIX or “Fear Gauge”) by +85%. The surge can be attributed to any or all of the following: a slowing Chinese economy, stagnant eurozone, ISIS in Iraq, bombings in Syria, end of Quantitative Easing (QE), impending interest rate hikes, mid-term elections, Hong Kong protests, proposed tax inversion changes, security hacks, rising U.S. dollar, PIMCO’s Bill Gross departure, and a half dozen other concerns.
In general, pullbacks and corrections are healthy because shares get transferred out of weak hands into stronger hands. However, one risk associated with these 100 day floods (see also 100-Year Flood ≠ 100-Day Flood) is that a chain reaction of perceptions can eventually become reality. Or in other words, due to the ever-changing laundry list of concerns, confidence in the recovery can get shaken, which in turn impacts CEO’s confidence in spending, and ultimately trickles down to employees, consumers, and the broader economy. In that same vein, George Soros, the legendary arbitrageur and hedge fund manager, has famously written about his law of reflexivity (see also Reflexivity Tail Wags Dog). Reflexivity is based on the premise that financial markets continually trend towards disequilibrium, which is evidenced by repeated boom and bust cycles.
While, at Sidoxia, we’re still finding more equity opportunities amidst these volatile markets, what this environment shows us is conventional wisdom is rarely correct. Going into this year, the consensus view regarding interest rates was the economy is improving, and the tapering of QE would cause interest rates to go significantly higher. Instead, the yield on the 10-Year Treasury Note has gone down significantly from 3.0% to 2.3%. The performance contrast can be especially seen with small cap stocks being down-10% for the year and the overall Bond Market (BND) is up +3.1% (and closer to +5% if you include interest payments). Despite interest rates fluctuating near generational lows with paltry yields, the power of diversification has proved its value.
While there are multiple dynamics transpiring around the financial markets, the losses across most equity categories and asset classes during Q3 have been bloody. Nonetheless, investing across the broad bond market and certain large cap stock segments is evidence that diversification is a valuable time-tested principle. Times like these highlight the necessity of diversification gain to offset the current equity pain.
Wade W. Slome, CFA, CFP®
Plan. Invest. Prosper.
DISCLOSURE: Sidoxia Capital Management (SCM) and some of its clients hold positions in AAPL, BND, and certain exchange traded funds (ETFs), but at the time of publishing SCM had no direct position in EEM, GDX, GLD, EFA, XLE, XLU, or any other security referenced in this article. No information accessed through the Investing Caffeine (IC) website constitutes investment, financial, legal, tax or other advice nor is to be relied on in making an investment or other decision. Please read disclosure language on IC Contact page.
Time for Your Retirement Physical

This article is an excerpt from a previously released Sidoxia Capital Management complementary newsletter (October 1, 2014). Subscribe on the right side of the page for the complete text.
As a middle-aged man, I’ve learned the importance of getting my annual physical to improve my longevity. The same principle applies to the longevity of your retirement account. With the fourth quarter of the calendar year officially underway, there is no better time to probe your investment portfolio and prescribe some recommendations relating to your financial goals.
A physical is especially relevant given all the hypertension raising events transpiring in the financial markets during the third quarter. Although the large cap biased indexes (Dow Jones Industrials and S&P 500) were up modestly for the quarter (+1.3% and +0.6%, respectively), the small and mid-cap stock indexes underperformed significantly (-8.0% [IWM] and -4.2% [SPMIX], respectively). What’s more, all the daunting geopolitical headlines and uncertain macroeconomic data catapulted the Volatility Index (VIX – aka, “Fear Gauge”) higher by a whopping +40.0% over the same period.
- What caused all the recent heartburn? Pick your choice and/or combine the following:
- ISIS in Iraq
- Bombings in Syria
- End of Quantitative Easing (QE) – Impending Interest Rate Hikes
- Mid-Term Elections
- Hong Kong Protests
- Tax Inversions
- Security Hacks
- Rising U.S. Dollar
- PIMCO’s Bill Gross Departure
(See Hot News Bites in Newsletter for more details)
As I’ve pointed out on numerous occasions, there is never a shortage of issues to worry about (see Series of Unfortunate Events), and contrary to what you see on TV, not everything is destruction and despair. In fact, as I’ve discussed before, corporate profits are at record levels (see Retail Profits chart below), companies are sitting on trillions of dollars in cash, the employment picture is improving (albeit slowly), and companies are finally beginning to spend (see Capital Spending chart below):
Retail Profits

Source: Dr. Ed’s Blog
Capital Spending

Source: Calafia Beach Pundit
Even during prosperous times, you can’t escape the dooms-dayers because too much of a good thing can also be bad (i.e., inflation). Rather than getting caught up in the day-to-day headlines, like many of us investment nerds, it is better to focus on your long-term financial goals, diversification, and objective financial metrics. Even us professionals become challenged by sifting through the never-ending avalanche of news headlines. It’s better to stick with a disciplined, systematic approach that functions as shock absorbers for all the inevitable potholes and speed bumps. Investment guru Peter Lynch said it best, “Assume the market is going nowhere and invest accordingly.” Everyone’s situation and risk tolerance is different and changing, which is why it’s important to give your financial plan a recurring physical.
Vacation or Retirement?
Keeping up with the Joneses in our instant gratification society can be a taxing endeavor, but ultimately investors must decide between 1) Spend now, save later; or 2) Save now, spend later. Most people prefer the more enjoyable option (#1), however these individuals also want to retire at a young age. Often, these competing goals are in conflict. Unless, you are Oprah or Bill Gates (or have rich relatives), chances are you must get into the practice of saving, if you want a sizeable nest egg…before age 85. The problem is Americans typically spend more time planning their vacation than they do planning for retirement. Talking about finances with an advisor, spouse, or partner can feel about as comfortable as walking into a cold doctor’s office while naked under a thin gown. Vulnerability may be an undesirable emotion, but often it is a necessity to reach a desired goal.
Ignorance is Not Bliss – Avoid Procrastination
Many people believe “ignorance is bliss” when it comes to healthcare and finance, which we all know is the worst possible strategy. Normally, individuals have multiple IRA, 401(k), 529, savings, joint, trust, checking and other accounts scattered around with no rhyme or reason. As with healthcare, reviewing finances most often takes place whenever there is a serious problem or need, which is usually at a point when it’s too late. Unfortunately, procrastination typically wins out over proactiveness. Just because you may feel good, or just because you are contributing to your employer’s 401(k), doesn’t mean you shouldn’t get an annual physical for your health and finances. I’m the perfect example. While I feel great on the outside, ignoring my high cholesterol lab results would be a bad idea.
And even for the DIY-ers (Do-It-Yourself-ers), rebalancing your portfolio is critical. In the last fifteen years, overexposure to technology, real estate, financials, and emerging markets at the wrong times had the potential of creating financial ruin. Like a boat, your investment portfolio needs to remain balanced in conjunction with your goals and risk tolerance, or your savings might tip over and sink.
Financial markets go up and down, but your long-term financial well-being does not have to become hostage to the daily vicissitudes. With the fourth quarter now upon us, take control of your financial future and schedule your retirement physical.
Wade W. Slome, CFA, CFP®
Plan. Invest. Prosper.
DISCLOSURE: Sidoxia Capital Management (SCM) and some of its clients hold positions in certain exchange traded funds (ETFs), but at the time of publishing SCM had no direct position in IWM, SPMIX, or any other security referenced in this article. No information accessed through the Investing Caffeine (IC) website constitutes investment, financial, legal, tax or other advice nor is to be relied on in making an investment or other decision. Please read disclosure language on IC Contact page.
Mathematics 101: The Cheap Money Printing Machine

Like many other bloggers and pundits, I have amply pontificated on the relative attractiveness of the stock market. For years, cash and gold hoarding bears have clung to the distorted, money-losing Shiller CAPE P/E ratio (see CAPE Smells Like B.S.), which has incorrectly signaled investors to stay out of stocks and miss trillions of dollars in price appreciation. Apparently, the ironclad Shiller CAPE device has been temporarily neutralized by the Federal Reserve’s artificially cheapening money printing press policies, just like Superman’s strength being stripped by the nullifying powers of kryptonite. The money printing logic seems so elegantly sound, I felt compelled to encapsulate this powerful relationship in an equation:
Interests Rate Cuts + Printing Press On = Stocks Go Higher
Wow, amazing…this is arithmetic any investor (or 3rd grader) could appreciate! Fortunately for me, I have a child in elementary school, so I became emboldened to share my new found silver bullet equation. I initially received a few raised eyebrows from my child when I introduced the phrase “Quantitative Easing” but it didn’t take long before she realized Rate Cuts + QE = Fat Piggy Bank.
After the intensive tutorial, I felt so very proud. With a smile on my face, I gave myself a big pat on the back, until I heard my child say, “Daddy, after looking at this squiggly S&P 500 line from 2007-2014, can you help my brain understand because I have some questions.”
Here is the subsequent conversation:
Me: “Sure kiddo, go ahead shoot…what can I answer for you?”
Child: “Daddy, if the Federal Reserve is so powerful and you should “not fight the Fed,” how come stock prices went down by -58% from 2007 – 2009, even though the Fed cut rates from 5.25% to 0%?”
Me: “Uhhhh….”
Child: “Daddy, if stock prices went down so much after massive rate cuts, does that mean stock prices will go up when the Fed increases rates?”
Me: “Uhhhh….”
Child: “Daddy, if Quantitative Easing is good for stock prices, how come after the QE1 announcement in November 2008, stock prices continued to go down -25%?”
Me: “Uhhhh….”
Child: “Daddy, if QE makes stocks go up, how come stock prices are at all-time record highs after the Fed has cut QE by -$70 billion per month and is completely stopping QE by 100% next month?”
Me: “Uhhhh….”
Child: “Daddy, everyone is scared of rate increases but when the Fed increased interest rates by 250 basis points in 1994, didn’t stock prices stay flat for the year?”
Me: “Uhhhh….” (See also 1994 Bond Repeat)
What started as a confident conversation about my bullet-proof mathematical equation ended up with me sweating bullets.
Math 101A: Low Interest Rates = Higher Asset Prices
As my previous conversation highlights, the relationship between rate cuts and monetary policy may not be as clear cut as skeptics would like you to believe. Although I enjoy the widely covered Shiller CAPE discussions on market valuations, somehow the media outlets fail to make the all-important connection between interest rates and P/E ratios.
One way of framing the situation is by asking a simple question:
Would you rather have $100 today or $110 a year from now?
The short answer is…”it depends.” All else equal, the level of interest rates will ultimately determine your decision. If interest rates are offering 20%, a rational person would select the $100 today, invest the money at 20%, and then have $120 a year from now. On the other hand, if interest rates were 0.5%, a rational person would instead select the option of receiving $110 a year from now because collecting a $100 today and investing at 0.5% would only produce $100.50 a year from now.
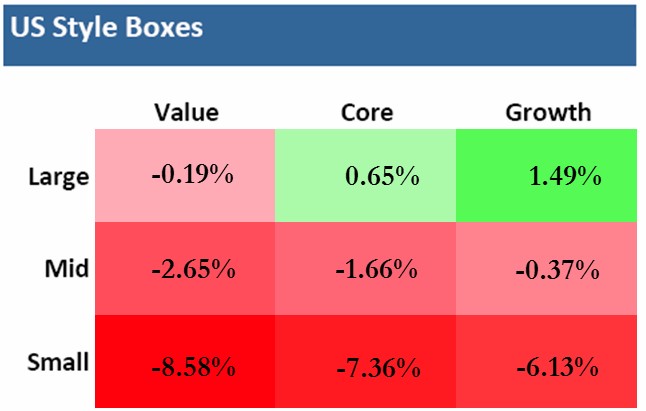
The same time-value-of-money principle applies to any asset, whether you are referring to gold, cars, houses, private businesses, stocks, or other assets. The mathematical fact is, all else equal, a rational person will always pay more for an asset when interest rates are low, and pay less when interest rates are high. As the 200-year interest chart below shows, current long-term interest rates are near all-time lows.
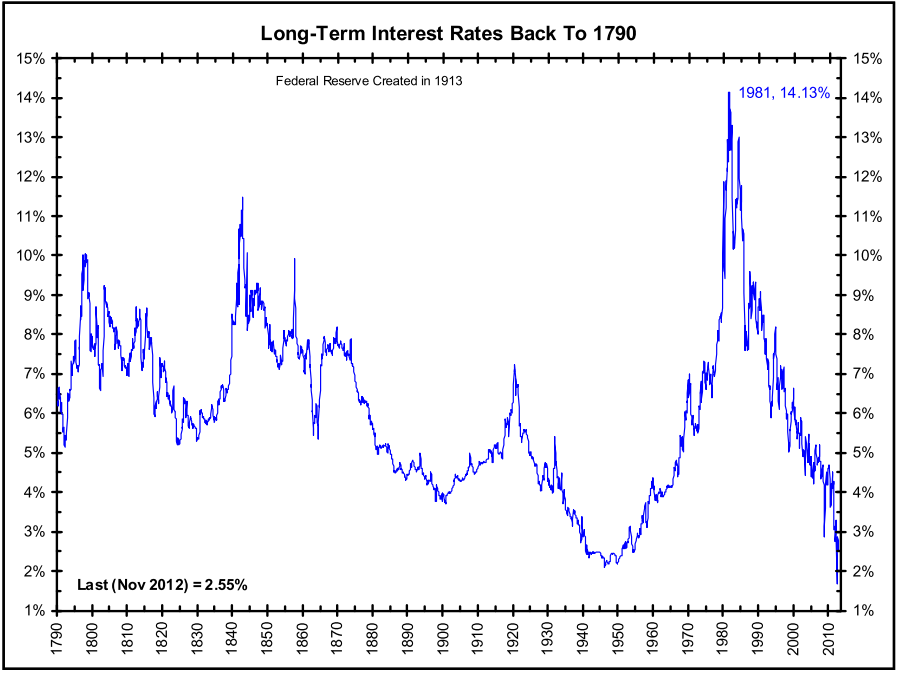
Source: The Big Picture
The peak in interest rates during the early 1980s correlated with a single digit P/E ratio (~8x). The current P/E ratio is deservedly higher (~16x), but it is dramatically lower than the 30x+ P/E ratio realized in the 2000 year timeframe. If none of this discussion makes sense, consider the simple Rule of 20 (see also The Rule of 20 Can Make You Plenty), which states as a simple rule-of-thumb, the average market P/E ratio should be equal to 20 minus the level inflation. With inflation currently averaging about 2%, the Rule of 20 implies an equilibrium of ~18x. If you assume this P/E multiple and factor in a 7-8% earnings growth rate, you could legitimately argue for 20% appreciation in the market to S&P 2,400 over a 12-month period. It’s true, a spike in interest rates, combined with a deceleration in earnings would justify a contraction in stock prices, but even under this scenario, current index values are nowhere near the bubble levels of 2000.
After six long years, the QE train is finally grinding to a halt, and a return towards Fed policy normalcy could be rapidly approaching. Many investors and skeptical bears have tried to rationalize the tripling in the market from early 2009 as solely due to the cheap Fed money printing machine. Unfortunately, history and mathematics don’t support that assertion. If you don’t believe me, perhaps a child may be able to explain it to you better.
Wade W. Slome, CFA, CFP®
Plan. Invest. Prosper.
DISCLOSURE: Sidoxia Capital Management (SCM) and some of its clients own a range of positions in certain exchange traded fund positions, but at the time of publishing SCM had no direct position in any other security referenced in this article. No information accessed through the Investing Caffeine (IC) website constitutes investment, financial, legal, tax or other advice nor is to be relied on in making an investment or other decision. Please read disclosure language on IC Contact page.
NASDAQ 5,000…Irrational Exuberance Déjà Vu?

Investors love round numbers and with the Dow Jones Industrial index recently piercing 17,000 and the S&P 500 index having broken 2,000 , even novice investors have something to talk about around the office water cooler. While new all-time records are being set for the major indices during September, the unsung, tech-laden NASDAQ index has yet to surpass its all-time high of 5,132 achieved 14 and ½ years ago during March of 2000.
A lot has changed since then. Leading up to the pricking of the technology bubble, talks of an overhyped market started as early as December 5, 1996, when then Federal Reserve Chairman Alan Greenspan made his infamous “irrational exuberance” speech.
“But how do we know when irrational exuberance has unduly escalated asset values, which then become subject to unexpected and prolonged contractions as they have in Japan over the past decade?”-Alan Greenspan (Federal Reserve Chairman 1987 – 2006)
On that date, the NASDAQ closed at 1,300. A little over three years later, before values cratered by -78%, the index almost quadrupled higher to 5,132. Looked at from a slightly different lens, here is how the major indexes have fared since Greenspan’s widely referenced speech almost 18 years ago:

Despite the world’s most powerful banker calling stock prices irrational, the Dow & S&P have almost tripled in value (+164% & +167%, respectively) and the NASDAQ has almost quadrupled (+251%). The 80%+ outperformance (excluding dividends) is impressive, but reasonable if you consider this increase amounts to about a +7.2% compounded annual appreciation value. Investors have experienced a lot of heartburn over that long timeframe, but for any buy-and-holders, these returns would have trounced returns realized in alternative safe haven vehicles like CDs, savings accounts, or bonds.
Price: The Almighty Metric
There are many valuation metrics to evaluate but the most universal one is the Price/Earnings ratio (P/E). Just as in the process of assessing the value of a car, house, or stock, the price you pay is usually the most important factor of the purchase. The same principle applies to stock indexes. The cheaper the price paid, the greater probability of earning superior returns in the future. Unfortunately for investors in technology stocks, there was not much value in the NASDAQ index during late-1999, early-2000. Historical P/E data for the NASDAQ index is tough to come by, but some estimates pegged the index value at 200x’s its earnings at the peak of the 2000 technology mania. In other words, for every $1 in profit the average NASDAQ company earned, investors were willing to pay $200…yikes.
Today, the NASDAQ 100 index (the largest 100 non-financial companies in the NASDAQ index), which can serve as a proxy for the overll NASDAQ index, carries a reasonable P/E ratio of approximately 20x on a forward basis (24x on a trailing basis) – about 90% lower than the peak extremes of the NASDAQ index in the year 2000.
Although NASDAQ valuations are much lower today than during the bursting 2000 tech bubble, P/E ratios for the NASDAQ 100 still remain about +20% higher than the S&P 500, which begs the question, “Is the premium multiple deserved?”
As I wrote about in the NASDAQ Tech Revolution, you get what you pay for. If you pay a peanut multiple, many times you get a monkey stock. In the technology world, there is often acute obsolescence risk (remember Blackberry – BBRY?) that can lead to massive losses, but there also exists a winner-takes-all dynamic. Just think of the dominance of Google (GOOG/L) in search advertising, Microsoft (MSFT) in the PC, or Amazon (AMZN) in e-commerce. It’s a tricky game, but following the direction of cash, investments, and product innovation are key in my mind if you plan on finding the long-term winners. For example, the average revenue growth for the top 10 companies in the NASDAQ 100 averaged more than +100% annually from the end of 1999 to the end of 2013. Identifying the “Old Tech Guard” winners is not overly challenging, but discovering the “New Tech Guard” is a much more demanding proposition.
In the winner-takes-all hunt, one need not go any further than looking at the massive role technology plays in our daily lives. Twenty years ago, cell phones, GPS, DVRs (Digital Video Recorders), e-Readers, tablets, electric cars, iPods/MP3s, WiFi mobility, on-demand digital media, video-conferencing, and cloud storage either did not exist or were nowhere near mainstream. Many of these technologies manifest themselves into a whole host of different applications that we cannot live without. One can compile a list of these life-critical applications by thumbing through your smartphone or PC bookmarks. The list is ever-expanding, but companies like Twitter (TWTR), Facebook (FB), Amazon (AMZN), Uber, Netflix (NFLX), Priceline (PCLN), Yelp, Zillow (Z), and a bevy of other “New Tech Guard” companies have built multi-billion franchises that have become irreplaceable applications in our day-to-day lives.
Underlying all the arbitrary index value milestones (e.g., Dow 17,000 and S&P 2,000) since the 1990s has a persistent and unstoppable proliferation of technology adoption across virtually every aspect of our lives. NASDAQ 5,000 may not be here quite yet, but getting there over the next year or two may not be much of a stretch. Speculative tendencies could get us there sooner, and macro/geopolitical concerns could push the milestone out, but when we do get there the feeling of NASDAQ 5,000 déjà vu will have a much stronger foundation than the fleeting euphoric emotions felt when investors tackled the same level in year 2000.
Wade W. Slome, CFA, CFP®
Plan. Invest. Prosper.
DISCLOSURE: Sidoxia Capital Management (SCM) and some of its clients own AAPL, GOOG/L, AMZN, NFLX bonds (short the equity), FB (non-discretionary), MSFT (non-discretionary), PCLN (non-discretionary) and a range of positions in certain exchange traded fund positions, but at the time of publishing SCM had no direct position in TWTR, Uber, YELP, Z, or any other security referenced in this article. No information accessed through the Investing Caffeine (IC) website constitutes investment, financial, legal, tax or other advice nor is to be relied on in making an investment or other decision. Please read disclosure language on IC Contact page.
Back to the Future: Mag Covers (Part I)
Magazine Covers Part II – – – Magazine Covers Part III
I’m not referring to the movie, Back to the Future, about a plutonium-powered DeLorean time machine that finds Marty McFly (played by Michael J. Fox) traveling back in time. Rather, I am shining the light on the uncanny ability of media outlets (specifically magazines) to mark key turning points in financial markets – both market bottoms and market tops. This will be the first in a three part series, providing a few examples of how magazines have captured critical periods of maximum fear (buying opportunities) and greed (selling signals).
People tend to have short memories, especially when it comes to the emotional rollercoaster ride we call the stock market. Thanks to globalization, the internet, and the 24/7 news cycle, we are bombarded with some fear factor to worry about every day. Although I might forget what I had for breakfast, I have been a student of financial market history and have experienced enough cycles to realize as Mark Twain famously stated, “History never repeats itself, but it often rhymes” (read previous market history article). In that vein, let us take a look at a few covers from the 1970s:

Newsweek’s “The Big Bad Bear” issue came out on September 9, 1974 when the collapse of the so-called “Nifty Fifty” (the concentrated set of glamour stocks or “Blue Chips”) was in full swing. This group of stocks, like Avon, McDonalds, Polaroid, Xerox, IBM and Disney, were considered “one-decision” stocks investors could buy and hold forever. Unfortunately, numerous of these hefty priced stocks (many above a 50 P/E) came crashing down about 90% during the1973-74 period.
Why the glum sentiment? Here are a few reasons:
- Exiting Vietnam War
- Undergoing a Recession
- 9% Unemployment
- Arab Oil Embargo
- Watergate: Presidential Resignation
- Franklin National Failure

A cartoon from the same bearish 1974 cover article.
Not a rosy backdrop, but was this scary and horrific phase the ideal time to sell, as the magazine cover may imply? No, actually this was a shockingly excellent time to purchase equities. The Dow Jones Industrial Average, priced at 627 when the magazine was released, is now trading around 10,247…not too shabby a return considering the situation looked pretty darn bleak at the time.
Reports of the Market’s Death Greatly Exaggerated

Sticking with the Mark Twain theme, the reports of the market’s demise was greatly exaggerated too – much the same way we experienced the overstated reaction to the financial crisis early in 2009. BusinessWeek’s August 13, 1979 magazine captured the essence of the bearish mood in the article titled, “The Death of Equities.” This article came out, of course, about 18 months before a multi-decade upward explosion in prices that ended in the “Dot-com” crash of 2000. In the late 1970s, inflation reached double digit levels; gold and oil had more than doubled in price; Paul Volcker became the Federal Reserve Chairman and put on the economic brakes via a tough, anti-inflationary interest rate program; and President Jimmy Carter was dealing with an Iranian Revolution that led to the capture of 63 U.S. hostages. Like other bear market crashes in our history, this period also served as a tremendous time to buy stocks. As you can see from the chart above, the Dow was at 833 at the time of the magazine printing – in the year 2000, the Dow peaked at over 14,000.
This walk down memory lane is not complete. Conveniently, the Back to the Future story was designed as a trilogy (just like my three-part magazine review). You can relive Parts II & III here: Magazine Covers Part II – – – Magazine Covers Part III
Wade W. Slome, CFA, CFP®
Plan. Invest. Prosper.
DISCLOSURE: Sidoxia Capital Management (SCM) has a short position in MCD at the time this article was originally posted. SCM owns certain exchange traded funds, IBM, and DIS, but currently has no direct position in Avon (AVP), Polaroid, Xerox (XRX). No information accessed through the Investing Caffeine (IC) website constitutes investment, financial, legal, tax or other advice nor is to be relied on in making an investment or other decision. Please read disclosure language on IC “Contact” page.
Market Champagne Sits on Ice

Summer may be coming to an end, but the heat in the stock market has not cooled down, as the stock market registered its hottest August performance in 14 years (S&P 500 index up +3.8%). With these stellar results, one would expect the corks to be popping, cash flowing into stocks, and the champagne flowing. However, for numerous reasons, we have not seen this phenomenon occur yet. Until the real party begins, I suppose the champagne will stay on ice.
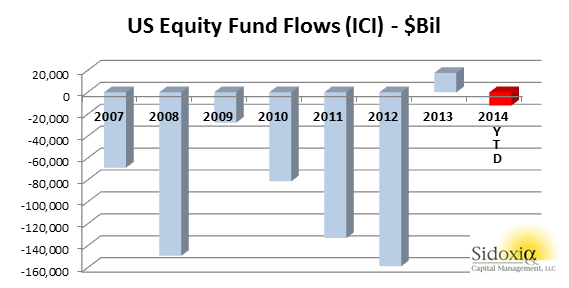
At the end of last year, I wrote further about the inevitable cash tsunami topic in an article entitled, “Here Comes the Dumb Money.” At that point in time, stocks had remarkably logged an approximate +30% return, and all indications were pointing towards an upsurge of investor interest in the stock market. So far in 2014, the party has continued as stocks have climbed another +8.4% for the year, but a lot of the party guests have not arrived yet. With the water temperature in the pool being so enticing, one would expect everyone to jump in the stock market pool. Actually, we have seen the opposite occur as -$12 billion has been pulled out of U.S. stock funds so far in 2014 (see ICI chart below).
How can the market be up +8.4% when money is coming out of stocks? For starters, companies are buying stock by the hundreds of billions of dollars. An estimated $480 billion of stock was purchased by corporations last year via share repurchase authorizations. Adding fuel to the stock fire are near record low interest rates. The ultra-low rates have allowed companies to borrow money at unprecedented rates for the purpose of not only buying back chunks of stock, but also buying the stock of whole companies (Mergers & Acquisitions). Thomson Reuters estimates that M&A activity in 2014 has already reached $2.2 trillion, up more than +70% compared to the same period last year.
Another factor contributing to the lackluster appetite for stocks is the general public’s apathy and disinterest in the market. This disconnected sentiment was captured beautifully by a recent Gallup survey, which asked people the following question:
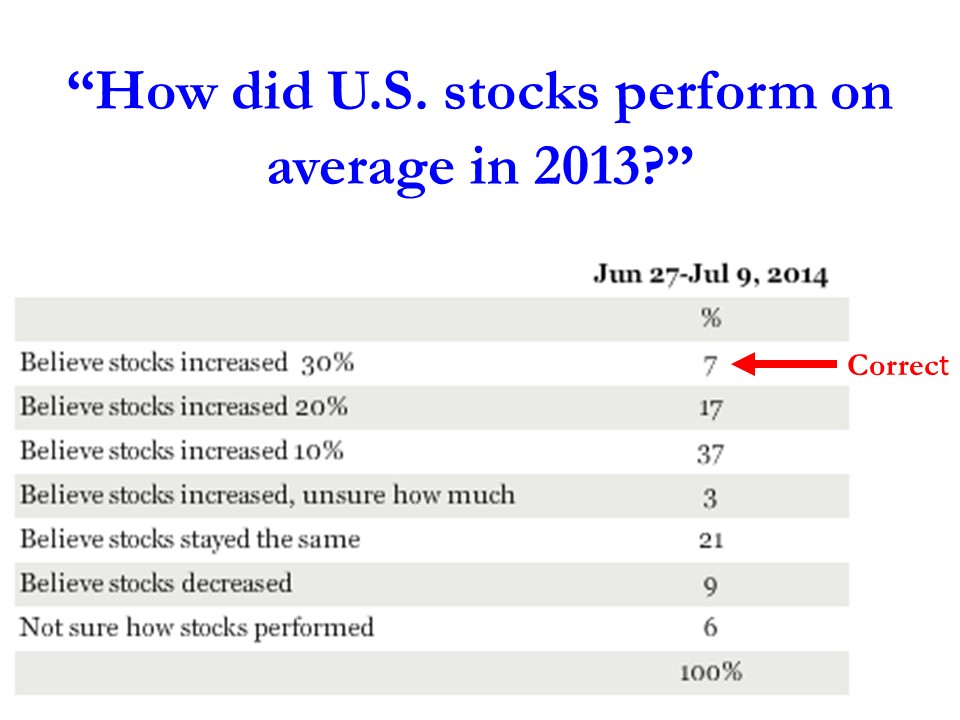
As you can see, only 7% of the respondents realized that stocks were up by more than +30% in 2013. More specifically, the S&P 500 (Large Cap) index was up +29.6%, S&P 600 (Small Cap) +39.7%, and the S&P 400 (Mid Cap) +31.6% (all percentages exclude dividends). Despite these data points, if taken with near 15-year low household stock ownership data, the results prove sentiment is nowhere near the euphoric phases reached before the 2000 bubble burst or the 2006-2008 real estate collapse.
Beyond the scarring effects of the 2008-2009 financial crisis, tempered moods regarding stocks can also be attributed to fresher geopolitical concerns (i.e., military tensions in Ukraine, Islamic extremists in Iraq, and missile launches from the Gaza Strip). The other area of never-ending anxiety is Federal Reserve monetary policy. The stock market, which has tripled in value from early 2009, has skeptics continually blaming artificial Quantitative Easing/QE policies (stimulative bond purchases) as the sole reason behind stocks advance. With current Fed Chair Janet Yellen pulling 70% of the QE punch bowl away (bond purchases now reduced to $25 billion per month), the bears are having a difficult time explaining rising stock prices and declining interest rates. Once all $85 billion in monthly QE purchases are expected to halt in October, skeptics will have one less leg on their pessimistic stool to sit on.
Economy and Profits Play Cheery Tune
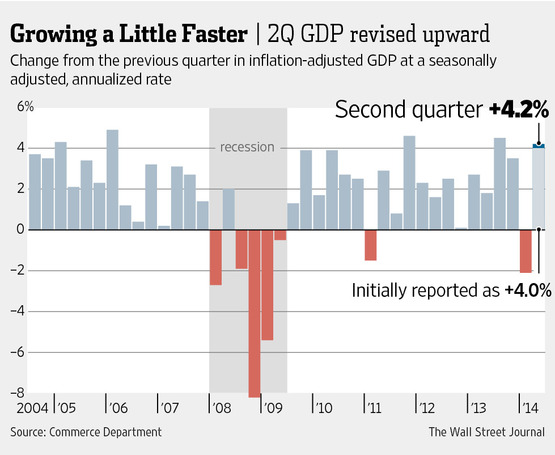
While geopolitical and Federal Reserve clouds may be preventing many sourpusses from joining the stock party, recent economic and corporate data have party attendees singing a cheery tune. More specifically, the broadest measurement of economic activity, GDP (Gross Domestic Product), came in at a higher-than-expected level of +4.2% for the 2nd quarter (see Wall Street Journal chart below).
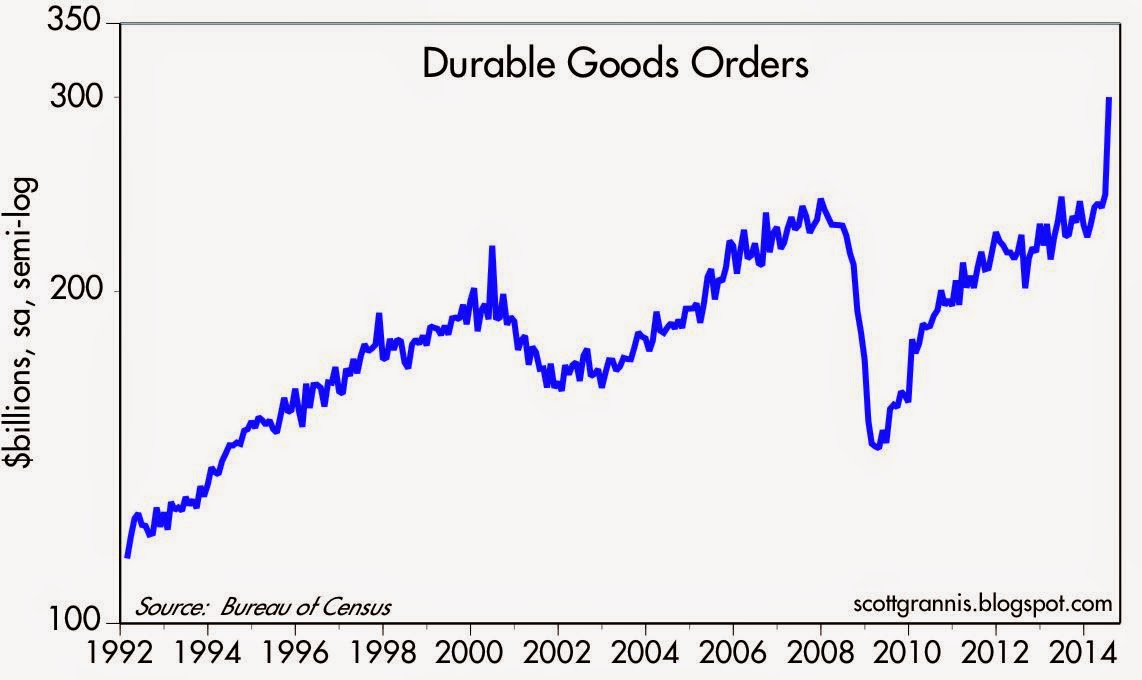
Moreover, the spike in July’s Durable Goods orders also paints a healthy economic picture (see chart below). The data is volatile (i.e., Boeing Co orders – BA), nevertheless, CEO confidence is on the rise. Improved confidence results in executives opening up their wallets and investing more into their businesses.
Source: Calafia Beach Pundit
Last but not least, the lifeblood of appreciating stock prices (earnings/profits) have been accelerating higher. In the most recent quarterly results, we saw a near doubling of the growth rate from 1st quarter’s +5% growth rate to 2nd quarter’s +10% growth rate (see chart below).
Source: Dr. Ed’s Blog
With the S&P 500 continuing to make new record highs despite scary geopolitical and Federal Reserve policy concerns, the stock market party is still waiting for guests to arrive. When everyone arrives and jumps in the pool, it will be time to pop the corks and sell. Until then, there is plenty of appreciation potential as the champagne sits on ice.


