Posts filed under ‘Financial Markets’
Will Rising Rates Murder Market?

After an obituary of Mark Twain had been mistakenly published in the United States, Twain sent a cable from London stating, “The reports of my death have been greatly exaggerated.” Similar reports about the death of the stock market have been prematurely published as well. If you were to listen to the talking heads on TV or other self-proclaimed media pundits, the prevailing opinion is that rising interest rates will murder the stock market. In reality, the benchmark 10-Year Treasury Note has risen a whopping 0.23% so far this year. Could this be a start of a more prolonged increase in interest rates? It is certainly possible. Most investors have a very short memory because we have seen this movie before. It was just two short years ago that we witnessed a near doubling of 10-Year Treasury yields exploding from 1.76% to 3.03% in 2013. Did the stock market crater? In fact, quite the contrary. The S&P 500 index catapulted higher by a whopping +30%.
Even if we go back a litter further in recent history, interest rates were quite a bit higher. For example in early 2010, 10-Year Treasury yields breached 4.0%. Where was the Dow Jones Industrial index then? A mere 11,000 vs 17,850 today. Or in other words, when interest rates were significantly higher than today’s 2.40% yield, the stock market managed to climb +62% higher. Not too shabby, eh? As I have talked about in the past (see Don’t Be a Fool, Follow the Stool), there are other factors besides interest rates that are contributing to positive stock returns – primarily profits, valuations, and sentiment are the other key factors in determining stock prices. Suffice it to say, over the last five years, stocks have survived quite well in the face of multiple interest rate spikes; the 2013 “Taper Tantrum”; and the subsequent completion of quantitative easing – QE (see chart below).
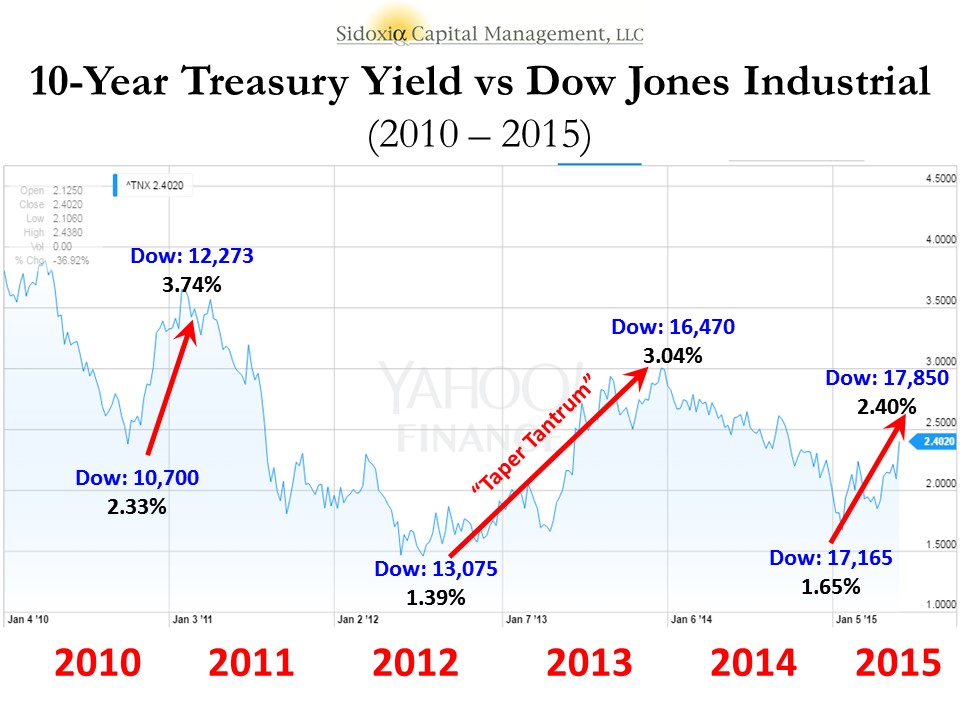
Underlying Chart: Yahoo Finance!
Yield Curve on the Side of Bulls
Despite the trepidation over a series of potential Fed rate hikes, stocks continue to grind higher. If the fears are based on the expectation of a slowing economy on the horizon, then we would generally see two things happening. First, rising short-term interest rates would cause the yield curve to flatten, and then secondly, the yield curve would invert (typically a leading indicator for a recession). Currently, there are no signs of flattening or inverting. Actually, the recent better than expected jobs report for May (280,000 jobs added vs. estimate of 226,000) created a steeper yield curve – long-term interest rates increased more than short-term interest rates. Just as I wrote in 2009 about the recovery (see Steepening Yield Curve Recovery), right now the bond market is flashing recovery…not slowdown.
In the face of the mini-interest rate spike, bank stocks are also signaling economic recovery – evidenced by the 2.75% surge in the KBW Bank Index (KBX) last week. If there were signs of dark clouds on the horizon, a flattening yield curve would squeeze bank net interest margins and profits, which ultimately would send bank investors to the exit. That phenomenon will eventually happen later in the economic cycle, but right now investors are voting in the opposite direction with their dollars.
The media, economists, strategists, and other nervous onlookers will continue fretting over the Federal Reserve’s eventual rate increases. As long as dovish Janet Yellen is at the helm of the Fed, future rate increases will be measured, and rather than murdering the stock market, the policies will merely reflect a removal of the economy from artificial life support.

Wade W. Slome, CFA, CFP®
Plan. Invest. Prosper.
DISCLOSURE: Sidoxia Capital Management (SCM) and some of its clients hold positions in certain exchange traded funds (ETFs), but at the time of publishing, SCM had no direct position in any other security referenced in this article. No information accessed through the Investing Caffeine (IC) website constitutes investment, financial, legal, tax or other advice nor is to be relied on in making an investment or other decision. Please read disclosure language on ICContact page.
Digesting Stock Gains

This article is an excerpt from a previously released Sidoxia Capital Management complementary newsletter (June 1, 2015). Subscribe on the right side of the page for the complete text.
Despite calls for “Sell in May, and go away,” the stock market as measured by both the Dow Jones Industrial and S&P 500 indexes grinded out a +1% gain during the month of May. For the year, the picture looks much the same…the Dow is up around +1% and the S&P 500 +2%. After gorging on gains of +30% in 2013 and +11% in 2014, it comes as no surprise to me that the S&P 500 is taking time to digest the gains. After eating any large pleasurable meal, there’s always a chance for some indigestion – just like last month. More specifically, the month of May ended as it did the previous six months…with a loss on the last trading day (-115 points). Providing some extra heartburn over the last 30 days were four separate 100+ point decline days. Realized fears of a Greek exit from the eurozone would no doubt have short-term traders reaching for some Tums antacid. Nevertheless, veteran investors understand this is par for the course, especially considering the outsized profits devoured in recent years.
The profits have been sweet, but not everyone has been at the table gobbling up the gains. And with success, always comes the skeptics, many of whom have been calling for a decline for years. This begs the question, “Are we in a stock bubble?” I think not.
Bubble Bites
Most asset bubbles are characterized by extreme investor/speculator euphoria. There are certainly small pockets of excitement percolating up in the stock market, but nothing like we experienced in the most recent burstings of the 2000 technology and 2006-07 housing bubbles. Yes, housing has steadily improved post the housing crash, but does this look like a housing bubble? (see New Home Sales chart)

Source: Dr. Ed’s Blog
Another characteristic of a typical asset bubble is rabid buying. However, when it comes to the investor fund flows into the U.S. stock market, we are seeing the exact opposite…money is getting sucked out of stocks like a Hoover vacuum cleaner. Over the last eight or so years, there has been almost -$700 billion that has hemorrhaged out of domestic equity funds – actions tend to speak louder than words (see chart below):
 Source: Investment Company Institute (ICI)
The shift to Exchange Traded Funds (ETFs) offered by the likes of iShares and Vanguard doesn’t explain the exodus of cash because ETFs such as S&P 500 SPDR ETF (SPY) are suffering dramatically too. SPY has drained about -$17 billion alone over the last year and a half.
With money flooding out of these stock funds, how can stock prices move higher? Well, one short answer is that hundreds of billions of dollars in share buybacks and trillions in mergers and acquisitions activity (M&A) is contributing to the tide lifting all stock boats. Low interest rates and stimulative monetary policies by central banks around the globe are no doubt contributing to this positive trend. While the U.S. Federal Reserve has already begun reversing its loose monetary policies and has threatened to increase short-term interest rates, by any objective standard, interest rates should remain at very supportive levels relative to historical benchmarks.
Besides housing and fund flows data, there are other unbiased sentiment indicators that indicate investors have not become universally Pollyannaish. Take for example the weekly AAII Sentiment Survey, which shows 73% of investors are currently Bearish and/or Neutral – significantly higher than historical averages.
The Consumer Confidence dataset also shows that not everyone is wearing rose-colored glasses. Looking back over the last five decades, you can see the current readings are hovering around the historical averages – nowhere near the bubblicious 2000 peak (~50% below).

Source: Bespoke
Recession Reservations
Even if you’re convinced there is no imminent stock market bubble bursting, many of the same skeptics (and others) feel we’re on the verge of a recession – I’ve been writing about many of them since 2009. You could choke on an endless number of economic indicators, but on the common sense side of the economic equation, typically rising unemployment is a good barometer for any potentially looming recession. Here’s the unemployment rate we’re looking at now (with shaded periods indicating prior recessions):

As you can see, the recent 5.4% unemployment rate is still moving on a downward, positive trajectory. By most peoples’ estimation, because this has been the slowest recovery since World War II, there is still plenty of labor slack in the market to keep hiring going.
An even better leading indicator for future recessions has been the slope of the yield curve. A yield curve plots interest rate yields of similar bonds across a range of periods (e.g., three-month bill, six-month bill, one-year bill, two-year note, five-year note, 10-year note and 30-year bond). Traditionally, as short-term interest rates move higher, this phenomenon tends to flatten the yield curve, and eventually inverts the yield curve (i.e., short-term interest rates are higher than long-term interest rates). Over the last few decades, when the yield curve became inverted, it was an excellent leading indicator of a pending recession (click here and select “Animate” to see amazing interactive yield curve graph). Fortunately for the bulls, there is no sign of an inverted yield curve – 30-year rates remain significantly higher than short-term rates (see chart below).

Stock market skeptics continue to rationalize the record high stock prices by pointing to the artificially induced Federal Reserve money printing buying binge. It is true that the buffet of gains is not sustainable at the same pace as has been experienced over the last six years. As we continue to move closer to full employment in this economic cycle, the rapid accumulated wealth will need to be digested at a more responsible rate. An unexpected Greek exit from the EU or spike in interest rates could cause a short-term stomach ache, but until many of the previously mentioned indicators reach dangerous levels, please pass the gravy.
Wade W. Slome, CFA, CFP®
Plan. Invest. Prosper.
DISCLOSURE: Sidoxia Capital Management (SCM) and some of its clients hold positions in SPY and other certain exchange traded funds (ETFs), but at the time of publishing, SCM had no direct position in any other security referenced in this article. No information accessed through the Investing Caffeine (IC) website constitutes investment, financial, legal, tax or other advice nor is to be relied on in making an investment or other decision. Please read disclosure language on IC Contact page.
U.S. Takes Breather in Windy Economic Race

This article is an excerpt from a previously released Sidoxia Capital Management complementary newsletter (May 1, 2015). Subscribe on the right side of the page for the complete text.
Looking back, in the race for financial dominance, the U.S. economy sprinted out to a relatively quick recovery from the 2008-2009 financial crisis injury compared to its other global competitors. The ultra-loose monetary policies implemented by the Federal Reserve (i.e., zero percent Fed Funds rate, quantitative easing – QE, Operation Twist, etc.) and the associated weakening in the value of the U.S. dollar served as tailwinds for growth. The low interest rate byproduct created cheaper borrowing costs for consumers and businesses alike for things like mortgages, refinancings, stock buybacks, and infrastructure investments. The cheaper U.S. dollar also helped domestically based, multinational companies sell their goods abroad at more attractive prices.
However, those positive dynamics have now changed. With the end of stimulative bond buying (QE) and threats of imminent interest rate hikes coming from the Federal Reserve and its Chairwoman Janet Yellen, the tailwinds for the U.S. economy have now transitioned into headwinds. The measly +0.2% growth recently reported in the 1st quarter – Gross Domestic Product (GDP) results are evidence of an economy currently sucking wind (see chart below).
As it relates to the stock market, the Dow Jones crept up +0.4% for the month of April to 17,841, and is essentially flat for all of 2015. Small Cap stocks in the Russell 2000® Index (companies with an average value of $2 billion – IWM), pulled a muscle in April as shown by the index’s -2.6% tumble. A slight increase in the yield of the 10-Year Treasury to 2.05% caused bond prices to contract a modest -0.5% for the month.
Beyond a strengthening dollar and threats of rising interest rates, debilitating port strikes on the West Coast and abnormally cold weather especially back east also contributed to weak trade data and sub par economic performance. Although a drop in oil and gasoline prices should ultimately be stimulative for broader consumer and industrial activity, the immediate negative impacts of job losses and declining drilling in the energy sector added to the drag on 1st quarter GDP results.
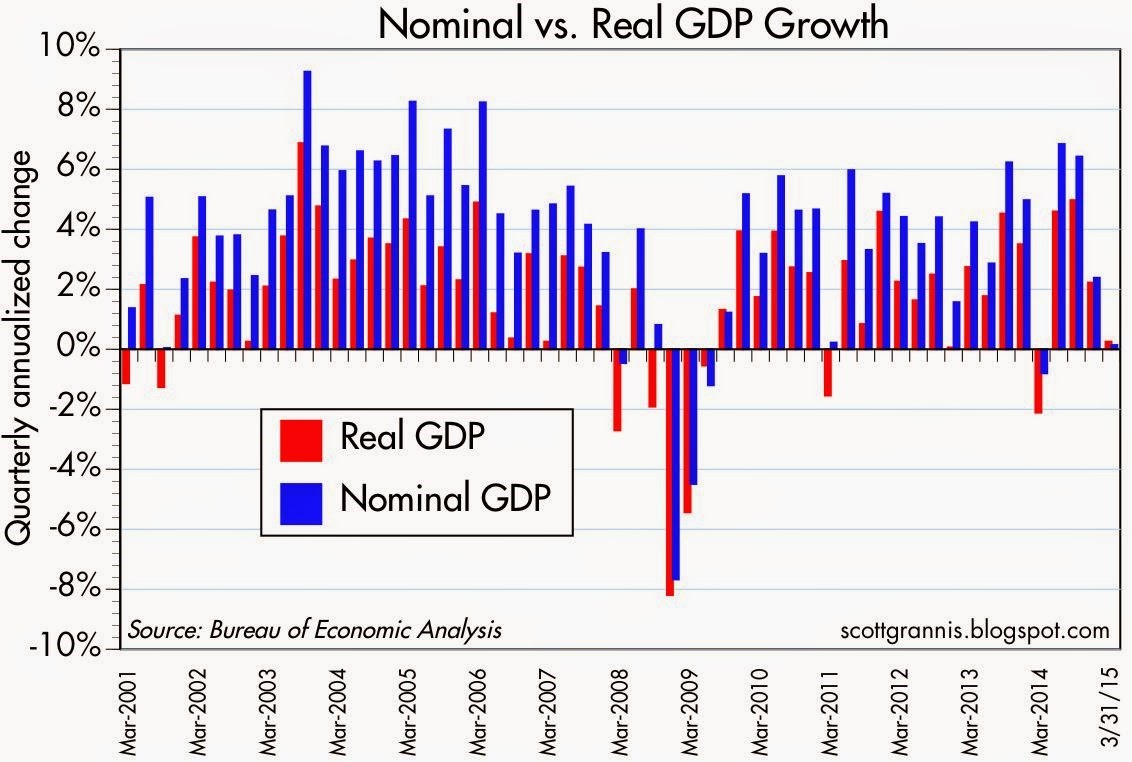
Source: Scott Grannis (Calafia Beach Pundit)
The good news is that many of the previously mentioned negative factors are temporary in nature and should self-correct themselves as we enter the 2nd quarter. One positive aspect to our country’s strong currency is cheaper imports. So, as the U.S. recovers from its temporary currency cramps, foreigners will continue pumping out cheap exports to Americans for purchase. If this import phenomenon lasts, these lower priced goods, coupled with discounted oil prices, should keep a lid on broader inflation. The benefit of lower inflation means the Federal Reserve is more likely to postpone slamming the brakes on the economy with interest rate hikes. The decision of when to lift interest rates will ultimately be data-dependent. Due to the lousy 1st quarter numbers, it will probably take some time for economic momentum to reemerge, and therefore the Fed is unlikely to raise interest rates until September, at the earliest.
The great thing about financial markets and economics is many of these swirling monetary winds eventually self-correct themselves. And during April, we saw these self-correcting mechanisms up close and in person. For example, from March 2014 to March 2015 the U.S. dollar appreciated in value by about +25% versus the euro currency (FXE). However, from the peak exchange rate seen this March, the value of the U.S. dollar declined by about -7%. The same self-correcting principle applies to the oil market. From the highs reached in mid-2014 at about $108 per barrel, crude oil prices plunged by about -60% to a low of $42 per barrel in March. Since then, oil prices have recovered significantly by spiking over +40% to about $60 per barrel today.
Competitors Narrow the Gap with the U.S.
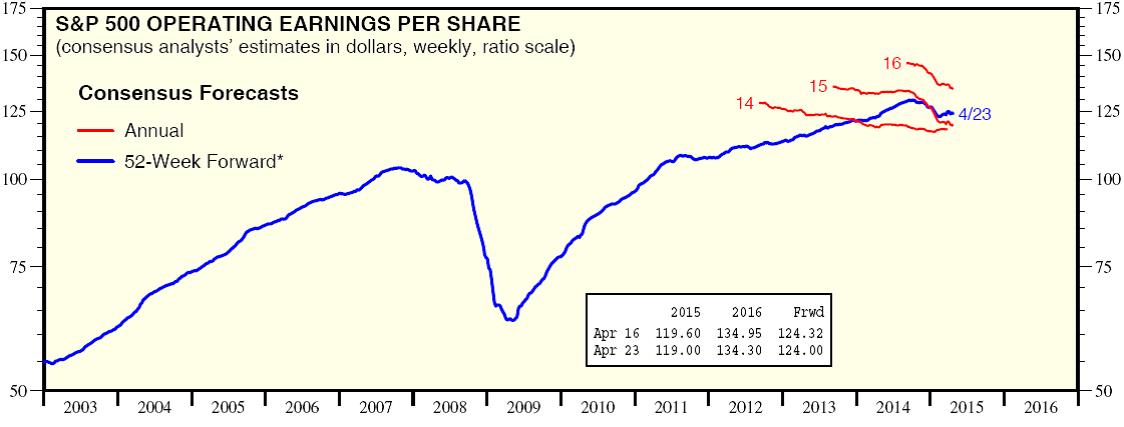
Source: Dr. Ed Yardeni
As I’ve written many times in the past, one of the ultimate arbiters of stock price performance is the long-term direction of corporate profits. And as you can see from the chart above, profits have hit a bump in the road after a fairly uninterrupted progression over the last six years. The decline is nowhere near the collapse of 2008-2009, but given the rise in stock prices, investors should be prepared for the bears and skeptics to become more vocal.
And while the U.S. has struggled a bit, European and Asian shares have advanced significantly. To that point, Asian equities (FXI) spiked an impressive +16% in April (see chart below) and European stocks jumped a respectable +4% (VGK) over the same timeframe.
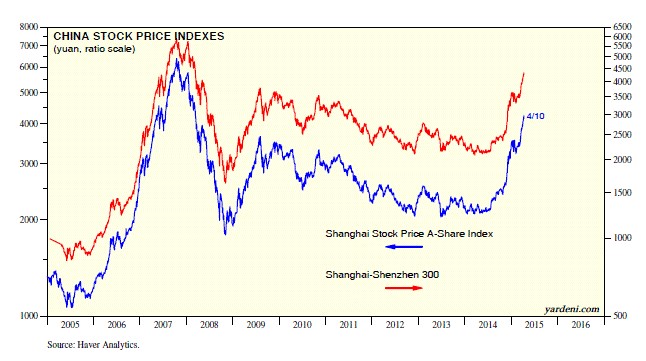
Source: Dr. Ed’s Blog
Bolstering the advance in China’s shares has been the Chinese central bank’s move to cut the amount of cash that banks must hold as reserves (“reserve requirements”). The action by the central bank is designed to spur bank lending and combat slowing growth in the world’s second largest economy. The Europeans are not sitting idly on their hands either. European central bankers have taken a cheat sheet page from the U.S. playbook and have introduced their own form of trillion dollar+ quantitative easing (see Draghi Provides Beer Goggles) in hopes of jump starting the European economy. Given the moves, how is the European business activity picture looking? Well, based on the Eurozone Purchasing Managers’ Index (PMI), you can see from the chart below that the region is finally growing (readings > 50 indicate expansion).
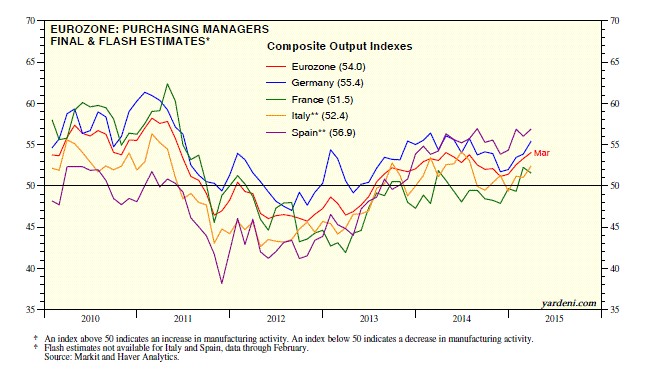
Source: Dr. Ed’s Blog
The economic winds in the global race for growth have been swirling in all directions, and due to temporary headwinds, the dominating lead of the U.S. has narrowed. Fortunately for long-term investors, they understand investing is a marathon and not a sprint. Holding a globally balanced and diversified portfolio will help you maintain the stamina required for these volatile and windy economic times.
Wade W. Slome, CFA, CFP®
Plan. Invest. Prosper.
DISCLOSURE: Sidoxia Capital Management (SCM) and some of its clients hold positions in certain exchange traded funds (ETFs), FXI, VGK, and a short position in FXE, but at the time of publishing, SCM had no direct position in IWM, or any other security referenced in this article. No information accessed through the Investing Caffeine (IC) website constitutes investment, financial, legal, tax or other advice nor is to be relied on in making an investment or other decision. Please read disclosure language on IC Contact page.
Fink & Capitalism: Need 4 Kitchens in Your House?

Do you need four kitchens in your house? Apparently financial industry titan Larry Fink does. If Mr. Fink were a designer for millionaire homeowners, he would advise them to use their millions to build more kitchens in their house (reinvest) rather than distribute those monies to family members (dividends) or use that money to pay back an equity loan from mom and dad for the down payment (share buybacks). Essentially that is exactly what is happening in the stock market. Companies that are generating record profits and margins (millionaires) are increasingly choosing to pay out larger percentages of profits to stockholders (family members) in the form of rising dividends and share buybacks. Contrary to Mr. Fink’s belief, corporate America is actually doing plenty with room additions, landscaping, and roof replacements – I will describe more later.
As a consequence of corporate America’s increasingly shareholder friendly practices of returning cash, Fink believes this trend will stifle innovation and long-term growth in American companies. Here’s a snapshot of the supposed dividend/buyback problem Mr. Fink describes:

Source: Financial Times
Fink Mails Letter from Soapbox
For those of you who do not know who Larry Fink is, he is the successful Chairman and CEO of BlackRock Inc. (BLK), an investment manager which oversees about $4.65 trillion in investment assets. Mr. Fink ignited this recent financial controversy when he jumped on his soapbox by mailing letters to 500 CEOs lecturing them on the importance of long-term investing. What is Mr. Fink’s beef? Fink’s issues revolve around his belief that CEOs and corporations are too short-term oriented.
In his letter, Mr. Fink had this to say:
“This pressure [to meet short-term financial goals] originates from a number of sources—the proliferation of activist shareholders seeking immediate returns, the ever-increasing velocity of capital, a media landscape defined by the 24/7 news cycle and a shrinking attention span, and public policy that fails to encourage truly long-term investment.”
He goes on to bolster his argument with the following:
“More and more corporate leaders have responded with actions that can deliver immediate returns to shareholders, such as buybacks or dividend increases, while underinvesting in innovation, skilled workforces or essential capital expenditures necessary to sustain long-term growth.”
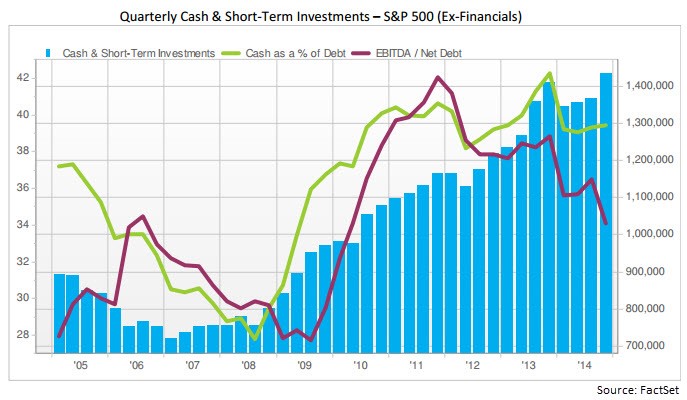
What Mr. Fink does not say in his letter is that large, multinational S&P 500 corporations driving this six-year bull run are sitting on a record hoard of cash, exceeding $1.4 trillion (see chart below). In this light, it should come as no surprise that CEOs are forking over more cash to investors in the forms of dividends and share repurchases.
What’s more, despite Fink’s assertion that share buybacks and dividends are killing innovation, he also fails to mention in his letter that 2014 capital expenditures of $730 billion are also at a record level. That’s right, CAPEX has not been cut to the bone as he implies, but rather risen to all-time highs.
It’s true that generationally low (and declining) interest rates have accelerated the pace of dividends/repurchases, however dividend payout ratios (the percentage of profits distributed to shareholders) of about 32% remain firmly below the long-term payout ratio of approximately 54% (see chart below) – see also Dividend Floodgates Widen. I find it difficult to fault many companies doing something with the gargantuan piles of inflation-losing cash anchoring their balance sheets. Don’t cash-rich companies have a fiduciary duty to borrow reasonable amounts of near-0% debt today (see Bunny Rabbit Market) in exchange for share buybacks currently providing returns of about 5.5% (inverse of 18x P/E ratio) and likely yielding 7%+ returns five years from now?

Source: Financial Times
The “Short-Term” Poster Child – Apple
There is no arguing that excessive debt eventually can catch up to a company. Our multi-year expanding economy is eventually due for another recession in the coming years, and there will be hell to pay for irresponsible, overleveraged companies. With that said, let’s take a look at the poster child of “short-termism” according to Mr. Fink …Apple Inc. (AAPL).
Of the roughly $500 billion in buybacks spent by S&P 500 companies in 2014, Apple accounted for approximately $45 billion of that figure. On top of that, CEO Tim Cook and his board generously decided to return another $11 billion to shareholders in the form of dividends. Has this “short-term” return of capital stifled innovation from the company that has launched iPhone version 6, iPad, Apple Watch, Apple Pay, and is investing into exciting areas like Apple Television, Apple Car, and who knows what else?
To put these Apple numbers into perspective, consider that last year Apple spent over $6 billion on research and development (R&D); $10 billion on capital expenditures; and hired over 12,000 new full-time employees. This doesn’t exactly sound like the death of innovation to me. Even after doling out roughly -$28 billion in expenditures and -$56 billion in dividends/share repurchases, Apple was amazingly able to keep their net cash position flat at an eye-popping +$141 billion!
Mr. Fink abhors “activist shareholders seeking immediate returns” but rather than deriding them perhaps he should send the greedy, capitalist Carl Icahn a personal thank you letter. Since Icahn’s vocal plea for a large Apple share buyback, the shares have skyrocketed about +85%, catapulting BlackRock’s ownership value in Apple to over $19 billion.
With respect to these increasing outlays, Mr. Fink also notes:
“Returning excessive amounts of capital to investors—who will enjoy comparatively meager benefits from it in this environment—sends a discouraging message.”
This would be true if investors took the dividends and stuffed them under their mattress, but an important message Mr. Fink neglects to address as it relates to dividends and share buybacks is demographics. There are 76 million Baby Boomers born between 1946 – 1964 and a Boomer is turning age 65 every 8 seconds. With many bonds trading at near 0% yields (even negative yields) it is no wonder many income starving retirees are demanding many of these cash-rich corporations to share more of the growing spoils via rising dividends.
Capitalism Works
After looking at a few centuries of our country’s history, one of the main lessons we can learn is that capitalism works – especially over the long-run. With about 200 countries across the globe, there is a reason the U.S. is #1…we’re good at capitalism. As our economy has matured over the decades, it is true our priorities and challenges have changed. It is also true that other countries may be narrowing the gap with the U.S., due to certain advantages (e.g., demographics, lower entitlements, easier regulations, etc), but the U.S. will continue to evolve.
In many respects, capitalism is very much like Darwinism – corporations either adapt with the competition…or they die. I repeatedly hear from pessimists that the U.S. is in a secular state of decline, but if that’s the case, how come the U.S. continues to dominate and innovate in major industries like biotechnology, mobile technology, networking, internet, aviation, energy, media, and transportation? Quite simply, we are the best and most experienced practitioners of capitalism.
Certainly, capitalism will continue to cultivate cyclical periods of excess investment/leverage and insufficient regulation. But guess what? Investors, including the public, eventually lose their shirts and behaviors/regulations adjust. At least for a little while, until the next period of excess takes hold. If Apple, and other balance sheet healthy companies allocate capital irresponsibly, capital will flow towards more aggressive and innovative companies. BlackBerry Limited (BBRY) knows a little bit about the consequences of cutthroat competition and suboptimal capital allocation.
While I emphatically share Mr. Fink’s focus on long-term investing values (including his self-serving tax reform ideas), I vigorously disagree with his attacks on shareholder friendly actions and his characterization of rising dividends/buybacks as short-term in nature. In fact, increasing dividends and share buybacks can very much coexist as a long-term investment and capital allocation strategy.
The question of proper capital allocation should have more to do with the age of a company. It only makes sense that younger companies on average should reinvest more of their profits into growth and innovation. On the other hand, more mature S&P 500-like companies will be in a better position to distribute higher percentages of profits to shareholders – especially as cash levels continue to rise to record levels and leverage remains in check.
BlackRock’s Larry Fink may continue to urge CEOs to reinvest their growing cash hoards into superfluous corporate kitchens, but Sidoxia and other prudent capitalist investors will continue to exhort CEOs to opportunistically take advantage of near-free borrowing rates and responsibly share the accretive gains with shareholders. That’s a message Mr. Fink should include in a letter to CEOs – he can use BlackRock’s lofty, above-average dividend to cover the cost of postage.
Wade W. Slome, CFA, CFP®
Plan. Invest. Prosper.
DISCLOSURE: Sidoxia Capital Management (SCM) and some of its clients hold positions in certain exchange traded funds (ETFs) including AAPL and iShares ETFs, but at the time of publishing, SCM had no direct position in BLK, BBRY or any other security referenced in this article. No information accessed through the Investing Caffeine (IC) website constitutes investment, financial, legal, tax or other advice nor is to be relied on in making an investment or other decision. Please read disclosure language on IC Contact page.
The Bunny Rabbit Market

This article is an excerpt from a previously released Sidoxia Capital Management complementary newsletter (April 1, 2015). Subscribe on the right side of the page for the complete text.
With spring now upon us, we can see the impact the Easter Bunny has had on financial markets…a lot of bouncing around. More specifically, stocks spent about 50% of the first quarter in negative territory, and 50% in positive territory. With interest rates gyrating around the 2% level for the benchmark 10-Year Treasury Note for most of 2015, the picture looked much the same. When all was said and done, after the first three months of the year, stocks as measured by the S&P 500 finished +0.4% and bonds closed up a similarly modest amount of +1.2%, as measured by the Total Bond Market ETF (BND).
Why all the volatility? The reasons are numerous, but guesswork of when the Federal Reserve will reverse course on its monetary policy and begin raising interest rates has been (and remains) a dark cloud over investment strategies for many short-term traders and speculators. In order to provide some historical perspective, the last time the Federal Reserve increased interest rates (Federal Funds rate) was almost nine years ago in June 2006. It’s important to remember, as this bull market enters its 7th consecutive year of its advance, there has been no shortage of useless, negative news headlines to keep investors guessing (see also a Series of Unfortunate Events). Over this period, ranging concerns have covered everything from “Flash Crashes” to “Arab Springs,” and “Ukraine” to “Ebola”.
Last month, the headline pessimism persisted. In the Middle East we witnessed a contentious re-election of Israeli Prime Minister Benjamin Netanyahu; Saudi Arabia led airstrikes against Iranian-backed, Shi’ite Muslim rebels (Houthis) in Yemen; controversial Iranian nuclear deal talks; and President Barack Obama directed airstrikes against ISIS fighters in the Iraqi city of Tikrit, while he simultaneously announced the slowing pace of troop withdrawals from Afghanistan.
Meanwhile in the global financial markets, investors and corporations continue to assess capital allocation decisions in light of generationally low interest rates, and a U.S. dollar that has appreciated in value by approximately +25% over the last year. In this low global growth and ultra-low interest rate environment (-0.12% on long-term Swiss bonds and 1.93% for U.S. bonds), what are corporations choosing to do with their trillions of dollars in cash? A picture is worth a thousand words, and in the case of companies in the S&P 500 club, share buybacks and dividends have been worth more than $900,000,000,000.00 over the last 12 months (see chart below).

Source: Financial Times
Case in point, Apple Inc (AAPL) has been the poster child for how companies are opportunistically boosting stock prices and profitability metrics (EPS – Earnings Per Share) by borrowing cheaply and returning cash to shareholders via stock buybacks and dividend payments. More specifically, even though Apple has been flooded with cash (about $178 billion currently in the bank), Apple decided to accept $1.35 billion in additional money from bond investors by issuing bonds in Switzerland. The cost to Apple was almost free – the majority of the money will be paid back at a mere rate of 0.28% until November 2024. What is Apple doing with all this extra cash? You guessed it…buying back $45 billion in stock and paying $11 billion in dividends, annually. No wonder the stock has sprung +62% over the last year. Apple may be a unique company, but corporate America is following their shareholder friendly buyback/dividend practices as evidenced by the chart below. By the way, don’t be surprised to hear about an increased dividend and share buyback plan from Apple this month.

Source: Investors Business Daily
Despite all the turmoil and negative headlines last month, the technology-heavy NASDAQ Composite index managed to temporarily cross the psychologically, all-important 5,000 threshold for the first time since the infamous tech-bubble burst in the year 2000, more than 15 years ago. The Dow Jones Industrial also cracked a numerically round threshold (18,000) last month, before settling down at 17,779 at month’s end.
While the S&P 500 and NASDAQ indexes have posted their impressive 9th consecutive quarter of gains, I don’t place a lot of faith in dubious, calendar-driven historical trends. With that said, as I eat jelly beans and hunt for Easter eggs this weekend, I will take some solace in knowing April has historically been the most positive month of the year as it relates to direction of stock prices (see chart below). Over the last 20 years, stocks have almost averaged a gain of +3% over this 30-day period. Perhaps investors are just in a better mood after paying their taxes?
Source: Bespoke
Even though April has historically been an outperforming month, banker and economist Robert Rubin stated it best, “Nothing is certain – except uncertainty.” We’ve had a bouncing “Bunny Market” so far in 2015, and chances are this pattern will persist. Rather than fret whether the Fed will raise interest rates 0.25% or agonize over a potential Greek exit (“Grexit”) from the EU, you would be better served by constructing an investment and savings plan to meet your long-term financial goals. That’s an eggstra-special idea that even the Easter Bunny would want to place in the basket.
Wade W. Slome, CFA, CFP®
Plan. Invest. Prosper.
DISCLOSURE: Sidoxia Capital Management (SCM) and some of its clients hold positions in certain exchange traded funds (ETFs) including BND and AAPL (stock), but at the time of publishing, SCM had no direct position in any other security referenced in this article. No information accessed through the Investing Caffeine (IC) website constitutes investment, financial, legal, tax or other advice nor is to be relied on in making an investment or other decision. Please read disclosure language on IC Contact page.
Chicken or Beef? Time for a Stock Diet?

The stock market has been gorging on gains over the last six years and the big question is are we ready for a crash diet? In other words, have we consumed too much, too fast? Since the lows of 2009 the S&P 500 index has more than tripled (or +209% without dividends).
In our daily food diets our proteins of choice are primarily chicken and beef. When it comes to finances, our investment choices are primarily stocks and bonds. There are many factors that can play into a meat-eaters purchase decision, including the all-important factor of price. When the price of beef spikes, guess what? Consumers rationally vote with their wallets and start substituting beef for relatively lower priced chicken options.
The same principle applies to stocks and bonds. And right now, the price of bonds in general have gone through the roof. In fact bond prices are so high, in Europe we are seeing more than $2 trillion in negative yielding sovereign bonds getting sucked up by investors.
Another area where we see evidence of pricey bonds can be found in the value of current equity risk premiums. Scott Grannis of Calafia Beach Pundit posted a great 50-year history of this metric (chart below), which shows the premium paid to stockholders over bondholders is near the highest levels last seen during the Great Recession and the early 1980s. To clarify, the equity risk premium is defined as the roughly 5.5% yield currently earned on stocks (i.e., inverse of the approx. 18x P/E ratio) minus the 2.0% yield earned on 10-Year Treasury Notes.
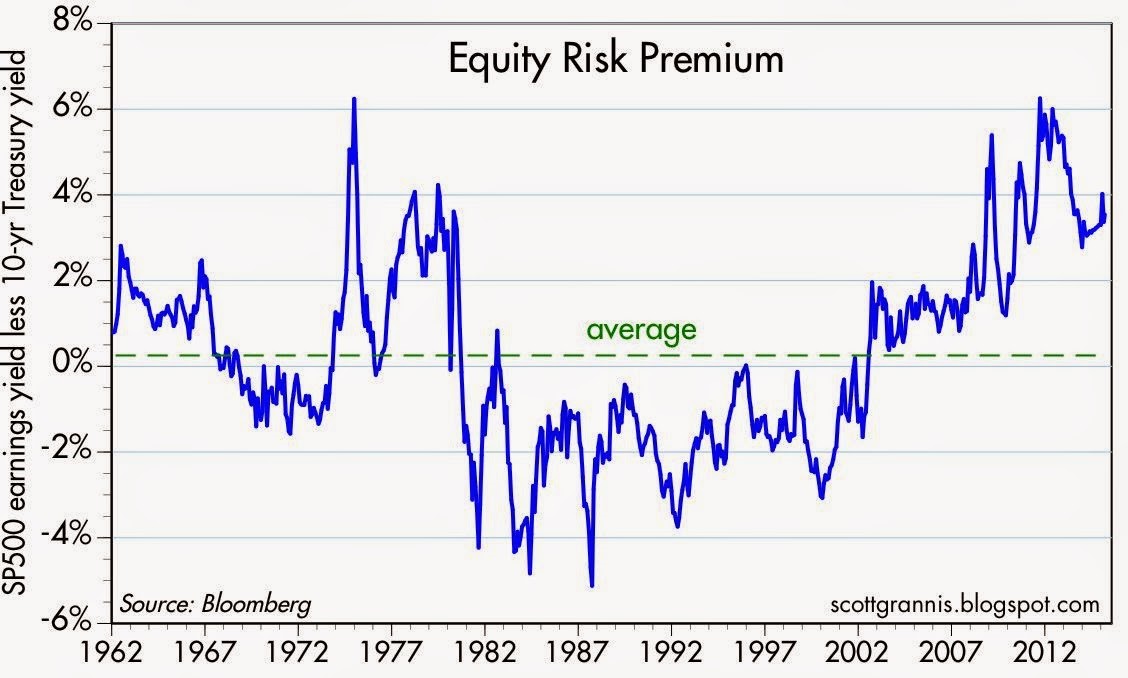
Source: Scott Grannis
The equity risk premium even looks more favorable if you consider the negative interest rate European environment mentioned earlier. The 60 billion euros of monthly debt in ECB (European Central Bank) quantitative easing purchases has accelerated the percentage of negative yield bond issuance, as you can see from the chart below.
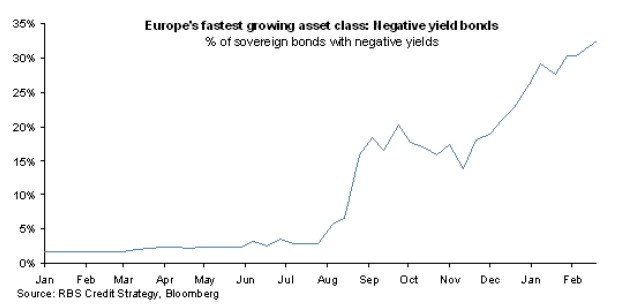
Source: FT Alphaville
Hibernating Bond Vigilantes
Dr. Ed Yardeni coined the famous phrase “bond vigilantes” to describe the group of hedge funds and institutional investors who act as the bond market sheriffs, ready to discipline any over leveraged debt-issuing entity by deliberately cratering prices via bond sales. For now, the bond vigilantes have in large part been hibernating. As long as the vigilantes remain asleep at the switch, stock investors will likely continue earning these outsized premiums.
How long will these fat equity premiums and gains stick around? A simple diet of sharp interest rate increases or P/E expansion would do the trick. An increase in the P/E ratio could come in one of two ways: 1) sustained stock price appreciation at a rate faster than earnings growth; or 2) a sharp earnings decline caused by a recessionary environment. On the bright side for the bulls, there are no imminent signs of interest rate spikes or recessions. If anything, dovish commentary coming from Fed Chairwoman Janet Yellen and the FOMC would indicate the economy remains in solid recovery mode. What’s more, a return to normalized monetary policy will likely involve a very gradual increase in interest rates – not a piercing rise as feared by many.
Regardless of whether it’s beef prices or bond prices spiking, rather than going on a crash diet, prudently allocating your money to the best relative value will serve your portfolio and stomach best over the long run.
Wade W. Slome, CFA, CFP®
Plan. Invest. Prosper.
DISCLOSURE: Sidoxia Capital Management (SCM) and some of its clients hold positions in certain exchange traded funds (ETFs), but at the time of publishing, SCM had no direct position in any other security referenced in this article. No information accessed through the Investing Caffeine (IC) website constitutes investment, financial, legal, tax or other advice nor is to be relied on in making an investment or other decision. Please read disclosure language on IC Contact page.
“Patient” Prick Proves More Pleasure than Pain

I will be the first one to admit I hate needles. In fact, I’ve been known to skip my annual flu shots out of cowardice simply to avoid the harmless prick of the syringe. The mere thought of a long needle jabbing into my arm, or other fleshy part of my body, has had the chilling effect of generating irrational decisions (i.e., I forgo flu shot benefits for no logical reason).
For months the talking heads and so-called pundits have speculated and fretted over the potential removal of the term “patient” from the periodically issued Federal Open Market Committee (FOMC) statement. Since the end of 2014, the statement read that the Fed “can be patient in beginning to normalize” monetary policy.
For investors, the linguistic fear of the removal of “patient” is as groundless as my needle fears. In the financial markets, the consensus view is often wrong. The stronger the euphoric consensus, the higher the probability the consensus will soon be wrong. You can think of technology in the late 1990s, real estate in the mid-2000s; or gold trading at $1,800/oz in 2011. The reverse holds true for the pessimistic consensus. Value guru, extraordinaire, Bill Miller stated it well,
“Stocks do not get undervalued unless somebody is worried about something. The question is not whether there are problems. There are always problems. The question is whether those problems are already fully discounted or not.”
Which brings us back to the Fed’s removal of the word “patient”. Upon release of the statement, the Dow Jones Industrial index skyrocketed about 400 points in 30 minutes. Considering the overwhelming consensus was for the Fed to remove the word “patient”, and given the following favorable factors, should anyone really be surprised that the market is trading near record highs?
FAVORABLE FACTORS:
- Queen Dove Yellen as Fed Chairwoman
- Declining interest rates near generational low
- Stimulative, low oil prices that are declining
- Corporate profits at/near record highs
- Unemployment figures approaching cyclical lows
- Core inflation in check below 2% threshold
While the short-term relief rally may feel good for the bulls, there are still some flies in the ointment, including a strong U.S. dollar hurting trade, an inconsistent housing recovery, and a slowing Chinese economy, among other factors.
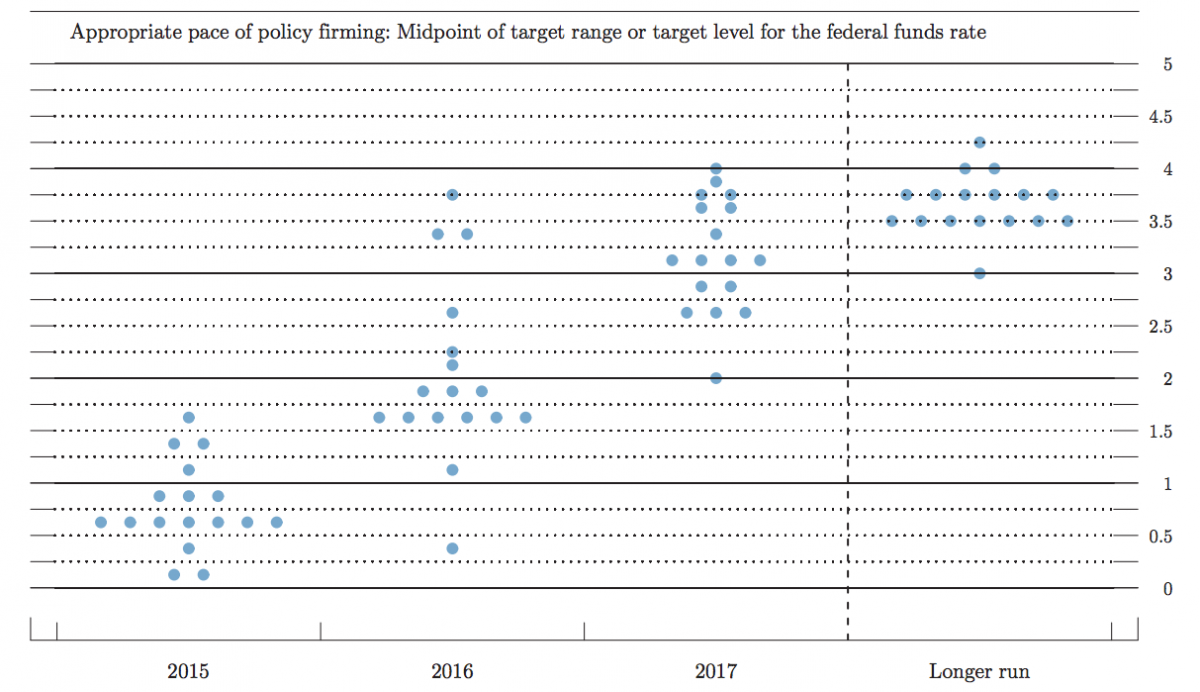
Outside the scandalous “patient” semantics was the heated debate over the Fed’s “Dot Plot,” which is just a 3rd grader’s version of showing the Fed members’ Federal Funds rate forecasts. While to a layman the chart below may look like an elementary school dot-to-dot worksheet, in reality it is a good synopsis of interest rate expectations. Part of the reason stocks reacted so positively to the Fed’s statement is because the “Dot Plot” median interest rate expectations of 0.625% came down 0.50% for 2015, and by more than 0.60% for 2016 to 1.875%. This just hammers home the idea that there are currently no dark clouds looming on the horizon that would indicate aggressive rate hikes are coming.
Source via BusinessInsider
These sub-2% interest rate expectations over the next few years hardly qualify as a “hawkish” stance. As I’ve written before, the stock market handled a 2.5% hike in stride when the Fed Funds rate increased in 1994 (see also 1994 Bond Repeat or Stock Defeat?). What’s more, the Fed Funds rate cycle peaked at 5.0% in 2007 before the market crashed in the Great Recession of 2008-2009.
Although volatility is bound to increase as the Federal Reserve transitions out of a six-year 0% interest rate policy, don’t let the irrational fear of a modest Fed hike prick scare you away from potential investment benefits.
Wade W. Slome, CFA, CFP®
Plan. Invest. Prosper.
DISCLOSURE: Sidoxia Capital Management (SCM) and some of its clients hold positions in certain exchange traded funds (ETFs), but at the time of publishing, SCM had no direct position in any other security referenced in this article. No information accessed through the Investing Caffeine (IC) website constitutes investment, financial, legal, tax or other advice nor is to be relied on in making an investment or other decision. Please read disclosure language on IC Contact page.
March Madness – Dividend Grandness & Volatility Blandness

March Madness has arrived once again. This NCAA basketball event, which has been around since 1939, begins with a selection committee choosing the top 68 teams in the country. These teams are matched up against each other through a single-elimination tournament until a national champion is throned. The stock market does not have a selection committee that picks teams from conferences like the SEC, Big East, Pac-12, and ACC, but rather millions of investors select the best investments from asset classes like stocks, bonds, real estate, commodities, venture capital, and private equity.
In the investment world, there are no win-loss records, but rather there are risk-return profiles. Investors generally migrate towards the asset classes where they find the optimal trade-off between risk and return. Speculators, day-traders, and momentum traders may define risk differently, but regardless, over the long-run, capital goes where it is treated best. And over the last six years, the U.S. stock market hasn’t been a bad place to be (the S&P 500 has about tripled).
Why such outperformance in stocks? Besides a dynamic earnings recovery from the 2008-2009 financial crisis, another major factor has been the near-0% interest rate environment. When investors are earning near nothing in their bank and savings accounts, it is perfectly rational for savers to look for riskier options, if they are compensated for that risk. In addition to loose central bank and quantitative easing policies fueling demand for stocks, rising dividends have increased the attractiveness of the stock market. In fact, as you can see from the chart below, dividends have about doubled from 2008-2009 and about tripled from the year 2000.
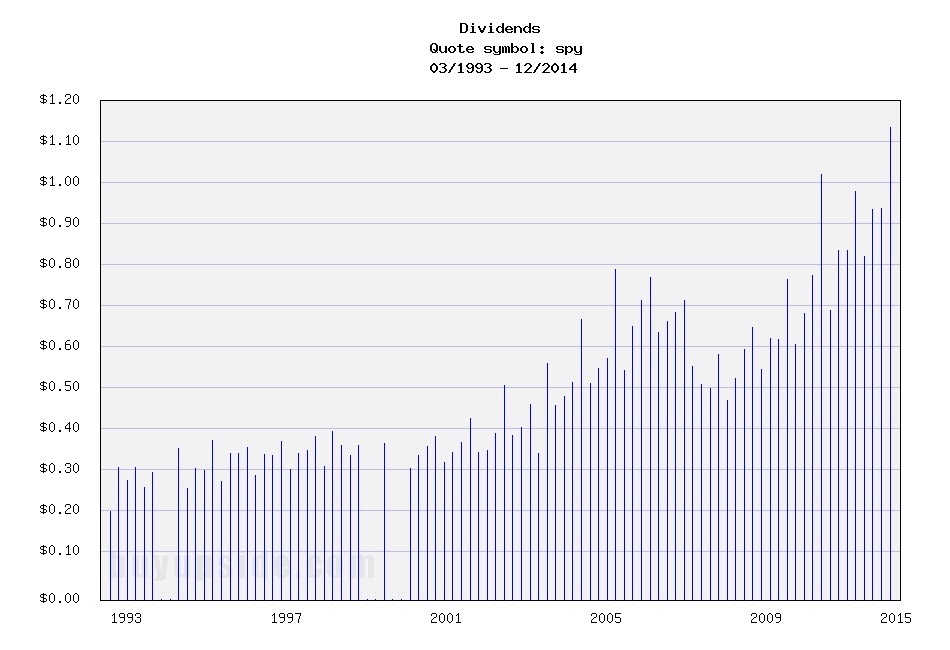
Source: Buy Upside
Stock prices have moved higher in concert with rising dividends, which, as you can see from the chart below, has kept the dividend yield flat at around 2% over the last few years. Treasury bond yields, on the other hand, have been on steady declining trend for the last 35 years. So, while coupons on newly issued bonds have been declining for virtually the last three and a half decades, stock dividends have been on a steadily upward moving rampage, excluding recessions (up +13% in the most recent reported period).
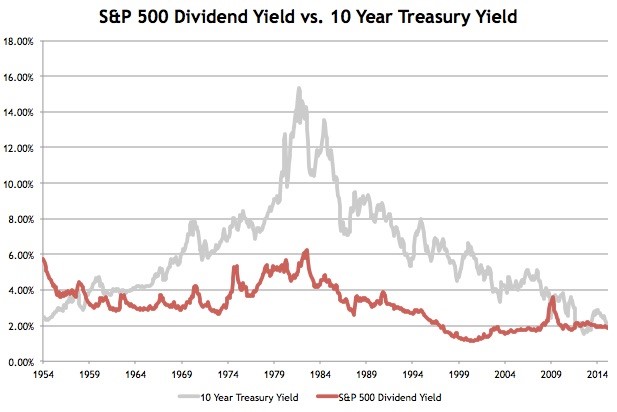
Source: Avondale Asset Management
Declining interest rates have made stocks look attractive relative to investment grade corporate bonds too as evidenced by the chart below. As you can see, over the last half-century, corporate bond yields have predominantly offered higher income yields than the earnings yield on stocks – that is not the case today.
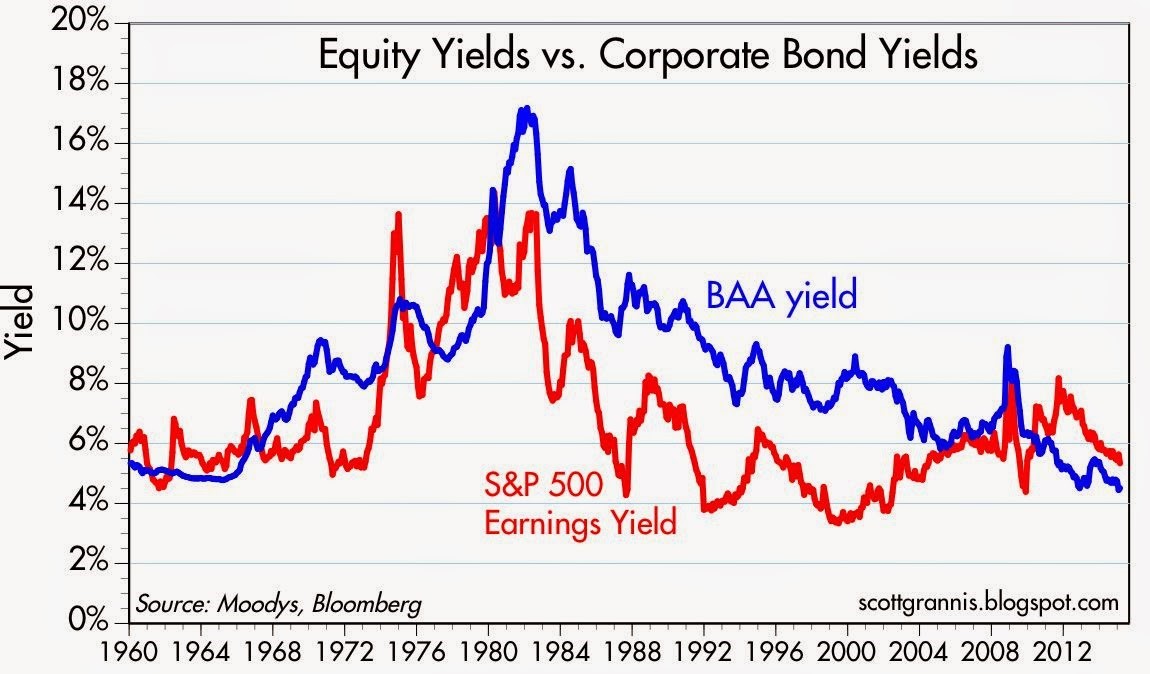
Source: Calafia Beach Pundit
What does all this stock dividend, earnings yield stuff mean? In the grand scheme of things, income starving Baby Boomers and retirees are slowly realizing that stocks in general stack up favorably in an environment in which interest payments are going down and dividend payments are going up. One of the areas highlighting the underlying demand for stocks is the Volatility Index (VIX) – a.k.a., the “Fear Gauge.” Despite Greece, Russia, ISIS, the Fed, and the Dollar dominating the headlines, the hunger for yield and growth in a declining interest rate environment is cushioning the blow during these heightened periods of volatility (see also A Series of Unfortunate Events).
Since the end of 2011, the monthly close of the VIX has stayed above its historical average of approximately 20 only two times (see chart below). In other words, over that timeframe, the VIX has remained below average about 95% of the time. When the VIX has spiked above 20, generally it has only been for brief periods, until cooler heads prevail and bargain hunters come in to buy depressed stock bargains.
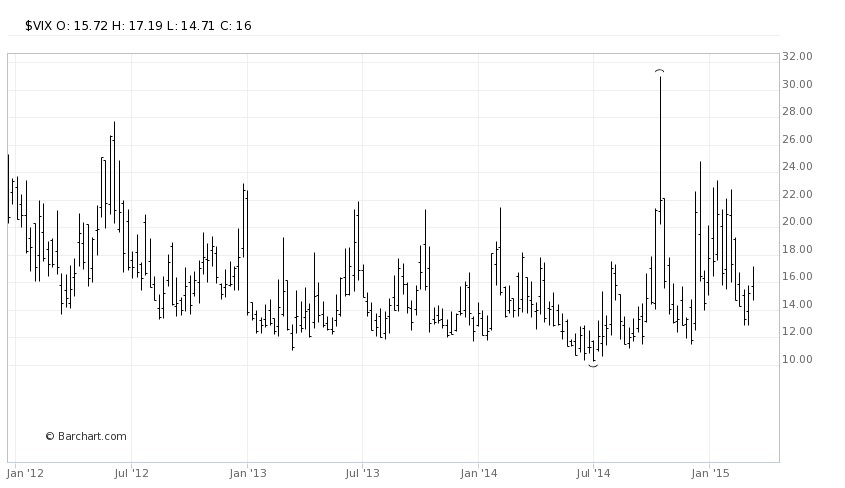
Source: Barchart
I’m not naïve enough to believe the bull market in stocks will last forever, but as long as interest rates don’t spike up and/or corporate earnings crater, underlying demand for yield should provide a floor for stocks during heightened periods of volatility. We may be in the midst of March Madness but volatility blandness is showing us that investors are paying attention to dividend grandness.
Wade W. Slome, CFA, CFP®
Plan. Invest. Prosper.
DISCLOSURE: Sidoxia Capital Management (SCM) and some of its clients hold positions in certain exchange traded funds (ETFs) and SPY, but at the time of publishing, SCM had no direct position in any other security referenced in this article. No information accessed through the Investing Caffeine (IC) website constitutes investment, financial, legal, tax or other advice nor is to be relied on in making an investment or other decision. Please read disclosure language on IC Contact page.
NASDAQ Redux

The NASDAQ Composite index once again crossed the psychologically, all-important 5,000 threshold this week for the first time since the infamous tech-bubble burst in the year 2000. Of course, naturally, the media jumped on a non-stop, multi-day offensive comparing and contrasting today’s NASDAQ vs. the NASDAQ twin of yesteryear. Rather than rehash the discussion once again, I have decided to post three articles I published in recent years on the topic covering the outperformance of the spotlighted, tech-heavy index.
NASDAQ 5,000 Irrational Exuberance Déjà Vu?

Investors love round numbers and with the Dow Jones Industrial index recently piercing 17,000 and the S&P 500 index having broken 2,000 , even novice investors have something to talk about around the office water cooler. While new all-time records are being set for the major indices during September, the unsung, tech-laden NASDAQ index has yet to surpass its all-time high of 5,132 achieved 14 and ½ years ago during March of 2000.
Click Here to Read the Rest of the Article
NASDAQ and the R&D Tech Revolution

It’s been a bumpy start for stocks so far in 2014, but the fact of the matter is the NASDAQ Composite Index is up this year and hit a 14-year high in the latest trading session (highest level since 2000). The same cannot be said for the Dow Jones Industrial and S&P 500 indices, which are both lagging and down for the year. Not only did the NASDAQ outperform the Dow by almost +12% in 2013, but the NASDAQ has also trounced the Dow by over +70% over the last five years.
Click Here to Read the Rest of the Article
NASDAQ: The Ugly Stepchild

All the recent media focus has been fixated on whether the Dow Jones Industrial Average index (“The Dow”) will close above the 13,000 level. In the whole scheme of things, this specific value doesn’t mean a whole lot, but it does make for a great topic of conversation at a cocktail party. Today, the Dow is trading at 12,983, a level not achieved in more than three and a half years. Not a bad accomplishment, given the historic financial crisis on our shores and the debacle going on overseas, but I’m still not so convinced a miniscule +0.1% move in the Dow means much. While the Dow and the S&P 500 indexes garner the hearts and minds of journalists and TV reporters, the ugly stepchild index, the NASDAQ, gets about as much respect as Rodney Dangerfield (see also No Respect in the Investment World).
Click Here to Read the Rest of the Article
Wade W. Slome, CFA, CFP®
Plan. Invest. Prosper.
DISCLOSURE: Sidoxia Capital Management (SCM) and some of its clients hold positions in certain exchange traded funds (ETFs) , but at the time of publishing, SCM had no direct position in any other security referenced in this article. No information accessed through the Investing Caffeine (IC) website constitutes investment, financial, legal, tax or other advice nor is to be relied on in making an investment or other decision. Please read disclosure language on IC Contact page.
Ceasefires & Investor Quagmires

This article is an excerpt from a previously released Sidoxia Capital Management complementary newsletter (March 1, 2015). Subscribe on the right side of the page for the complete text.
Considering the following current event headlines, who would have guessed the stock market is trading near record, all-time highs and the NASDAQ index breaking 5,000 for the first time since the year 2000?
- Russia Lies Over Ukraine Ceasefire
- ISIS Beheadings and Jihadi John
- Strong Dollar, Weak Global Economy
- Fed’s Yellen: Rate Rise & Inflation
- Iranian Negotiations & Nuclear Weapons
- Grexit: The Likelihood of Greece’s Exit from the Euro
- The Chinese Bubble Pops
- Ebola and the Fear Epidemic
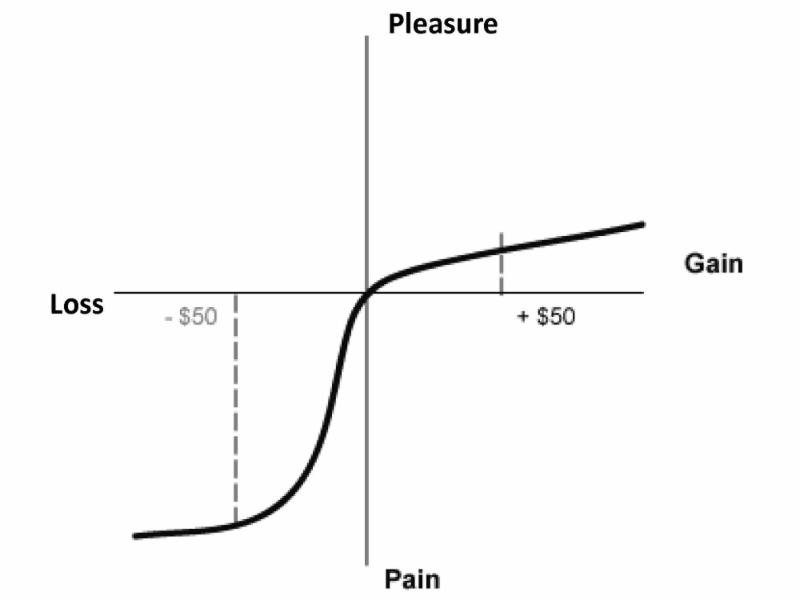
After reading all these depressing stories, I feel more like taking a Prozac pill than I do venturing into the investing world. Unfortunately, in the media world, the overarching motto driving the selection of published stories is, “If it bleeds, it leads!” Plainly and simply, bad news sells. The media outlets prey on our human behavioral shortcomings. Specifically, people feel the pain from losses at a rate more than double the feelings of pleasure (see Controlling the Lizard Brain and chart below).
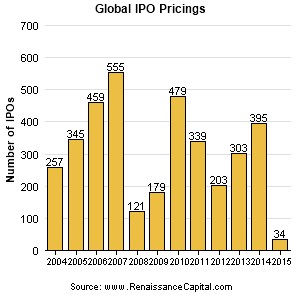
This phenomenon leaves Americans and the overall investing public choking on the daily doom and gloom headlines. Investor skepticism caused by the 2008-2009 financial crisis is evidenced by historically low stock ownership statistics and stagnant equity purchase flow data. Talk of another stock bubble has been introduced again now that the NASDAQ is approaching 5,000 again, but we are not seeing signs of this phenomenon in the IPO market (Initial Public Offering) – see chart below. IPOs are on the rise, but the number of filings is more than -50% below the peak of 845 IPOs seen in the late 1990s when former Federal Reserve Chairman Alan Greenspan made his famous “irrational exuberance” speech (see also Irrational Exuberance Deja Vu and chart below).
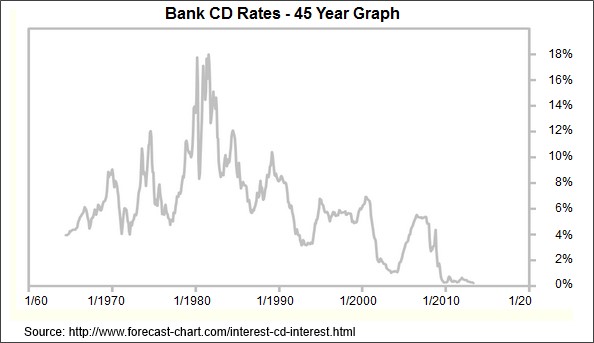
Uggh! 0.08% Really?
Compounding the never-ending pessimism problem is the near-0% interest rate environment. Times are long gone when you could earn 18% on a certificate of deposit (see chart below). Today, you can earn 0.08% on a minimum $10,000 investment in a Bank of America (BAC) Certificate of Deposit (CD). Invest at that rate for more than a decade and you will have almost accumulated a $100 (~1%) – probably enough for a single family meal…without tip. To put these paltry interest rates into perspective, the U.S. stock market as measured by the S&P 500 index was up a whopping +5.5% last month and the Dow Jones Industrials climbed +5.6% (+968 points to 18,133). Granted, last month’s S&P 500 percentage increase was the largest advance since 2011, but if I wanted to earn an equivalent +5.5% return by investing in that Bank of America CD, it would take me to age 100 years old before I earned that much!
Globally, the interest rate picture doesn’t look much prettier. In fact, the negative interest rate bonds offered in Switzerland and other neighboring countries, including France and Germany, have left investors in these bonds with guaranteed losses, if held to maturity (see also Draghi Beer Goggles).
Money Seeking Preferred Treatment
Investors and followers of mine have heard me repeatedly declare that “money goes where it is treated best.” When many investments are offering 0% (or negative yields), it comes as no surprise to me that dividend paying stocks have handily outperformed the overall bond market in recent years. Hard to blame someone investing in certain stocks offering between 2-6% in dividends when the alternative is offered at or near 0%.
While at Sidoxia we are still finding plenty of opportunities in the equity markets, I want to extend the reminder that not everyone can (or should) increase their equity allocation because of personal time horizon and risk tolerance constraints. Regardless, the current, restricting global financial markets are highlighting the scarcity of investment alternatives available.
As we will continue to be bombarded with more cease fires, quagmires and other bleeding headlines, investors will be better served by ignoring the irrelevant headlines and instead create a long-term financial plan with an asset allocation designed to meeting their personal goals. By following this strategy, you can let the dooms-dayers bleed while you succeed.

Wade W. Slome, CFA, CFP®
Plan. Invest. Prosper.
DISCLOSURE: Sidoxia Capital Management (SCM) and some of its clients hold positions in certain exchange traded funds (ETFs) and BAC, but at the time of publishing, SCM had no direct position in any other security referenced in this article. No information accessed through the Investing Caffeine (IC) website constitutes investment, financial, legal, tax or other advice nor is to be relied on in making an investment or other decision. Please read disclosure language on IC Contact page.


