Posts filed under ‘Education’
Information Choking Your Money & Mood to Misery

Source: Photobucket
On a daily basis, I make my way into the office before the market opening bell, preparing myself to gorge on a massive heaping of news stories and headlines. But scarfing down tons of tweets and hundreds of headlines is not enough. Magazines, newspapers, conference calls, blogs, presentations, conferences, interviews, television clips, and software lists are but just a few additional aspects to my steady diet of information. Like shopping down each and every aisle of the grocery store, an annoying tendency I admittedly commit, there are plenty of healthy and unhealthy items to choose from. The key is identifying the items that are the best for your financial health. After carrying out this gluttonous information-stuffing business for more than twenty years, I’ve gotten much better at separating the data wheat from information chaff. This is critical in avoiding heartburn for my Sidoxia clients and me.
One might ask, “What harmless headline or innocent anecdote could possibly cause harmful financial indigestion?” I don’t know about you, but in recent months, gobbling down these following headlines without discretion can lead to a serious case of acid reflux:
- “Stocks Tumble as Bernanke Discusses Tapering” – USA Today
- “China’s Economy is Freezing Up. How Freaked Out Should We Be?” – Washington Post
- ” ‘Suffocating in the Streets’: Chemical Weapons Attack Reported in Syria” – NBC News
- “Europe’s Zombie Banks – Blight of the Living Dead” – The Economist
- “Threats from Extremists as Egypt Slides into Turmoil” – The Times
- “Japan Market Plunge Sparks Global Sell-Off” – Los Angeles Times
I think you get the idea. No wonder investors collectively are acting like a deer in headlights, resulting in declining stock market participation – a 15-year low (see Investing Caffeine’s DMV Economy)
In the world of competitive eating, the execution of improper consumption technique can lead to a so-called “reversal of fortune,” as can be experienced by the last video on my Investing Caffeine article, Baseball and Hot Dogs. Disciplined processes are needed to prevent such an event when devouring excessive amounts of information. This is a timely topic as Joey Chestnut recently set a new world record by eating 69 hot dogs in 10 minutes.
While digesting the avalanche of daily data is quite complex, understanding the harmful consequences of doing so is quite simple. Carl Richards, a contributor writer to the The New York Times and Morningstar Advisor does a great job of outlining the detrimental impact of information consumption on investors’ wealth and happiness through minimalist charts found at BehaviorGap.com.
Here is my co-mingled version of Richards’ work:
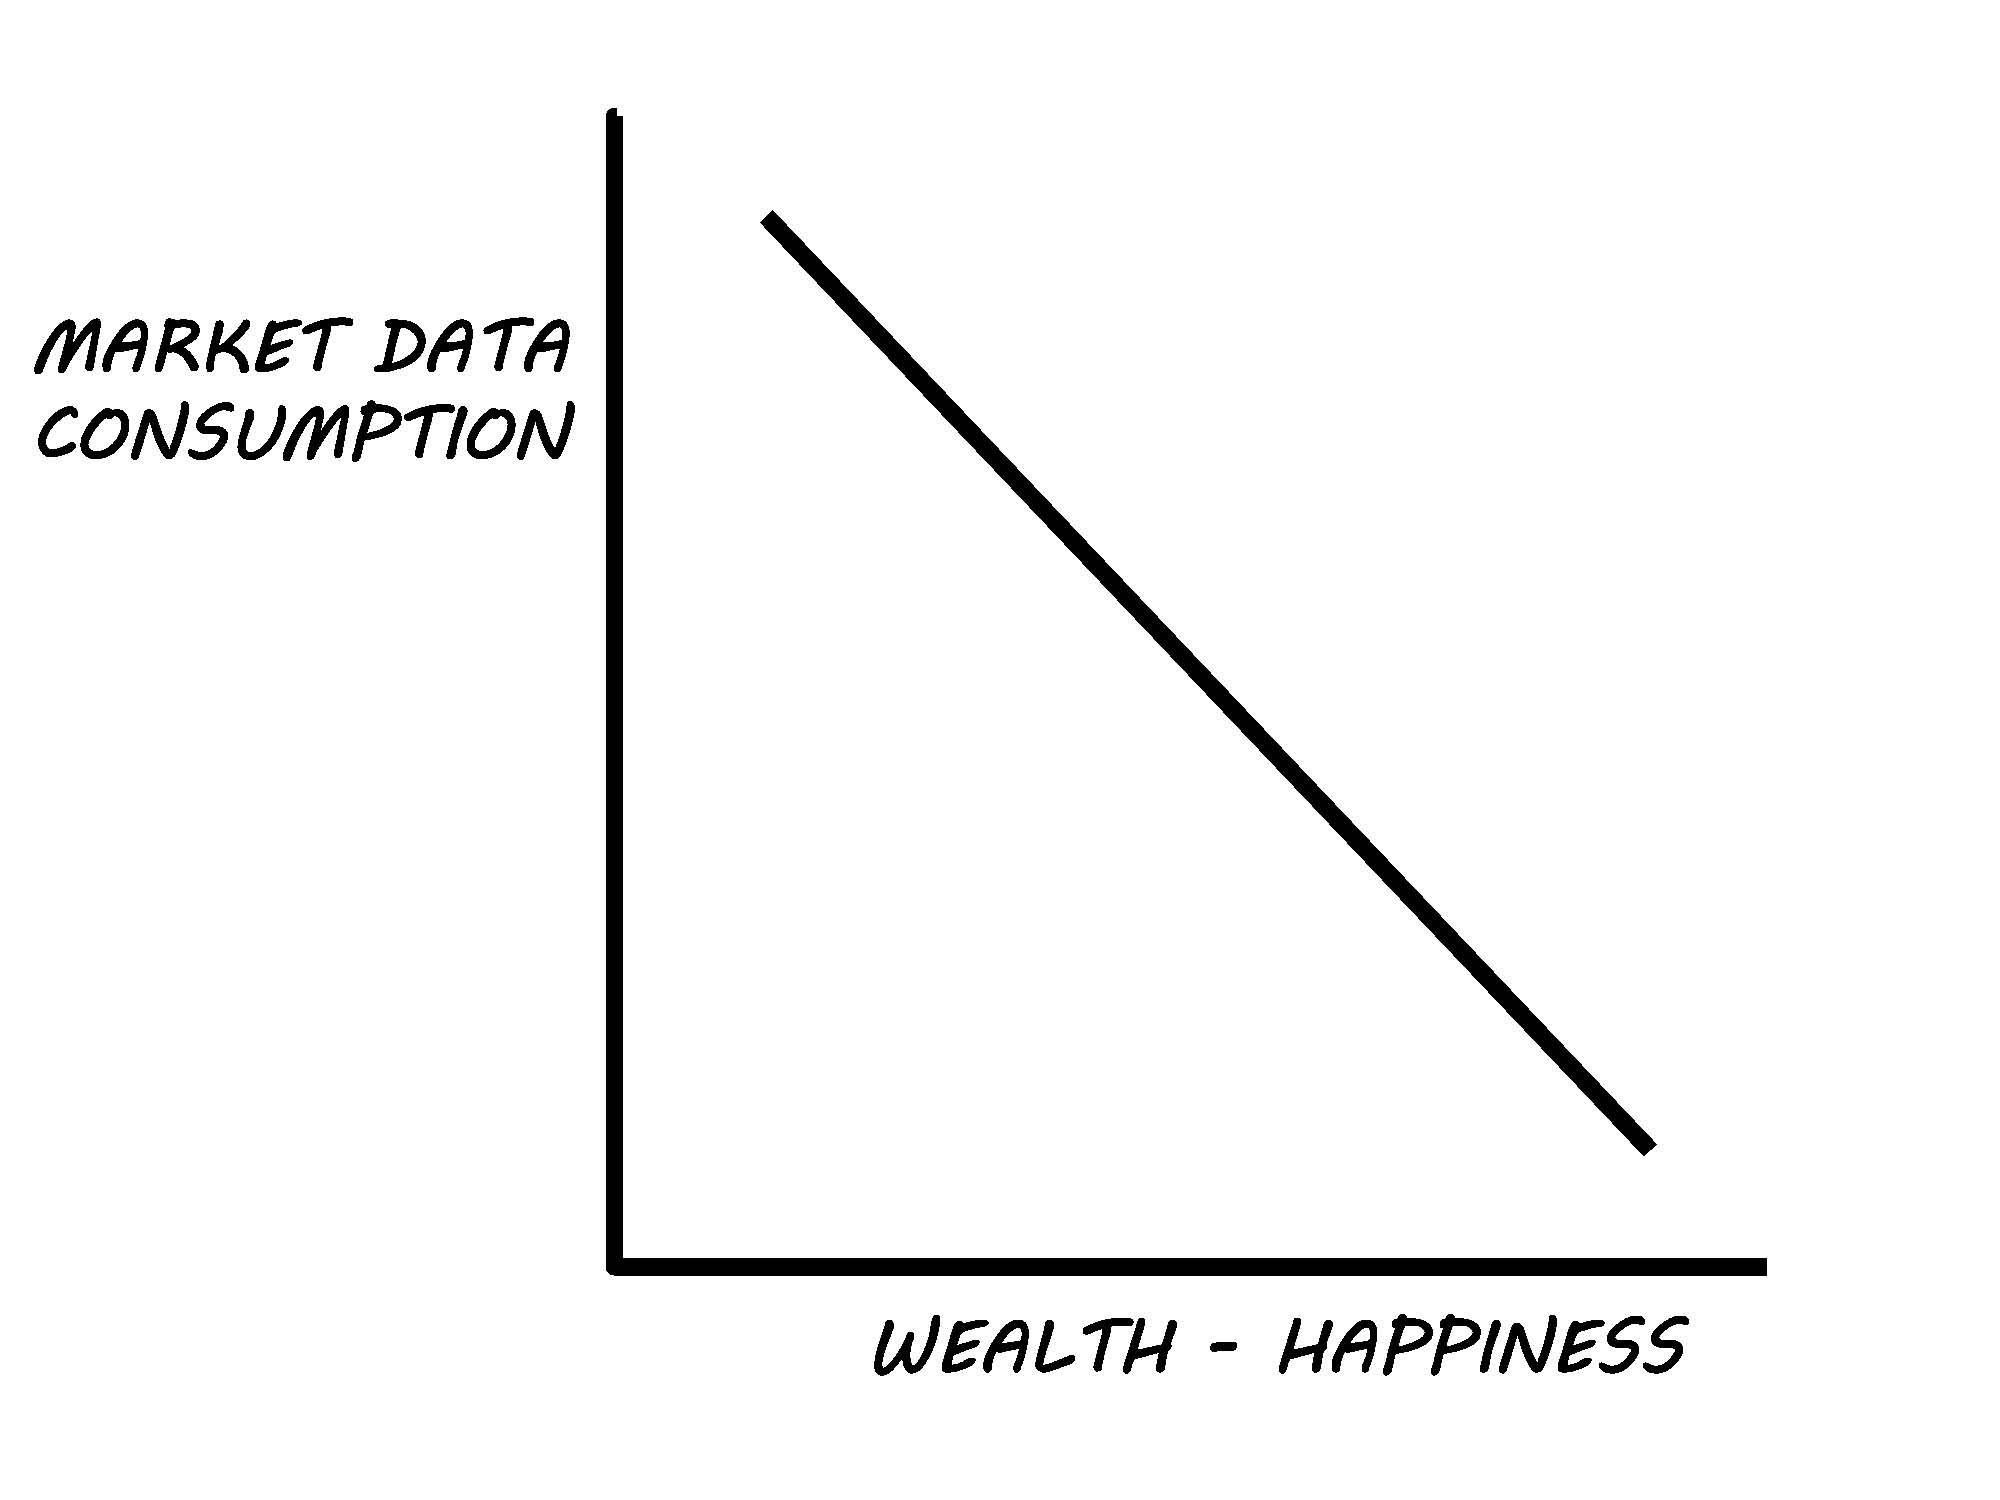
As Mark Twain said, “If you don’t read the newspaper, you are uninformed. If you do read the newspaper, you are misinformed.” It’s perfectly fine to remain current with major economic, political, and worldly events, but the consequences to overreacting to the ever-changing news flow can be disastrous to your financial and personal well-being. Managing your life savings can be stressful and if not managed correctly will damage your financial goals.
If you do not have the time, interest, or self-control to digest the massive buffet of endless information, do yourself a favor and find an experienced and trusted advisor that can assist you with the Heimlich maneuver, so you don’t choke on the infinite amount of data.
See also (Investing Caffeine: Age of Information Overload)
Wade W. Slome, CFA, CFP®
Plan. Invest. Prosper.
DISCLOSURE: Sidoxia Capital Management (SCM) and some of its clients hold positions in certain exchange traded funds (ETFs) and CMCSA, but at the time of publishing, SCM had no direct position in GCI, WPO, NYT, MORN or any other security referenced in this article. No information accessed through the Investing Caffeine (IC) website constitutes investment, financial, legal, tax or other advice nor is to be relied on in making an investment or other decision. Please read disclosure language on IC Contact page.
The Challenge of Defining Growth vs. Value

“A challenge only becomes an obstacle when you bow to it.”
― Ray Davis (Famous General in the Marines)
In the investing world, one major challenge is defining the differences between “growth” vs. “value”. Warren Buffett said it best when he described growth and value as two separate sides of the same coin. In general, low or declining growth will be valued less than a comparable company with faster growth. Often, most companies go through a life cycle just like a human would (see Equity Life Cycle). In other words, companies frequently start small, grow larger, mature, and then die. Of course, some companies never grow, or because of lack of funding or outsized losses, end up suffering an early death. It’s tough to generalize with companies, because some businesses are more cat-like than human. For example, Apple Inc. (AAPL) may not have had nine lives, but the stock has been left for dead several times during its lifespan, before managing to resurrect itself from value status to growth darling (with a little assistance from Steve Jobs). Whether Tim Cook can lead Apple back to the Promised Land of growth remains to be seen, but many investors still see value.
Fluctuating price and earnings trends over a company’s life cycle frequently create confusion surrounding the proper categorization of a stock as growth or value. The other frustrating aspect to this debate is the absence of a universally accepted definition of growth and value. A few specialty companies have chosen to address this challenge. Russell Investments in Seattle, Washington is a leader in the benchmark/index creation field. Russell tackles the definitional issue by creating quantitatively based definitions, tediously explained in a thrilling 44-page paper titled, “Construction and Methodology.” Here is an exhilarating excerpt:
“Russell Investments uses a ‘non-linear probability’ method to assign stocks to the growth and value style valuation indexes. Russell uses three variables in the determination of growth and value. On the value side, book-to-price is used, while on the growth side, the I/B/E/S long-term growth variable was replaced by two variables- I/B/E/S forecast medium-term growth (2 yr) and sales per share historical growth (5 yr).”
As I bite my tongue in sarcasm, I like to point out that these methodologies constantly change – Russell most recently changed their methodology in 2011. What’s more, there are numerous other indexing companies that define growth and value quite differently (e.g., Standard & Poor’s, Lipper, MSCI, etc.).
Like religious beliefs that are viewed quite differently and are prone to passionate arguments, so too can be the debates over growth vs. value categorization. I’ve been brainwashed by numerous great investors (see Investor Hall Fame), and underpinning my philosophy is the belief that price follows earnings (see It’s the Earnings Stupid). As a result, I am constantly on the lookout for attractively priced stocks that have strong growth prospects. If Russell or S&P looked under the hood of my client portfolios, I’m certain they would find a healthy mix of growth and value stocks, as they define it. If they looked in Warren Buffett’s portfolio, arguably similar conclusions could be made. Most observers call Buffett a value investor, but over Buffett’s career, he has owned some of the greatest growth stocks of all-time (e.g., Coca Cola (KO), American Express Co (AXP), and Procter & Gamble (PG)).
At the end of the day, expectations embedded in the value of share prices determine future appreciation or depreciation, depending on how actual results register relative to those expectations. If stock prices are too high (as measured by the P/E, Price/Free-Cash-Flow, or other valuation metrics), slowing growth can lead to sharp and painful price declines. On the flip side, cheap or reasonably priced stocks can experience significant price appreciation if earnings and cash flows sustainably improve or accelerate.
In my view, the greatest stock pickers think about investing like sports handicapping (see What Happens in Vegas, Stays in Las Vegas). The key isn’t buying fast growth (high P/E) or slow growth (low P/E) companies, but rather discovering which stocks are mispriced. Finding heavily shorted stocks that are poised for growth, or discovering unloved stocks with underappreciated potential are both ways to make money.
While defining growth vs. value is certainly difficult, the more important challenge is calibrating a company’s future growth expectations and determining the fair price to pay for a stock based on those prospects. Investing entails many difficulties, but categorizing investors or stocks as growth or value is a less important challenge than honing forecasting and valuation skills. Investing is challenging enough without worrying about superfluous growth vs. value definitions.
Wade W. Slome, CFA, CFP®
Plan. Invest. Prosper.
DISCLOSURE: Sidoxia Capital Management (SCM) and some of its clients hold positions in certain exchange traded funds (ETFs), and AAPL, but at the time of publishing SCM had no direct position in KO, AXP, PG, MHP, or any other security referenced in this article. No information accessed through the Investing Caffeine (IC) website constitutes investment, financial, legal, tax or other advice nor is to be relied on in making an investment or other decision. Please read disclosure language on IC Contact page.
Time to Trade in the Investment Tricycle

This article is an excerpt from a previously released Sidoxia Capital Management’s complementary newsletter (May 1, 2013). Subscribe on the right side of the page for an entire monthly update.
As the stock market continues to set new, all-time record highs and the Dow Jones Industrial index nears another historic milestone (15,000 level), investors remain cautiously skeptical of the rebound – like a nervous toddler choosing to ride a tricycle instead of a bicycle. Investors have been moving slowly, but stock prices have not – the Dow has risen +13% in 2013 alone. What’s more, over the last four years the S&P 500 index (which represents large companies) has climbed +140%; the S&P 400 (mid-sized companies) +195%; and the S&P 600 (small-sized companies) +200%.
The gains have been staggering, but like the experience of riding a bicycle, the bumps, scrapes, and bruises suffered during the 2008-2009 financial crash have caused investors to abandon their investment bikes for a perceived safer vehicle…a tricycle. What do I mean by that? Well, over the last six years, investors have pulled out more than -$521,000,000,000 from stock funds and piled those proceeds into bonds (Calafia Beach Pundit chart below). For retirees and billionaires this strategy may make sense in certain instances. But for millions of others, interest rate risk, inflation risk, and the risk of outliving your money can be more hazardous to financial well-being, than the artificially perceived safety expected from bonds. The fact of the matter is investing inefficiently in cash, money markets, CDs, and low-yielding fixed income securities can be riskier in the long-run than a globally diversified portfolio invested across a broad set of asset classes (including equities). The latter should be the strategy of choice, unless of course you are someone who yearns to work at Wal-Mart (WMT) as a greeter in your 80s!

Investor Training Wheels
 I don’t want to irresponsibly flog everyone, because investing attitudes have begun to change a little in 2013, as investors have added $66 billion to stock funds (data from ICI). Effectively, some investors have gone from riding their tricycle to hopping on a bike with training wheels. With this change in mindset, surely people have commenced selling bonds to buy stocks, right? Wrong! Investors have actually bought more bonds (+$69 billion) than stocks in the first three months of the year, which helps explain why interest rates on the 10-year Treasury are only yielding a paltry 1.67% (near last year’s record summer low) – remember, bond buying causes interest rates to go down. If you really want to do research, you could ask your parents when rates were ever this low, but some readers’ parents may not even had been born yet. The previous record low in interest rates, according to Bloomberg, at 1.95% was achieved in 1941.
Over the last five years the news has been atrocious, and as we have proven, investing based off of current headlines is a horrible investment strategy. As we’ve seen firsthand, there can be very long, multi-year periods when stock performance has absolutely no correlation with the positive or negative nature of news reports. To better make my point, I ask you, what types of headlines have you been reading over the last four years? I can answer the question for you with a few examples. For starters, we’ve endured financial collapses in Iceland, Ireland, Dubai, Greece, and now Cyprus. At home domestically, we’ve experienced a “flash crash” that temporarily evaporated about $1 trillion dollars in value (and 1,000 Dow points) within a few minutes due to high frequency algorithmic traders. How about unemployment data? We’ve witnessed the slowest, jobless U.S. recovery in a generation (since World War II), and European countries have it much worse than we do (e.g., Spain just registered a 27% unemployment rate). What about political gridlock and brinksmanship? We’ve seen debt ceiling stand-offs lead to a historic loss of our country’s AAA debt status; a partisan presidential election; a deafening fiscal cliff debate; and now mindless sequestration. Nevertheless, large cap stocks and small cap stocks have more than doubled and tripled, respectively.
Fear sells advertising, and sounds smarter than “everything is rosy,” but the fact remains, things are not as bad as many bears claim. Corporations are earning record profits, and hold trillions in cash (e.g., Apple Inc.’s recent announcement of more than $50 billion in share repurchase and $11 billion in annual dividend payments are proof). Moreover, central banks around the globe are doing whatever it takes to stimulate growth – most recently the Bank of Japan promised to inject $1.4 trillion into its economy by the end of 2014, in order to kick-start expansion. Lastly, the U.S. employment picture continues to improve, albeit slowly (7.6% unemployment in March), allowing consumers to pay down debt, buy more homes, and spend money to spur economic growth.
Dangers of Being Informed
 Hopefully this clarifies how useless and futile newspaper headlines are when it comes to effective investing. As Mark Twain astutely noted, “If you don’t read the newspaper, you are uninformed. If you do read the newspaper, you are misinformed.” It’s perfectly fine to remain in tune with current events, but shuffling around your life’s savings based on this information is a foolish plan.
If the concerns and worries du jour have you nervously riding a tricycle, just realize that you may not reach your investment destination with this mode of transportation. I understand that it is not all hearts and flowers in the financial markets, and there are plenty of legitimate risks to consider. However, excessive exposure in low-rate asset classes may be riskier than many realize. If you’re still riding your investment tricycle, you’re probably better off by grabbing a helmet and pads (i.e., globally diversified portfolio) and jumping on a bike – you are more likely to reach your financial destination.
Wade W. Slome, CFA, CFP®
Plan. Invest. Prosper.
DISCLOSURE: Sidoxia Capital Management (SCM) and some of its clients hold positions in certain exchange traded funds (ETFs), WMT and AAPL, but at the time of publishing SCM had no direct position in any other security referenced in this article. No information accessed through the Investing Caffeine (IC) website constitutes investment, financial, legal, tax or other advice nor is to be relied on in making an investment or other decision. Please read disclosure language on IC Contact page.
Organizing Your Investment Basket

With the Easter bunny relaxing after a busy holiday, kids from all over are given the task of organizing the candy and money collected during their hunts. Investors are also constantly reminded that their portfolio eggs should not be solely placed in one basket either. Instead, investors are told to diversify their investments across a whole host of asset classes, geographies, styles, and sizes. In other words, this means investors should be spreading their money across commodity, real estate, international, emerging market, value, growth, small-cap, and large-cap investments. As Jason Zweig, journalist from a the Wall Street Journal points out, much of the diversification benefits can be achieved with relatively small change in the position count of a portfolio:
“As many studies have shown, at least 40% of the variability in returns can be reduced by moving from a single company to 20. Once a portfolio contains 20 or 30 stocks, adding more does little to damp the fluctuations in wealth over time.”
But wait. Going from one banking stock to 20 banking stocks is not going to provide you with the proper diversification you want or need. Rather, what is as important as investing across asset class, geography, style, and size, is to follow the individual stock strategies of guru Peter Lynch. In order to put his performance into perspective, Lynch’s Fidelity Magellan fund averaged +29% per year from 1977 – 1990 – almost doubling the return of the S&P 500 index for that period.
More specifically, to achieve these heroic returns, Lynch divided the stocks in his fund into the following categories:
Slow Growers: This group of stocks wasn’t Lynch’s favorite because these companies typically operate in mature industries with limited expansion opportunities. For these single-digit EPS growers, Lynch focused more on identifying high dividend-paying stocks that were trading at attractive valuations. In particular, he paid attention to a dividend-adjusted PEG ratio (Price-to-Earnings Growth). A utility company would be an example of a “Slow Grower.”
Stalwarts: These are large established companies that still have the ability to achieve +10% to +12% annual earnings growth regardless of the economic cycle. Lynch liked these stocks especially during recessions and downturns. Valuations are still very important for Stalwarts, and many of them pay dividends. An investor may not realize a “home run” with respect to returns, but a +30% to 50% return over a few years is not out of the question, if selected correctly. Former examples of “Stalwarts” include Coca Cola (KO) and Procter & Gamble (PG).
Fast Growers: This categorization applies to small aggressive firms averaging about +20% to +25% annual earnings growth. While “Fast Growers” offer the most price appreciation potential, these stocks also offer the most risk, especially once growth/momentum slows. If timed correctly, as Lynch adeptly achieved, these stocks can increase multi-fold in value. The great thing about these “Fast Growers” is they don’t have to reside in fast growth industries. Lynch actually preferred market share gainers in legacy industries.
Cyclicals: These companies tend to see their sales and profits rise and fall with the overall economic cycle. The hyper-sensitivity to economic fluctuations makes the timing on these stocks extremely tricky, leading to losses and tears – especially if you get in too late or get out too late. To emphasize his point, Lynch states, “Cyclicals are like blackjack: stay in the game too long and it’s bound to take all your profit.” The other mistake inexperienced investors make is mistaking a “Cyclical” company as a “Stalwart” at the peak of a cycle. Examples of cyclical industries include airline, auto, steel, travel, and chemical industries.
Turnarounds: Lynch calls these stocks, “No Growers,” and they primarily of consist of situations like bail-outs, spin-offs, and restructurings. Unlike cyclical stocks, “Turnarounds” are usually least sensitive to the overall market. Even though these stocks are beaten down or depressed, they are enormously risky. Chyrysler, during the 1980s, was an example of a favorable Lynch turnaround.
Asset Plays: Overlooked or underappreciated assets such as real estate, oil reserves, patented drugs, and/or cash on the balance sheet are all examples of “Asset Plays” that Lynch would consider. Patience is paramount with these types of investments because it may take considerable time for the market to recognize such concealed assets.
Worth noting is that not all stocks remain in the same Lynch category. Apple Inc. (AAPL) is an example of a “Fast Grower” that has migrated to “Stalwart” or “Slow Grower” status, therefore items such as valuation and capital deployment (dividends and share buyback) become more important.
Peter Lynch’s heroic track record speaks for itself. Traditional diversification methods of spreading your eggs across various asset class baskets is useful, but this approach can be enhanced by identifying worthy candidates across Lynch’s six specific stock categories. Hunting for these winners is something Lynch and the Easter bunny could both agree upon.
Wade W. Slome, CFA, CFP®
Plan. Invest. Prosper.
DISCLOSURE: Sidoxia Capital Management (SCM) and some of its clients hold positions in certain exchange traded funds (ETFs) and AAPL, but at the time of publishing SCM had no direct position in KO, PG, Chrysler, Fidelity Magellan, or any other security referenced in this article. No information accessed through the Investing Caffeine (IC) website constitutes investment, financial, legal, tax or other advice nor is to be relied on in making an investment or other decision. Please read disclosure language on IC Contact page.
Damned if You Do, and More Damned if You Don’t

Source: Photobucket
In the stock market you are damned if you do, and more damned if you don’t.
There are a million reasons why the market should or can go down, and the press, media, and bears come out with creative explanations every day. The “Flash Crash,” debt ceiling debate, credit downgrades, elections, and fiscal cliff were all credible events supposed to permanently crater the market. Now we have higher taxes (capital gains, income, and payroll), sequester spending cuts, and a nagging recession in Europe. What’s more, the pessimists point to the unsustainable nature of elevated corporate profit margins, and use the ludicrous Robert Shiller 10-year Price-Earnings ratio as evidence of an expensive market (see also Foggy Rearview Mirror). If an apple sold for $10 ten days ago and $0.50 today, would you say, I am not buying an apple today because the 10-day average price is too high? If you followed Robert Shiller’s thinking, this logic would make sense.
Despite the barrage of daily concerns and excuses, the market continues to set new record highs and the S&P 500 is up by more than +130% since the 2009 lows – just a tad higher than the returns earned on cash, gold, and bonds (please note sarcasm). Cash has trickled into equities for the first few months of 2013 after years of outflows, but average investors have only moved from fear to skepticism (see also Investing with the Sentiment Pendulum ). With cash and bonds earning next to nothing; gold underperforming for years; and inflationary pressures eroding long-term purchasing power, the vice is only squeezing tighter on the worrywarts.
Are there legitimate reasons to worry? Certainly, and the opportunities are not what they used to be a few years ago (see also Missing the Pre-Party). Although an endangered species, long-term investors understand backwards looking economic news is useless. Or as Peter Lynch wisely stated, “If you spend 13 minutes a year on economics, you’ve wasted 10 minutes.” The fact remains that the market is up 70% of the time, on an annual basis, and has been a great place to beat inflation over time. It’s a tempting endeavor to avoid the down markets that occur 30% of the time, but those who try to time the market fail miserably over the long-run (see also Market Timing Treadmill).
Equity investors would be better served by looking at their investment portfolios like real estate. Homeowners implicitly know the value of their home changes on a daily basis, but there are no accurate, real-time quotes to reference your home value on a minute by minute basis, as you can with stocks. Most property owners know that real estate is a cyclical asset class that is not impacted by daily headlines, and if purchased at a reasonable price, will generally go up in value over many years. Unfortunately, for many average investors, equity portfolios are treated more like gambling bets in Vegas, and get continually traded based on gut instincts.
Volatility is at six-year lows, and investors are getting less uncomfortable with owning stocks. Although everybody and their mother has been waiting for a pullback (myself included), don’t get too myopically focused. For the vast majority of investors, who should have more than a ten year time horizon, you should understand that volatility is normal and recessions will cause stocks to gown significantly, twice every ten years on average. If you are a long-term investor, like you should be, and you understand these dynamics, then you will also understand that you will be more damned if you don’t invest in equities as part of a diversified portfolio.
Wade W. Slome, CFA, CFP®
Plan. Invest. Prosper.
DISCLOSURE: Sidoxia Capital Management (SCM) and some of its clients hold positions in certain exchange traded funds (ETFs), but at the time of publishing SCM had no direct position in any other security referenced in this article. No information accessed through the Investing Caffeine (IC) website constitutes investment, financial, legal, tax or other advice nor is to be relied on in making an investment or other decision. Please read disclosure language on IC Contact page.
Fine Tuning Your Stock Fishing Skills

If you are one of those fishing hobbyists crowded among a large group while hunting for a big fish, mathematics dictates your odds of reeling in a grand prize are significantly diminished. Expert fishermen are generally the first to arrive because they understand once the masses appear the opportunities will disappear. Like big fish, colossal stocks are rarely discovered by a large herd of investors. Financial bubbles occur in this manner, however these periods are usually short-lived and the investor pack often ends up losing more money on the way down relative to the profits earned on the way up. Successful investors are usually the ones following a disciplined systematic approach that is often contrarian in nature. In other words, not chasing performance requires patience, an elusive quality in these fast-paced, frenetic financial markets.
More prevalent in these markets are impulsive day-traders, unruly high frequency traders, and tempestuous hedge funds. Why own stocks, if you can rent them? Like a fisherman who constantly casts his/her bait in and out of the water, a short-sighted investor cannot realize outsized gains, unless the bait is given sufficient time to lure (find) the next winning idea.
Like many professions, experts often optimally mix the quantitative science and behavioral art of their craft. Whether it’s a teacher, doctor, accountant, attorney, or bus driver, the people who excel in their profession are the ones who move beyond the statistical and procedural basics of their trade. Practicing and understanding the nuts and bolts of your job is important, but developing those intangible, artistic skills only comes with experience. Unfortunately, many investing hobbyists don’t appreciate these artistic nuances and as a result go on destroying their portfolios, even though they act as if they were experts.
On the flip-side, decisions purely based on gut instincts will also lead to sub-par outcomes. The fisherman who does not account for the wind, temperature, geography, light, and seasonal differences will be at a distinct disadvantage to those who have studied these scientific factors.
In the fishing world, there is no miracle GPS device that will guide fish onto your hook, and the same is true for stocks. No software package or technical pattern will be a panacea for profits, however having some type of scientific tool to assist in the identification of investment opportunities should be exploited to its fullest. For us at Sidoxia Capital Management (www.Sidoxia.com), our tool is called SHGR (pronounced “SUGAR”), or Sidoxia Holy Grail Ranking. The name was created tongue-in-cheek; however its purpose is crucial. Following a quantitative system like SHGR ensures that a healthy dosage of discipline and objectivity is factored into our investment decisions, so inherent biases do not creep into our process and detract from performance. Specifically, our proprietary SHGR model incorporates multiple factors, including valuation, growth, sentiment indicators, profitability, and other qualitative measurements.
Although we use a “Holy Grail” ranking system, the fact of the matter is there are none in existence – for fishermen or investors. Experience teaches us the best opportunities are found where few are looking, and if proper quantitative tools are integrated into a multi-pronged process, then you will be uniquely positioned to catch a big fish.
Wade W. Slome, CFA, CFP®
Plan. Invest. Prosper.
DISCLOSURE: Sidoxia Capital Management (SCM) and some of its clients hold positions in certain exchange traded funds (ETFs) and CMCSA, but at the time of publishing SCM had no direct position in BRKB, HNZ, HRL, UL, T, VZ, CAR, ZIP, AMR, LCC, ORCL, APKT, DELL, MSFT, RDSA, Repsol, ODP, OMX, HLF, BUD, STZ, GE, or any other security referenced in this article. No information accessed through the Investing Caffeine (IC) website constitutes investment, financial, legal, tax or other advice nor is to be relied on in making an investment or other decision. Please read disclosure language on IC Contact page.
Monitoring the Tricks Hidden Up Corporate Sleeves

As Warren Buffett correctly states, “If you are in a poker game and after 20 minutes, you don’t know who the patsy is, then you are the patsy.” The same principle applies to investing and financial analysis. If you are unable to determine who is cooking (or warming) the books via deceptive practices, then you will be left holding a bag of losses as tears of regret pour down your face. The name of the stock investing game (not speculation game) is to accurately gauge the financial condition of a company and then to correctly forecast the trajectory of future earnings and cash flows.
Unfortunately for investors, many companies work quite diligently to obscure, hide, and distort the accuracy of their current financial condition. Without the ability of making a proper assessment of a company’s financials, an investor by definition will be unable to value stocks.
There are scores of accounting tricks that companies hide up their sleeves to mislead investors. Many people consider GAAP (Generally Accepted Accounting Principles) as the laws or rules governing financial reporting, but GAAP parameters actually provide companies with extensive latitude in the way accounting reports are implemented. Here are a few of the ways companies exercise their wiggle room in disclosing financial results:
Depreciation Schedules: Related to GAAP accounting, adjustments to longevity estimates by a company’s management team can tremendously impact a company’s reported earnings. For example, if a $10 million manufacturing plant is expected to last 10 years, then the depreciation expense should be $1 million per year ($10m ÷ 10 years). If for some reason the Chief Financial Officer (CFO) suddenly changes his/her mind and decides the building should last 40 years rather than 10 years, then the company’s annual expense would miraculously decrease -75% to $250,000. Voila, an instant $750,000 annual gain created out of thin air! Other depreciation tricks include the choice of accelerated or straight-line depreciation.
Capitalizing Expenses: If you were a management team member with a goal of maximizing current reported profitability, would you be excited to learn that you are not required to report expenses on your income statement? For many the answer is absolutely “yes”. A common example of this phenomenon occurs with companies in the software industry (or other companies with heavy research and development), where research expenses normally recognized on the income statement get converted instead to capitalized assets on the balance sheet. Eventually these capitalized assets get amortized (recognized as expenses) on the income statement. Proponents argue capitalizing expenses better matches future revenues to future expenses, but regardless, this scheme boosts current reported earnings, and delays expense recognition.
Stuffing the Channel: No, this is not a personal problem, but rather occurs when companies force their goods on a distributor or customer – even if the goods (or service) are not requested. This deceitful practice is performed to drive up short-term revenue, even if the reporting company receives no cash for the “stuffing”. Ballooning receivables and substandard cash flow generation can be a sign of this cunning, corporate custom.
Accounts Receivable/Loans: Ballooning receivables is a potential sign of juiced reported revenues and profits, but there are more nuanced ways of manipulating income. For instance, if management temporarily lowers warranty expenses and product return assumptions, short-term profits can be artificially boosted. In addition, when discussing financial figures for banks, loans can also be considered receivables. As we experienced in the last financial crisis, many banks under-provisioned for future bad loans (i.e. didn’t create enough cash reserves for misled/deadbeat borrowers), thereby overstating the true, underlying, fundamental earnings power of the banks.
Inventories: As it relates to inventories, GAAP accounting allows for FIFO (First-In, First-Out) or LIFO (Last-In, Last-Out) recognition of expenses. Depending on whether prices of inventories are rising or falling, the choice of accounting method could boost reported results.
Pension Assumptions: Most companies like their employees…but not the expenses they have to pay in order to keep them. Employee expenses can become excessively burdensome, especially for those companies offering their employees a defined benefit pension plan. GAAP rules mandate employers to contribute cash to the pension plan (i.e., retirement fund) if the returns earned on the assets (i.e., stocks & bonds) are below previous company assumptions. One temporary fix to an underfunded pension is for companies to assume higher plan returns in the future. For example, if companies raise their return assumptions on plan assets from 5% to a higher rate of 10%, then profits for the company are likely to rise, all else equal.
Non-GAAP (or Pro Forma): Why would companies report Non-GAAP numbers on their financial reports rather than GAAP earnings? The simple answer is that Non-GAAP numbers appear cosmetically higher than GAAP figures, and therefore preferred by companies for investor dissemination purposes.
Merger Magic: Typically when a merger or acquisition takes place, the acquiring company announces a bunch of one-time expenses that they want investors to ignore. Since there are so many moving pieces in a merger, that means there is also more opportunities to use smoke and mirrors. The recent $8.8 billion write-off of Hewlett-Packard’s (HPQ) acquisition of Autonomy is evidence of merger magic performed.
EBITDA (Earnings Before Interest Taxes Depreciation & Amortization): Skeptics, like myself, call this metric “earnings before all expenses.” Or as Charlie Munger says, Warren Buffett’s right-hand man, “Every time you see the word EBITDA, substitute it with the words ‘bulls*it earnings’!”
This is only a short-list of corporate accounting gimmicks used to distort financial results, so for the sake of your investment portfolio, please check for any potential tricks up a company’s sleeve before making an investment.
Wade W. Slome, CFA, CFP®
Plan. Invest. Prosper.
DISCLOSURE: Sidoxia Capital Management (SCM) and some of its clients hold positions in certain exchange traded funds (ETFs), but at the time of publishing SCM had no direct position in HPQ/Autonomy, or any other security referenced in this article. No information accessed through the Investing Caffeine (IC) website constitutes investment, financial, legal, tax or other advice nor is to be relied on in making an investment or other decision. Please read disclosure language on IC Contact page.
Fence-Sitting: The Elusive Art of More Data and Pullbacks

The world of financial markets is full of fence-sitters, especially in the professional realm. Why? Well, for starters, fence-sitting provides the luxury of never being wrong. If fence-squatting observers do nothing and provide no opinions, then they cannot by definition be wrong or mistaken. Why should a professional put their neck out for an economic, sector, or investment specific forecast, if there is a potential of looking stupid or losing a job?
For many, the consequences of possibly being wrong feel so horrendous that participants choose instead to sit on the non-committal fence. In most cases, the fence posts on any financial issue or investment align along the comfort of consensus thinking. Unfortunately, consensus thinking has a limited shelf life, because the views held by the majority are constantly changing. Repeatedly modifying personal opinions to match consensus views may prevent the bruising of egos, however, this naïve strategy can be destructive to long-term returns. Here are a few examples:
2000
Consensus View: New Normal tech stocks will continue explosive growth; Consensus Outcome: Wrong; Investor Net Result: Losses and/or Lost Profits.
2006
Consensus View: Home prices will rise forever and leverage is beautiful; Consensus Outcome: Wrong; Investor Net Result: Losses and/or Lost Profits.
2010
Consensus View: Greece and European collapse to cause a double-dip global recession; Consensus Outcome: Wrong; Investor Net Result: Losses and/or Lost Profits.
2011
Consensus View: U.S. credit downgrade will be bad for Treasuries and rates; Consensus Outcome: Wrong; Investor Net Result: Losses and/or Lost Profits.
2012
Consensus View: Uncertainty surrounding election bad for equities; Consensus Outcome: Wrong; Investor Net Result: Losses and/or Lost Profits.
2012
Consensus View: China’s slowing growth and real estate bubble expected to cause a global double-dip recession; Consensus Outcome: Wrong; Investor Net Result: Losses and/or Lost Profits.
2012
Consensus View: Impending fiscal cliff bad for equities; Consensus Outcome: Wrong; Investor Net Result: Losses and/or Lost Profits.
2013
Consensus View: Debt ceiling debate bad for equities; Consensus Outcome: ???; Investor Net Result: ???.
2013
Consensus View: Looming sequestration bad for equities; Consensus Outcome: ???; Investor Net Result: ???.
In recent years the market has continued to climb a wall of worry, but will this year be different? We shall soon see.
Placing the concern du jour aside, if consensus fears coalesce around a specific upcoming event, chances are that particular issue is already factored into existing expectations and price structures. Therefore, rather than wasting personal “worry” bandwidth on those fears, investor anxiety should be dedicated to less prevalent but potentially more impactful unknown concerns. Or if you need clarification about the unknowns to worry about, perhaps Donald Rumsfeld can clarify the situation by highlighting the risk of “unknown unknowns”:
I Love Data and Pullbacks!
When faced with apprehension or uncertainty, many fence-sitting investors revert to wanting more data or waiting for a better price. For example, I often hear, “I love stock XYZ, but I want to wait for the earnings to come out,” or analyst day, or share buyback announcement, or merger closing, or restructuring, etc., etc., etc. For strategists and economists, they are famished for the next critically irrelevant weekly jobless claims number, Federal Reserve policy minutes, ISM monthly manufacturing data, or latest consumer confidence figure.
More data for fence sitters is not sufficient. I often listen to stock-pickers say, “I love XYZ stock, but not at the current $52.50 price, but I’ll back up the truck at $51.50!” Okay, so you’re telling me that you think the stock is worth +40% more, but you want to litigate the purchase price over $1?!
Sadly, there is a cost for all this fence-sitting: a) if good news comes out, investment prices catapult higher and the investor is stuck with a pricier investment; b) if bad news comes out, that long-awaited price pullback is usually not acted upon because fundamentals have now deteriorated; or c) in many cases the price grinds higher before the long-awaited jewel of information is disseminated. The net result is further fence-sitting paralysis, which paradoxically is not helped by more information or a price pullback.
The other reason fence-sitters say or do nothing is because articulating a gloomy thesis simply sounds smarter. For instance, saying “The reason I’m on the sidelines is because we are in a secular bear market due to the debasement of our currency as a result of inflationary Fed monetary policies,” sounds smarter and more compelling than “Stocks are cheap and are already factoring in a lot of negativity.”
Investing is an unbelievably challenging endeavor, but for those fence-sitters with an insatiable appetite for more data and elusive pullbacks, I humbly point out, there is an infinite amount of information that regenerates itself daily. In addition, there is nothing wrong with having a disciplined valuation process in place, but if your best investment ideas are predicated on a minor pullback, then enjoy watching your returns wither away…as you sit on your cozy fence.
Wade W. Slome, CFA, CFP®
Plan. Invest. Prosper.
DISCLOSURE: Sidoxia Capital Management (SCM) and some of its clients hold positions in certain exchange traded funds (ETFs), but at the time of publishing SCM had no direct position in any security referenced in this article. No information accessed through the Investing Caffeine (IC) website constitutes investment, financial, legal, tax or other advice nor is to be relied on in making an investment or other decision. Please read disclosure language on IC Contact page.
Betting on Green: Not All Performance is Equal

Not all performance is created equally. Now is the time of year where professional money managers jockey for position before year-end, either with the intent of locking in above-average performance or throwing up a Hail Mary pass in hopes of gaining lost performance ground. Typically, top performing managers are lauded for their eye-popping returns and shrewd investing acumen, when in fact, often these managers have been playing a game of roulette in which a risky, low probability strategy of betting on “green zero” has paid off (a winner about 2.6% of the time).
With tens of thousands hedge fund managers, mutual fund managers, and investment advisors self-reporting their results, even if the performance is accurate, the “Law of Large Numbers” dictates a small percentage will outperform. In other words, short-term luck can often trump long-term skill in the investment world, so investors really need to take a look under the covers to better understand the composition of the results.
Here are some factors contributing to performance distortions and misunderstandings:
Leverage: Adding leverage to your investment strategy is a lot like switching from a bicycle to a motorcycle. The new vehicle may get you to your destination faster, but the risks are lot higher than riding a bike, including death. The same principles apply to investing. A leveraged portfolio may be a fun ride when prices appreciate, but the agony on the downside can be equally painful in reverse. Often, many managers obscure the amount of leverage, and point to absolute returns rather than risk-adjusted returns, which rightfully account for the underlying volatility of the security or investment. To better measure investment performance on an apples-to-apples basis, risk-adjusted ratios such as Sharpe ratios and Treynor ratios should be used.
Concentration/Style Drift: Similarly to playing a game of roulette, putting all your money on black can result in a very handsome payout, but the downside can be just as severe. In the late 1990s growth managers benefited tremendously by concentrating their portfolios into technology stocks because prices appreciated virtually unabated. Many value managers succumbed to style drift by abandoning their value investment mandates and chasing performance. Investors should scrutinize the composition of their portfolios to better comprehend the bets managers are making. Excessive concentration or style drift may lead to a rude awakening.
Benchmark Cherry Picking: Buried in the fine print of an investment prospectus or pitchbook, a performance benchmark, which acts like a measuring stick, can usually be found. The non-standardized game of performance reporting is a lot like a beauty contest in which the investment manager can pick ugly competitors to make themselves look better. Typically a manager compares their performance against the worst performing benchmark or index, and if the benchmark performance improves, a manager can again substitute the old benchmark with a newer, uglier one.
Spaghetti Effect: Another misleading marketing strategy used by many investment firms is what I like to call the “Throwing-Spaghetti-Against-the-Wall” technique, which involves throwing as many strategies at investors as it takes and see what sticks. Famed hedge fund manager John Paulson, who made Herculean profits during the collapse of the subprime crisis, used this strategy in hopes of capitalizing on his sudden fame. The results haven’t been pretty over the last few years as his major funds have massively underperformed and assets have collapsed from about $38 billion at the peak to less than an estimated $20 billion now. Paulson has proved that parlaying one successful bet into many spaghetti throwing strategies (Advantage, Advantage Plus, Partners Fund, Enhanced Fund, Credit Opportunities, and Recovery) can lead to billions in gained assets, albeit shrinking.
Window-Dressing: Portfolio managers are notorious for selling their stinkers and buying the darlings at the end of a quarter, just so they can avoid uncomfortable questions from investors. By analyzing a manager’s portfolio turnover (i.e., the average holding period for a position), an investor can gauge how much shuffling is really going on. Generally speaking, managers performing this value-destroying, smoke and mirrors behavior are doing more harm than good due to all the trading costs and frictions.
While periodically reviewing absolute reported returns is important, more critical than that is analyzing the risk-adjusted returns of a portfolio, so apples-to-apples comparisons can be made. Any and all strategies are bound to underperform for periods of time, but in order to make rational investment decisions investors need to truly understand the underlying strategy and philosophy of the manager(s). Without following all these steps, investors will have better luck putting their money on green.
Wade W. Slome, CFA, CFP®
Plan. Invest. Prosper.
DISCLOSURE: Sidoxia Capital Management (SCM) and some of its clients hold positions in certain exchange traded funds (ETFs), but at the time of publishing SCM had no direct positions in any Paulson funds or any other security referenced in this article. No information accessed through the Investing Caffeine (IC) website constitutes investment, financial, legal, tax or other advice nor is to be relied on in making an investment or other decision. Please read disclosure language on IC Contact page.
Uncertainty: Love It or Hate It?

Source: Photobucket
Uncertainty is like a fin you see cutting through the water – many people are uncertain whether the fin sticking out of the water is a great white shark or a dolphin? Uncertainty generates fear, and fear often produces paralysis. This financially unproductive phenomenon has also reared its ugly fin in the investment world, which has led to low-yield apathy, and desensitization to both interest rate and inflation risks.
The mass exodus out of stocks into bonds worked well for the very few that timed an early 2008 exit out of equities, but since early 2009, the performance of stocks has handily trounced bonds (the S&P has outperformed the bond market (BND) by almost 100% since the beginning of March 2009, if you exclude dividends and interest). While the cozy comfort of bonds has suited investors over the last five years, a rude awakening awaits the bond-heavy masses when the uncertain economic clouds surrounding us eventually lift.
The Certainty of Uncertainty
What do we know about uncertainty? Well for starters, we know that uncertainty cannot be avoided. Or as former Secretary of the Treasury Robert Rubin stated so aptly, “Nothing is certain – except uncertainty.”
Why in the world would one of the world’s richest and most successful investors like Warren Buffett embrace uncertainty by imploring investors to “buy fear, and sell greed?” How can Buffett’s statement be valid when the mantra we continually hear spewed over the airwaves is that “investors hate uncertainty and love clarity?” The short answer is that clarity is costly (i.e., investors are forced to pay a cherry price for certainty). Dean Witter, the founder of his namesake brokerage firm in 1924, addressed the issue of certainty in these shrewd comments he made some 78 years ago, right before the end of worst bear market in history:
“Some people say they want to wait for a clearer view of the future. But when the future is again clear, the present bargains will have vanished.”
Undoubtedly, some investors hate uncertainty, but I think there needs to be a distinction between good investors and bad investors. Don Hays, the strategist at Hays Advisory, straightforwardly notes, “Good investors love uncertainty.”
When everything is clear to everyone, including the novice investing cab driver and hairdresser, like in the late 1990s technology bubble, the actual risk is in fact far greater than the perceived risk. Or as Morgan Housel from Motley Fool sarcastically points out, “Someone remind me when economic uncertainty didn’t exist. 2000? 2007?”
What’s There to Worry About?
I’ve heard financial bears argue a lot of things, but I haven’t heard any make the case there is little uncertainty currently. I’ll let you be the judge by listing these following issues I read and listen to on a daily basis:
- Fiscal cliff induced recession risks
- Syria’s potential use of chemical weapons
- Iran’s destabilizing nuclear program
- North Korean missile tests by questionable new regime
- Potential Greek debt default and exit from the eurozone
- QE3 (Quantitative Easing) and looming inflation and asset bubble(s)
- Higher taxes
- Lower entitlements
- Fear of the collapse in the U.S. dollar’s value
- Rigged Wall Street game
- Excessive Dodd-Frank financial regulation
- Obamacare
- High Frequency Trading / Flash Crash
- Unsustainably growing healthcare costs
- Exploding college tuition rates
- Global warming and superstorms
- Etc.
- Etc.
- Etc.
I could go on for another page or two, but I think you get the gist. While I freely admit there is much less uncertainty than we experienced in the 2008-2009 timeframe, investors’ still remain very cautious. The trillions of dollars hemorrhaging out of stocks into bonds helps make my case fairly clear.
As investors plan for a future entitlement-light world, nobody can confidently count on Social Security and Medicare to help fund our umbrella-drink-filled vacations and senior tour golf outings. Today, the risk of parking your life savings in low-rate wealth destroying investment vehicles should be a major concern for all long-term investors. As I continually remind Investing Caffeine readers, bonds have a place in all portfolios, especially for income dependent retirees. However, any truly diversified portfolio will have exposure to equities, as long as the allocation in the investment plan meshes with the individual’s risk tolerance and liquidity needs.
Given all the uncertain floating fins lurking in the economic background, what would I tell investors to do with their hard-earned money? I simply defer to my pal (figuratively speaking), Warren Buffett, who recently said in a Charlie Rose interview, “Overwhelmingly, for people that can invest over time, equities are the best place to put their money.” For the vast majority of investors who should have an investment time horizon of more than 10 years, that is a question I can answer with certainty.
Wade W. Slome, CFA, CFP®
Plan. Invest. Prosper.
DISCLOSURE: Sidoxia Capital Management (SCM) and some of its clients hold positions in certain exchange traded funds (ETFs) including BND, but at the time of publishing SCM had no direct positions in any other security referenced in this article. No information accessed through the Investing Caffeine (IC) website constitutes investment, financial, legal, tax or other advice nor is to be relied on in making an investment or other decision. Please read disclosure language on IC Contact page.


