Posts filed under ‘Earnings’
The SaaSpocalypse Has Arrived…Or Has It?

Well, the new month has started with a bang. Financial markets have not only experienced a bang from another military strike on Iran, but also an explosion of AI paranoia. As hundreds of billions of AI investment dollars flood into the economy, fears are intensifying that the AI displacement of workers could have a detrimental impact on the economy and financial markets.
The Monthly Scorecard
It was a mixed performance in the market last month. Geopolitical headlines surrounding Iran and the Middle East are currently front and center, but under the surface, the real story isn’t just geopolitics—it’s a growing investor anxiety around artificial intelligence and its disruptive potential. Here’s what happened last month:
- S&P 500: -0.9%
- Dow Jones Industrial Average: +0.2%
- NASDAQ: -3.4%
The “SaaSpocalypse” and the Tech Identity Crisis
Software stocks are currently under assault, plunging -9.7% for the month and a staggering -22.8% for the start of the year (as measured by the IGV iShares Software index). Analysts are calling this the “SaaSpocalypse” (Software as a Service)—a phenomenon where the market fear is that AI is “eating” software companies.
High-profile casualties have added fuel to the fire. IBM, for example, suffered its worst trading day in 25 years, dropping -13% in a single day. Concerns came to light that new AI agent coding tools like Anthropic’s Claude Code could threaten IBM’s legacy dominance in COBOL-based mainframe systems.
Paranoia vs. Reality
This “AI Paranoia” has spread far beyond Silicon Valley, infecting industries like transportation, banking, travel, real estate, and food delivery. Two major catalysts fueled this fire:
The Citrini Report: A viral, dystopian report from described an “avalanche” of white-collar firings (see chart below). The report argues that while the government may try to intervene with stimulus, it “won’t change the fact that an AI Claude agent can do the work of a $180,000 product manager for $200/month.”
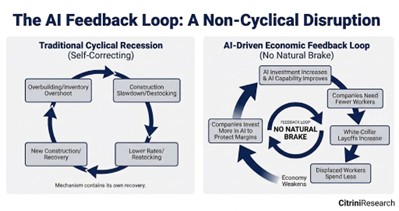
Source: Citrini Research
- Corporate Reductions: High-profile cuts have validated these fears. Block Inc. (led by Jack CEO Dorsey, former Twitter Founder) announced it is slashing 40% of its workforce due to AI advancements, while Amazon recently eliminated 30,000 white-collar positions (10% of its corporate staff).
However, there is a silver lining to that perspective. While software jobs have flattened since ChatGPT arrived in late 2022, we have yet to see the “cliff dive” in total employment that many predicted. In fact, employment (165 million employed) and labor force (172 million) figures are near record levels, so we have not seen AI kill the economy quite just yet (see chart below).
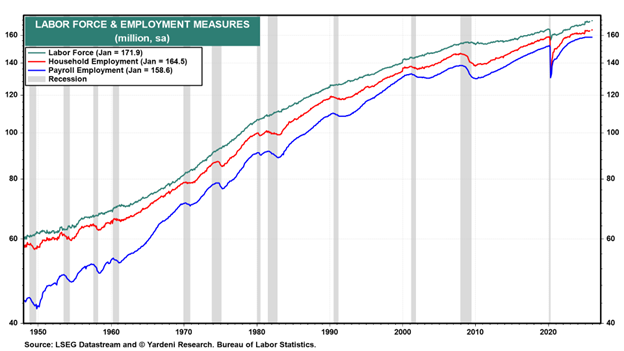
Source: Yardeni Research and Bureau of Labor Statistics
The Great Rotation: Looking for “HALO”
As investors try to decipher the winners and losers, they are migrating away from technology and rotating into HALO stocks (Hard Asset, Low Obsolescence). These companies are seen as less susceptible to AI disruption. Evidence of this shift is clear in the outperformance of value, small-cap, and mid-cap stocks. Notably, the Dow Jones Industrial Average, an index heavy with hard asset exposure, just posted its 10th consecutive month of gains despite the broader technology stock volatility.
A Massive Bet on the Future
Despite the “bubble” murmurs, the AI juggernauts are doubling down. OpenAI just closed the largest private financing in history, raising $110 billion—including $50 billion from Amazon, $30 billion from NVIDIA, and $30 billion from SoftBank. The demand for compute and data centers remains insatiable, supported by the $700 billion being spent by the large hyperscalers (Amazon, Alphabet-Google, Microsoft, and Meta Platforms) this year.
Geopolitical and Legal Headwinds
Adding to the month’s complexity are external shocks:
- Middle East Tensions: Military strikes on Iran recently killed the Iranian Supreme Leader, Ali Khamenei, and other key leaders, injecting significant geopolitical risk.
- Tariff Uncertainty: The Supreme Court recently ruled against the IEEPA tariffs instituted by the Trump administration. While temporary alternatives are in place, the markets are waiting for a permanent solution to work through the courts.
Resilience in the Face of Technological Change
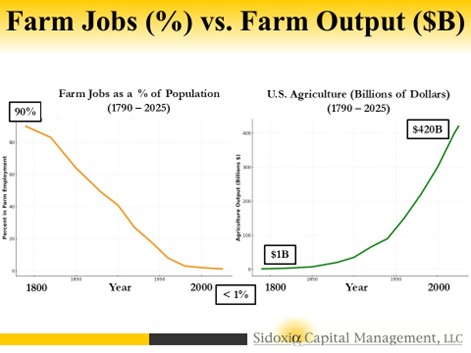
It is easy to get lost in the dystopian narrative, but history offers a more hopeful guide. Technology has been replacing human workers for centuries—from the looms of the Industrial Revolution to the tractors of the Agricultural Revolution – see chart below (1790 – 2025). In every instance, while specific roles were displaced, new industries emerged that not only soaked up the unemployed but expanded the labor force into areas we couldn’t have previously imagined (see also The Fallacy Behind Technological Innovation).
The reality today is that the economy remains remarkably strong. Employment data is resilient, labor force participation is near record levels, and corporate profits are breaking out to new all-time highs. Furthermore, the ISM Manufacturing PMI (Purchasing Managers Index) recently spiked to 52.6, signaling an expansion in a sector that had been declining for years (see chart below).
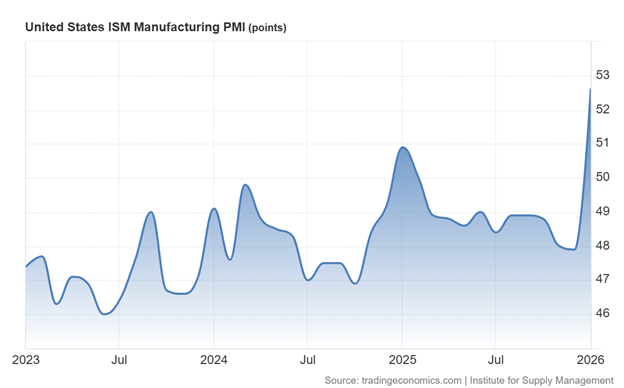
Source: Trading Economics
We are not witnessing the end of work, but rather a high-speed evolution. As we’ve seen before, the human capacity for innovation and adaptation usually outruns the machines.
Wade W. Slome, CFA, CFP®
Plan. Invest. Prosper.
This article is an excerpt from a previously released Sidoxia Capital Management complimentary newsletter (Mar. 2, 2026). Subscribe Here to view all monthly articles.
DISCLOSURE: Sidoxia Capital Management (SCM) and some of its clients hold positions in AMZN, GOOGL, META, MSFT, NVDA, certain exchange traded funds (ETFs), but at the time of publishing had no direct position in IBM, XYZ or any other security referenced in this article. No information accessed through the Investing Caffeine (IC) website constitutes investment, financial, legal, tax or other advice nor is to be relied on in making an investment or other decision. Please read disclosure language on IC Contact page.
Green Lights Everywhere… But Is It Time to Tap the Brakes?

The economic and market fundamentals appear to be flashing green lights everywhere. Growth is strong, inflation has cooled, and financial conditions have eased. Yet even with clear skies and open roads, experienced drivers know conditions can change quickly. It may not be time to slam on the brakes—but it could be time to keep a foot hovering nearby.
After the Federal Reserve aggressively applied the brakes in 2022 with seven rate hikes—taking the federal funds rate from 0.25% to 4.50%—the stock market declined nearly 19%. Since rates peaked at 5.50% in 2023, the Fed has cut rates six times, lowering them by a cumulative 1.75% to approximately 3.75%. Those cuts have helped pave the way for a smoother ride, providing a meaningful tailwind to equity markets.
That said, the most recent quarter-point cut produced mixed results. Last month, the Dow Jones Industrial Average rose +0.7%, the S&P 500 was essentially flat at –0.1%, and the NASDAQ lagged with a –0.5% decline.
Navigating the Winning Streak
We have encountered a few economic speed bumps along the way—tariffs and geopolitical events earlier in 2025, for example—but once investors realized those tariffs were more bark than bite (as I discussed previously in Tariff Sheriff), stocks resumed their impressive run. The market has now delivered three consecutive years of strong returns: 2023 (+24%), 2024 (+23%), and 2025 (+16%).
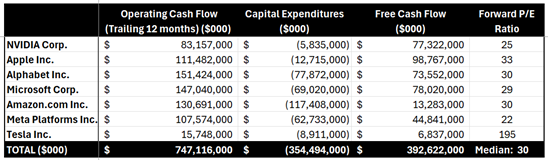
With these strong gains, today’s environment can feel like cruising on a national highway—clear roads, sunny skies, cruise control engaged, and little traffic in sight. The momentum could continue. Three strong years in a row do not rule out a fourth or fifth. In fact, the late 1990s offer a powerful reminder: from 1995 through 2000, the stock market averaged approximately 29% annual returns through the March 2000 peak (see table below). However, once the technology bubble burst, it took more than 13 years for the market to reclaim new year-end highs.
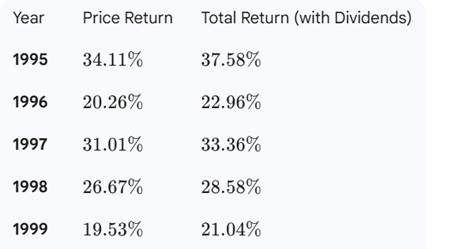
Source: Gemini
After more than three decades of investing, one lesson remains clear: trees can grow for years—but they do not grow to the sky forever. Bull markets often last longer than expected, but they eventually end.
Why the Forecast Looks Rosy
Several factors are supporting today’s strong market backdrop:
- Strong Economic Growth: Third-quarter GDP growth of 4.3% marked the fastest expansion in two years (see chart below)
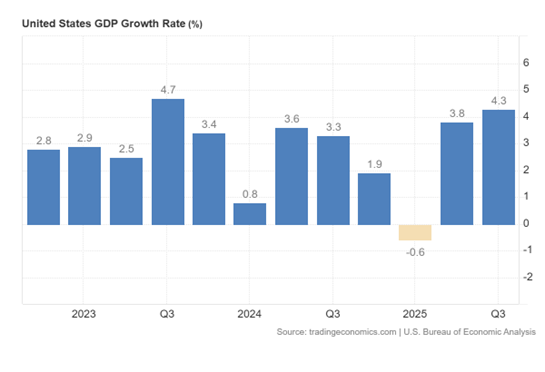
Source: Trading Economics
- AI-Driven Productivity: GDP growth has remained robust even as unemployment has risen from 4.0% earlier in the year to approximately 4.6% today. Growth outpacing employment is the definition of productivity, and the proliferation of artificial intelligence is accelerating this trend. Large companies such as Amazon.com (AMZN), Microsoft (MSFT), Alphabet-Google (GOOGL), and Meta Platforms (META) have reduced headcount significantly by tens of thousands in recent years while revenues and profits continue to surge (see also Mag 7 Takes Cash to the Bank).
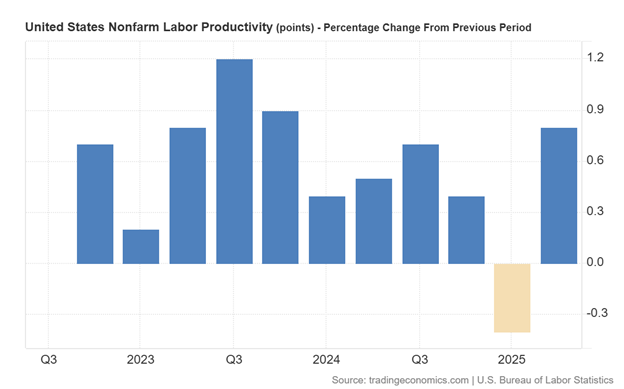
Source: Trading Economics
- Taming Inflation: Crude oil prices have fallen roughly 20% over the last year, and Owner’s Equivalent Rent (which makes up about one-third of CPI inflation) has been steadily declining—both positive signals for inflation pressures ahead (see chart below).

Source: Calafia Beach Pundit
- Lapping Tariffs: Tariffs represented a one-time price increase. As we move into 2026, their inflationary impact should diminish as those increases roll off.
- Narrowing Budget Deficit: While debt and deficits remain headline risks, federal spending has been flat over the past year while revenues have increased roughly 10%, according to Scott Grannis (see chart below).
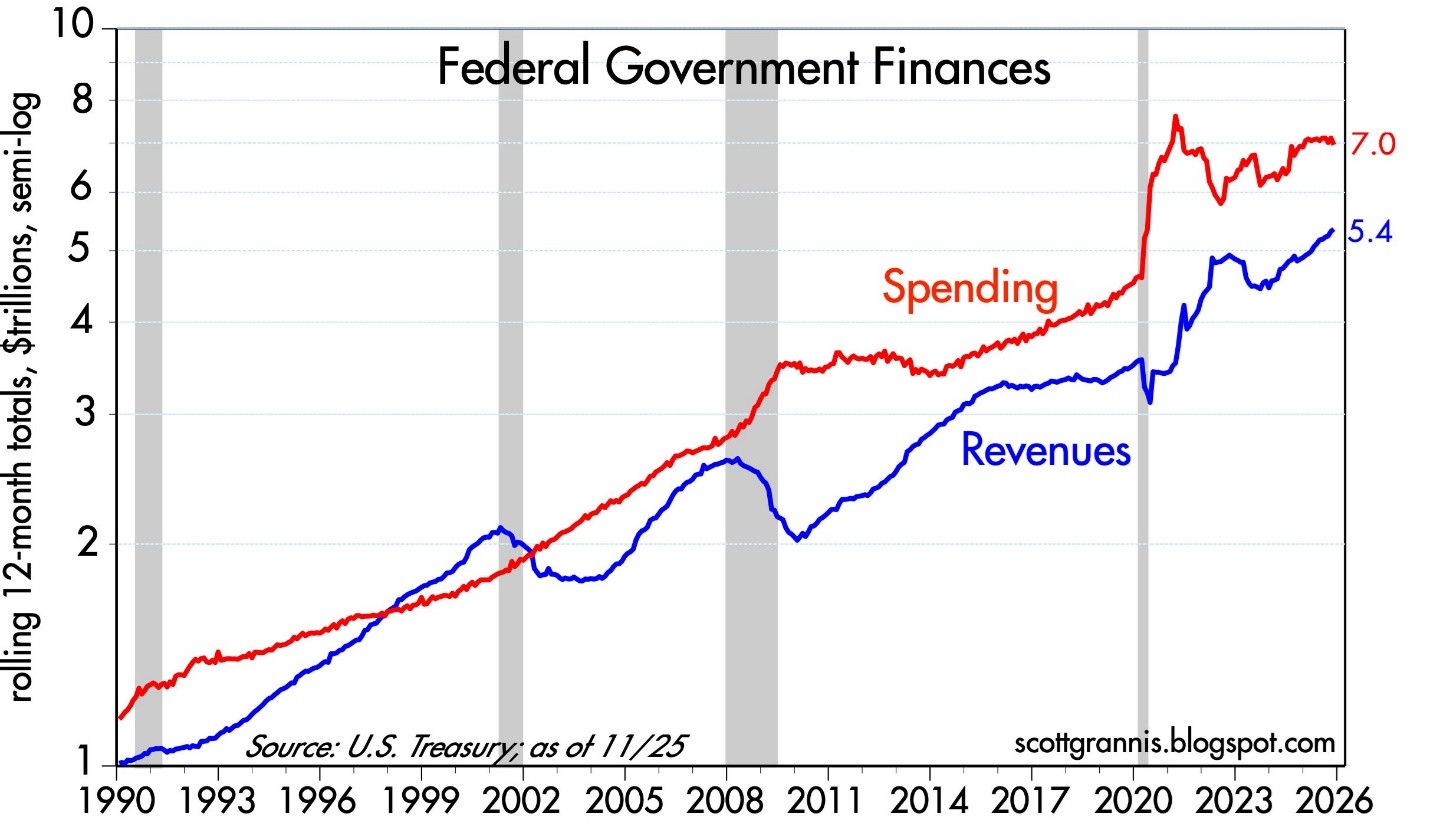
Source: Calafia Beach Pundit
- Tax Cuts & Higher Refunds Ahead: Many provisions of the One Big Beautiful Bill (OBBB) will be felt more fully in 2026, including 100% bonus depreciation for businesses, higher SALT deduction caps, increased standard deductions, no tax on tips or overtime, and a higher Child Tax Credit (CTC). Collectively, these could result in refunds up to $1,000 higher per individual.
Together, these factors could support continued market strength into 2026. But weather, road conditions, and markets can change quickly.
Reasons to Keep Your Foot Near the Brake Pedal
While the road looks smooth, several caution signs deserve attention:
- Elevated Valuations: Forward price-to-earnings ratios (P/E) are at their highest levels since the late 1990s, outside of the brief post-COVID period. (see chart below).
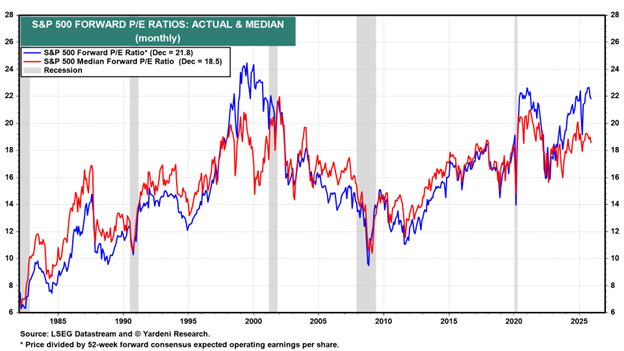
Source: Yardeni Research
- Animal Spirits Are Back: Speculation has expanded well beyond traditional markets. Prediction platforms such as Kalshi, Polymarket, FanDuel, DraftKings, Robinhood, Coinbase, and others now allow bets on everything from political outcomes to economic data—further evidence of speculative behavior.
- Gold and Silver Speculation: Despite a relatively stable U.S. dollar over the past six months, gold rose +64% and silver catapulted +145% in 2025—moves difficult to justify by fundamentals alone (see chart below).

Source: MarketSurge
- Investor Complacency: The Volatility Index (VIX), often called the “fear gauge,” currently hovers near 15, well below its long-term average of 20. Historically, true fear doesn’t surface until readings exceed 25.
- Market Concentration: The “Magnificent 7” stocks represent roughly 1% of the companies in the S&P 500 but account for about 37% of the index’s weighting (see Mag 7 Takes Cash to the Bank)—a concentration reminiscent of the late 1990s. When leadership narrows, downturns can be sharper.
The Sidoxia View
At Sidoxia Capital Management, we have implemented all-weather, time-tested strategies through decades of both bull and bear markets. We believe diversification and disciplined risk management are essential—not fruitless prediction attempts. Rather than attempting to time short-term market moves, we focus on adapting portfolios to changing conditions and navigating inevitable financial potholes.
We don’t always get it right, but over the long run, this approach has allowed us to earn and retain the trust, loyalty, and confidence of our clients.
After three years of strong performance, it’s easy to assume clear roads and blue skies will continue indefinitely. But history teaches us that the most dangerous moments often occur when confidence is highest. This is not a call to abandon the journey—only a reminder to stay alert. When markets accelerate this quickly, discipline, diversification, and risk management matter more than ever.
Wade W. Slome, CFA, CFP®
Plan. Invest. Prosper.
This article is an excerpt from a previously released Sidoxia Capital Management complimentary newsletter (Jan. 2, 2026). Subscribe Here to view all monthly articles.
DISCLOSURE: Sidoxia Capital Management (SCM) and some of its clients hold positions in MSFT, GOOGL, AMZN, META, and certain exchange traded funds (ETFs), but at the time of publishing had no direct position in ORCL or any other security referenced in this article. No information accessed through the Investing Caffeine (IC) website constitutes investment, financial, legal, tax or other advice nor is to be relied on in making an investment or other decision. Please read disclosure language on IC Contact page.
As We Give Thanks, AI and Mag 7 Take Cash to the Bank

Market volatility resurfaced last month as speculation intensified over whether an AI bubble may be forming—and potentially bursting. Yet despite the jitters, equity markets remain solidly positive for the year (S&P 500 +16.5%, NASDAQ +21.0%, Dow +12.2%) – see S&P 500 chart below. A significant portion of the gains have been powered in large part by ongoing strength in the Magnificent 7. Standouts such as NVIDIA (+31.8%) and Alphabet (+68.1%) have been instrumental in carrying the broader indices higher.

Even with these sizable year-to-date gains, memories of the 2000 Tech Bubble and 2008 Financial Crisis resurfaced and prompted investors to temporarily tap the brakes. Mid-month, the NASDAQ retreated roughly -9% from its October peak. After a month-end bounce, the S&P 500 finished essentially flat (+0.1%), the NASDAQ slipped -1.5%, and the Dow eked out a +0.3% increase.
OpenAI and the $1.4 Trillion Question
At the center of the AI controversy sits OpenAI, parent of the three-year-old technology toddler, ChatGPT (Generative Pre-trained Transformer), which now boasts more than 800 million global users (see chart below). The company reportedly runs at a $20 billion annual revenue pace, yet faces difficult questions about how it intends to fund its staggering $1.4 trillion AI infrastructure commitments.
Those concerns came to a head when tech investor Brad Gerstner pressed CEO Sam Altman on his podcast last month. Instead of answering how OpenAI plans to underwrite such an enormous buildout, Altman childishly shot back defensively:
“If you want to sell your shares, I’ll find you a buyer.” (See clip here — or full interview here)

Source: Digital Information World
OpenAI is a key player, but just one component in the vast—and rapidly expanding—web of global AI infrastructure. Gartner, a global research and advisory firm, forecasts $2 trillion of AI investment in 2026, while NVIDIA CEO Jensen Huang recently said:
“Over the next five years, we’re going to scale into… effectively a $3 to $4 trillion AI infrastructure opportunity.”
These provocative “Is this a bubble?” questions make for great headlines, but to truly evaluate AI sustainability, it’s wise to follow the classic Watergate guidance from of All the President’s Men character, Deep Throat (FBI Associate Director, Mark Felt), who tells journalist Bob Woodward to “follow the money,” if he wants to get to the bottom of the Watergate scandal.
The same principle applies to investors who follow the money – the picture looks very different from past bubbles.
Forget Pets.com—Today’s AI Buildout Is Being Funded by Cash-Rich Titans
Unlike the flimsy, profitless internet startups of the late 1990s—companies that raised billions based on “eyeballs” and cocktail-napkin business plans—the current AI buildout is being financed largely by profitable cash-generating giants.
Yes, some firms like Oracle (ORCL) are leaning on debt financing for data-center expansion. But the overwhelming majority of AI capex is being funded by customers and by the cash flow of the Magnificent 7, a group with the financial firepower to sustain multi-year spending without relying heavily on capital markets.
This dynamic alone separates today’s environment from classic bubble conditions.
Do the Magnificent 7 Really Deserve a $22 Trillion Valuation?
The Mag 7 represent only 1% of S&P 500 constituents yet account for a massive 35% of the index’s market value. That concentration understandably raises eyebrows, evoking historical parallels to the “Nifty Fifty” of the 1970s or the “Four Horsemen” of the 1990s.
But headline concentration can be misleading—because the fundamentals tell a very different story. Here are some of the major disparities:
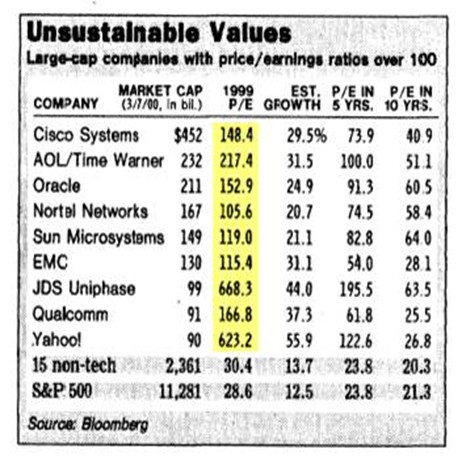
1.) Mag 7 Share of Profits Matches Their Share of Market Value: The Mag 7 collectively contribute $22 trillion of the S&P 500’s $58 trillion total value (below). Said differently, the market values and weightings of the Mag 7 equate to about $22 trillion and 37% of the S&P 500, respectively:
· Nvidia Corp: $4.3T & 7.0%
· Apple Inc.: $4.1 T & 6.7%
· Alphabet Inc.: $3.9 T & 6.3%
· Microsoft Corp.: $3.7 T & 5.9%
· Amazon.com Inc.: $2.5 T & 4.0%
· Meta Platforms Inc.: $1.6T & 2.6%
· Tesla Inc.: $1.4T & 2.3%
· TOTAL: $22T / 37%
Source: Slickcharts
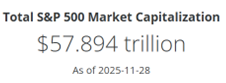
Conveniently (and importantly), the Mag 7’s roughly $747 billion in annual cash flow (see table below) is a good proxy for their profit contribution to the $2 trillion in S&P profits.
Source: SEC Filings & MarketSurge
The $747 billion in Mag 7 cash flows divided by the $2 trillion in S&P 500 coincidentally also equates to 37% ($747B/$2T).
These calculations of the Mag 7 are not bubble math—these calculation comparisons are rational math. Arguments could be made that Mag 7 market values are actually undervalued (not in bubble territory) and should appreciate to a higher percentage of the S&P 500 weightings because these 7 stocks are growing sales and profits faster than compared to the other “absentee” 493 stocks in the index.
2.) Mag 7 are Swimming in Cash: That $747 billion in annual cash flow is on track to hit a jaw-dropping $1 trillion, giving these firms ample capital to fund AI buildouts without substantially accessing the equity or credit markets. The ability to self-fund a multi-trillion-dollar infrastructure expansion is the opposite of bubble behavior.
3.) Valuations Are Elevated—but Far from Bubble Territory: During the 2000 Tech Bubble, many leading tech names traded at 100x+ earnings (See also: Rational or Irrational Exuberance. Today, the Mag 7 trade at a median forward P/E around 30x. Expensive? Historically, yes, versus long-term averages, but nowhere near historical extremes. Relative to growth, profitability, and cash flow, valuations are far more grounded today than during prior manias.
The bottom line is there is plenty to be thankful for and bubble fears are overstated. Despite pockets of AI froth, the underlying economic engine powering AI adoption is real, profitable, and well-capitalized. When investors follow the money, they discover:
· The Mag 7 generate over one-third of S&P 500 profits
· They generate and hold hundreds of billions in cash
· They largely fund their own AI capital expenditures
· Valuations remain far below bubble-era extremes
Investors have a lot to be thankful for. And while volatility will likely continue, the ingredients for a classic, catastrophic AI bubble are noticeably absent. For disciplined, long-term investing strategies like those employed at Sidoxia Capital Management, this environment still offers abundant opportunity—without the need to fear a pricked AI balloon anytime soon.
Wade W. Slome, CFA, CFP®
Plan. Invest. Prosper.
This article is an excerpt from a previously released Sidoxia Capital Management complimentary newsletter (Dec. 1, 2025). Subscribe Here to view all monthly articles.
DISCLOSURE: Sidoxia Capital Management (SCM) and some of its clients hold positions in NVDA, AAPL, MSFT, GOOGL, AMZN, META, TSLA, and certain exchange traded funds (ETFs), but at the time of publishing had no direct position in ORCL or any other security referenced in this article. No information accessed through the Investing Caffeine (IC) website constitutes investment, financial, legal, tax or other advice nor is to be relied on in making an investment or other decision. Please read disclosure language on IC Contact page.
Rational or Irrational Exuberance?

The government may be shut down, but the stock market hasn’t noticed. In fact, stocks just capped another record-breaking month. The S&P 500 gained +2.3%, the NASDAQ climbed +4.7%, and the Dow rose +2.5%.
Millions of Americans are feeling the downside of the shutdown—from disrupted travel to stalled services and furloughed workers. Historically, such uncertainty rattles Wall Street. This time? Investors seem more captivated by the transformative promise of artificial intelligence (AI).
So, the key question today: Is this AI-driven exuberance rational—or irrational?
Exuberance Then vs. Exuberance Now
Having invested for more than 35 years, I’ve seen periods of euphoria and fear. I vividly remember December 1996 when Fed Chair Alan Greenspan famously questioned whether markets were becoming “irrationally exuberant.” Back then, the NASDAQ sat near 1,300. Over the next three years it soared past 5,100 (almost quadrupling), only to crash nearly 80% by 2002.
But here’s the twist: it’s true, we did experience a “tech bubble burst”, but where is the NASDAQ index value today? Amazingly, the index stands at 23,000 (see chart below) – an 18x increase above the 1996 level when Greenspan gave his irrational exuberance speech! So, in hindsight, the sound we heard during 2000 was not the tech bubble bursting but rather an internet Big Bang! The internet wasn’t a speculative fad—it was the foundation of a global transformation.
So, what about AI?

Source: Macrotrends LLC
Internet Cycle vs. AI Supercycle
The internet era lifted the number of online users from zero to five billion—over 60% of the planet (see chart below). The AI wave kicked off publicly in November 2022 with ChatGPT’s release. In under three years, the NASDAQ has more than doubled. That pace isn’t sustainable forever, of course. Bubbles form, emotions swing, and markets correct. But dismissing AI as a fad ignores its unmistakable—and accelerating—impact.

Source: BOND – Mary Meeker
With the rapid appreciation in the stock market, it’s important for investors to identify and understand the warning signs of potential bubble bursting or market crash. In fact, I continue to do my part by studying past crashes. My shipment of Andrew Ross Sorkin’s book, 1929: Inside the Greatest Crash in Wall Street History just arrived and all these lessons remind us that not all booms are bubbles, and not all crashes end innovation.
Not All Bubbles are Created Equal
Major market drawdowns are part of a long-term investor’s journey:
- 1929: Great Crash
- 1973-74: Nifty-Fifty
- 1987: Black Monday
- 2000: Dot-com bust
- 2008: Financial crisis
- 2020: COVID crash
Many pundits today are now asking is this AI surge the next bubble? Valuations, as measured by P/E ratios (Price/Earnings), suggest a very different setup than in 2000.
Back then, many tech leaders traded at 100x+ earnings. Today’s Magnificent Seven tech leaders are elevated, but nowhere near dot-com extremes:
- NVIDIA Corporation (NVDA): 57x
- Apple Inc. (AAPL): 36x
- Microsoft Corp. (MSFT): 36x
- Alphabet Inc. (GOOG): 32x
- Amazon.com, Inc. (AMZN): 31x
- Meta Platforms, Inc. (META): 23x
*Source: MarketSurge – only Tesla, Inc. (TSLA) has a P/E higher than 100x.
For the S&P 500 overall, the index has a forward P/E of 22.8x (Yardeni Research), significantly lower than 2000 levels and nowhere near bubble territory.
Source: Wall Street Journal – March 14, 2000
Life After the Internet and Life After AI Introduction
Think back 25 years:
- Renting movies at Blockbuster before Netflix went digital
- Driving to the bank for deposits
- Buying stamps to mail checks before Venmo or Zelle
Today, those activities feel prehistoric. AI is set to reshape daily life on an even faster timeline — from medicine and logistics to entertainment and marketing.
I’m discovering “AI epiphanies” weekly.
- With a few prompts, I created a beautiful Mother’s Day poem and became a poet hero despite never writing poetry before.
- When I recently needed to write an obituary for my mother, AI helped structure and refine it in minutes instead of taking me hours.
- Just last month I needed to hunt down lobster bisque for a shrimp pasta recipe I wanted to make. It turned into a time-wasting scavenger hunt. Thankfully, AI found it in stock, even when multiple apps insisted it wasn’t available. Needless to say, the recipe was incredibly delicious, and my stomach thanked ChatGPT.
And when it comes to investing? Evaluating biotech companies used to take weeks. Now, detailed research can be synthesized in days without sacrificing rigor. AI isn’t replacing insight — it’s amplifying output.
Not All AI Stories Are “Unicorns and Rainbows”
AI boosts productivity. Higher productivity means some companies need fewer people. Amazon recently announced 14,000 layoffs despite reporting amazing financial results. Microsoft and Meta have also announced thousands of employee layoffs even as profits rise.
This isn’t doom and gloom — it’s innovation cycles in action. Technology displaces tasks before ultimately creating new industries and roles.
So… Rational or Irrational?
Although there has been much debate regarding whether we are in an AI bubble, from my perspective, we are in the very early innings of a long AI revolutionary game. There are definitely pockets of frothiness that expose investors to undue risk, but if you can follow a disciplined, diversified, valuation-sensitive investment strategy, like we implement at Sidoxia Capital Management, I feel that the current exuberance is more rational than irrational.
Wade W. Slome, CFA, CFP®
Plan. Invest. Prosper.
This article is an excerpt from a previously released Sidoxia Capital Management complimentary newsletter (Nov. 3, 2025). Subscribe Here to view all monthly articles.
DISCLOSURE: Sidoxia Capital Management (SCM) and some of its clients hold positions in NVDA, AAPL, MSFT, GOOGL, AMZN, META, TSLA, and certain exchange traded funds (ETFs), but at the time of publishing had no direct position in any other security referenced in this article. No information accessed through the Investing Caffeine (IC) website constitutes investment, financial, legal, tax or other advice nor is to be relied on in making an investment or other decision. Please read disclosure language on IC Contact page.
A.I. Field of Dreams

In the 1989 Academy Award–nominated film Field of Dreams, the lead character Ray Kinsella (played by Kevin Costner) hears a mysterious voice whisper, “If you build it, he will come.” Acting on blind faith, Ray builds a baseball diamond in the middle of his Iowa cornfield, risking financial ruin. Against all logic, the field draws a flood of visitors.
Today, a similar “field of dreams” is being built—not with corn, but with data centers. Instead of baseball players, it is artificial intelligence (AI) models, applications, and users who are coming.
The Market’s AI Momentum
The AI boom has already reshaped markets with all three benchmarks hitting record highs. Last month, the S&P 500 climbed +1.9%, while the NASDAQ rose +1.6% and Dow Jones Industrial Average surged +3.2%. Year to date, the indexes are up +10%, +11%, and +7%, respectively.
Behind this surge lies an unprecedented wave of AI infrastructure investment. Hyperscalers—Amazon.com (AMZN), Microsoft Corp. (MSFT), Google-Alphabet (GOOGL), Meta Platforms (META), and others—are pouring hundreds of billions into AI, much of it flowing directly to NVIDIA Corp. (NVDA), the undisputed leader in GPUs (Graphic Processing Units) powering the world’s AI engines. How large is the spending? NVIDIA CEO Jensen Huang estimates $3 trillion to $4 trillion will be spent this decade to fuel the AI revolution.

Source: Visual Capitalist
The Scale of AI’s Buildout
To put this into perspective:
- Amazon is projected to spend over $100 billion in 2025 alone, more than its cumulative capital expenditures from 2000–2020 combined.
Meta is constructing its $10 billion+ Hyperion data center in Louisiana—a sprawling 4 million sq. ft. complex across 2,250 acres, powered by a $4 billion natural gas plant. The footprint is so gargantuan it could cover much of Manhattan (see graphic below).

- xAI’s Colossus, a 750,000 sq. ft. data center in Memphis, Tennessee was completed in just 122 days—equivalent to building 418 homes in half the time it normally takes to construct one house (see slide below).

Source: BOND (Global Technology Investment Firm)
This breakneck pace of spending underscores the urgency and competitive pressure driving the global AI arms race.
The Origin of the AI Floodgates Opening

The spark was lit on November 30, 2022, when OpenAI released its LLM (large language model) called ChatGPT. Within two months, it amassed 100 million users.
Today, ChatGPT’s metrics have blasted much higher (see slide below):
- 800 million weekly active users
- 20 million paid subscribers
- $3.7 billion in revenue (as of April 2025)
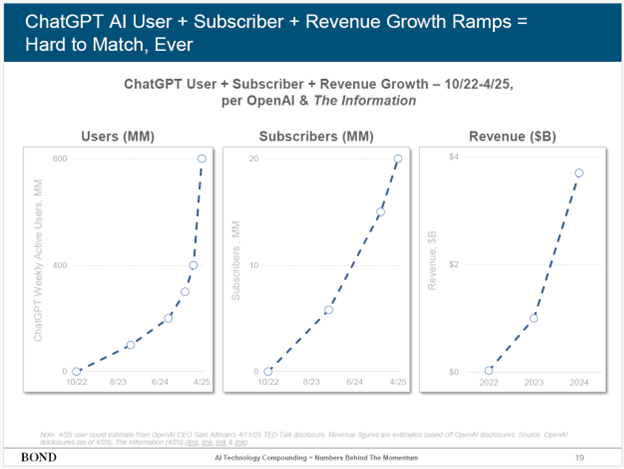
Source: BOND (Global Technology Investment Firm)
But OpenAI is far from alone. Google (Gemini), xAI (Grok), Anthropic (Claude), Meta (LLaMA), Amazon (Titan), Perplexity, and DeepSeek are all competing with their own LLMs. In total, over 1 million machine learning models now exist (see slide below) — each requiring costly compute power and pricey data centers.
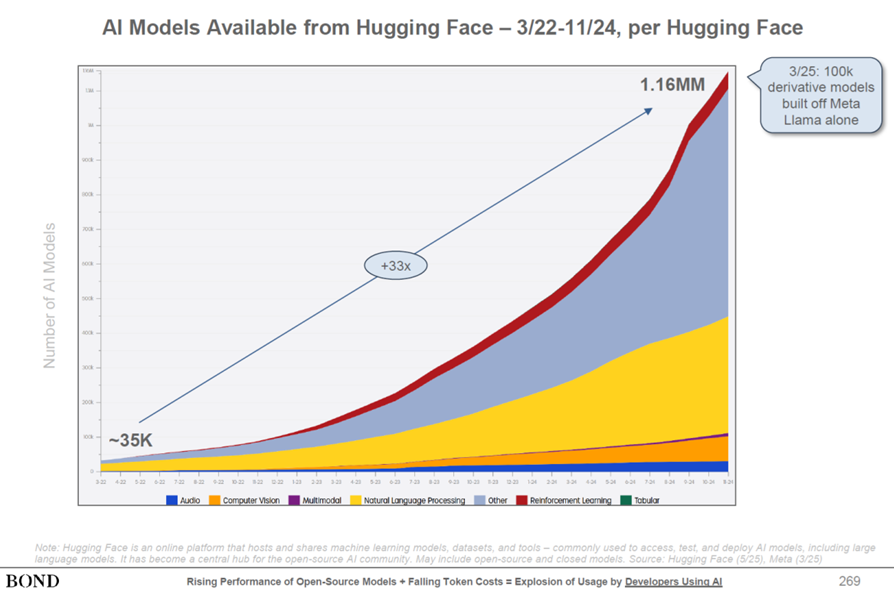
Source: BOND (Global Technology Investment Firm)
Bubble or Productivity Breakthrough?
With trillions flowing into AI, a natural question arises: Is this a bubble?
Even OpenAI CEO Sam Altman admits we’re in an AI bubble :
“When bubbles happen, smart people get overexcited about a kernel of truth…Someone is going to lose a phenomenal amount of money… and a lot of people are going to make a phenomenal amount of money.”
Both realities can be true:
- Yes, hyperscalers are spending like “drunken sailors.”
- Yes, AI demand and productivity benefits are real and growing exponentially.
Consider the trajectory of global cloud revenues: from nearly $0 a decade ago to $300 billion today—a +37% CAGR (see chart below).
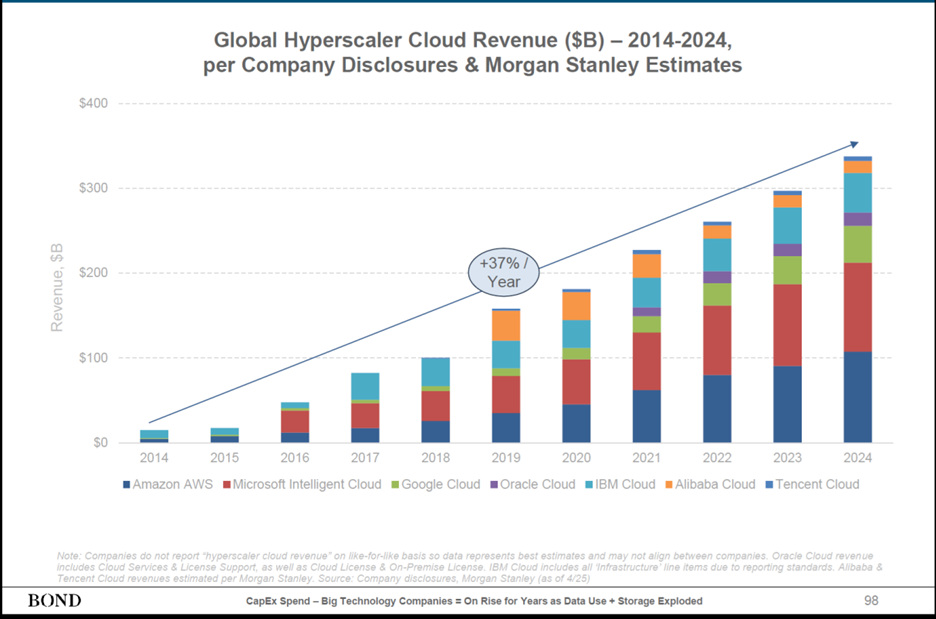
Source: BOND (Global Technology Investment Firm)
And the primary reason for cloud growth can be attributed to AI productivity benefits. A recent SAP survey found that workers using AI save nearly one hour per day on average. That’s transformative for companies: higher productivity without needing proportional hiring.
AI Use Cases Expanding Aggressively
AI’s applications now span nearly every sector (see slide below):
- Technology – software engineering, code generation
- Customer Service & Marketing – customer support and call centers
- Transportation – autonomous vehicles and logistics
- Healthcare – drug discovery and development
- Supply Chains – precision manufacturing and optimization
- Automation – multi-purpose robotics
- Cybersecurity – threat detection and prevention
- Education – personalized lessons and curriculums
- Energy – grid optimization and demand forecasting
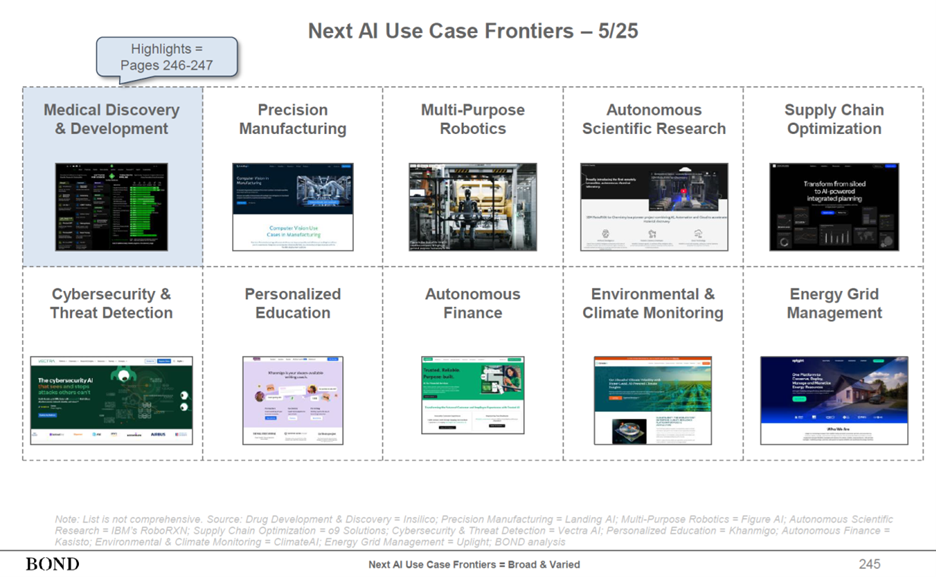
Source: BOND (Global Technology Investment Firm)
The New Field of Dreams
Throughout history, every great leap—printing press, steam engine, electricity, internet—has required massive upfront investment before the payoff arrived. AI is following the same path. Today, we are in the midst of building a new AI Field of Dreams. However, now, the data centers are the new baseball fields. And as with Ray Kinsella’s diamond, the masses are indeed coming.
Wade W. Slome, CFA, CFP®
Plan. Invest. Prosper.
This article is an excerpt from a previously released Sidoxia Capital Management complimentary newsletter (August 1, 2025). Subscribe Here to view all monthly articles.
DISCLOSURE: Sidoxia Capital Management (SCM) and some of its clients hold positions in GOOGL, META, AMZN, MSFT, NVDA, and certain exchange traded funds (ETFs), but at the time of publishing had no direct position in SAP or any other security referenced in this article. No information accessed through the Investing Caffeine (IC) website constitutes investment, financial, legal, tax or other advice nor is to be relied on in making an investment or other decision. Please read disclosure language on IC Contact page.
Trade & OBBB Deals Sealed, Fed Dread, and AI/Meme Dreams

As the stock market reached new all-time highs, investors had plenty to juggle—both in Washington, D.C., and on Wall Street. The S&P 500 climbed +2.2%, the NASDAQ surged +3.7%, and the Dow Jones Industrial Average edged higher by +0.1% for the month.
The One Big Beautiful Bill
What has fueled the rally? A major catalyst was President Trump’s signing of the One Big Beautiful Bill Act (OBBB) on July 4th. The nearly 900-page legislation spans a broad range of economic issues including tax reform, healthcare, energy policy, and national security.

According to the Congressional Budget Office (CBO), the combined impact of tax cuts, new spending, and spending reductions will result in a net cost of $3.4 trillion over 10 years (see chart above). Supporters of the bill argue that this projection underestimates the long-term stimulative effects of tax relief and strategic investments. Whether the deficit widens as the CBO projects, or narrows thanks to a stronger, growing economy, remains to be seen.
Trade Deals Sealed
Since Liberation Day on April 2nd, trade negotiations have progressed unevenly. The administration’s reciprocal tariff hikes were paused through August 1st to allow final agreements to be reached. Following months of tough rhetoric, multiple major trading partners ultimately signed deals before the deadline—including the European Union, Japan, the United Kingdom, Vietnam, and South Korea—thereby avoiding punitive tariffs.
Talks with our two key trading partners, Mexico and Canada, remain ongoing. While Mexico was granted a 90-day extension amid constructive dialogue, Trump slapped a 35% tariff on Canada (from 25%) due to what the White house said was “continued inaction and retaliation.” The tariff pause with China stops on August 12th.
Here’s a list of the new country tariffs released by the president late yesterday: CLICK HERE
Regardless of all the tariff uncertainty, investor sentiment improved last month as the terms of the signed deals were significantly milder than originally feared.
Adding to the optimism:
- Core inflation in June remained modest at 2.8% (Reuters), and
- Tariff revenues collected through July reached $126 billion, beating initial estimates (Politico) – see chart below. Strategist Ed Yardeni forecasts that 2025 tariff revenues could surge to between $400 billion and $500 billion (Barron’s).

Source: Politico
Fed Dread
Of course, when it comes to financial markets, everything can’t just be rainbows and unicorns without something for investors to worry about—and this month, a key concern remains Federal Reserve policy. Critics, including the president, argue that interest rates are too high, with the Federal Funds Rate currently set at 4.25%–4.50% (Yardeni Research) – see chart below.
By comparison:
- The European Central Bank’s Deposit Facility Rate stands at 2.00%, and
- The Bank of Japan’s overnight rate is only 0.50%.

Source: Yardeni Research
Fed Chair Jerome Powell has held off on further cuts, citing the need for more clarity on inflation and labor market data, especially in light of recent tariffs. Ironically, when the Fed last cut rates by -1.00% late last year, the 10-year Treasury yield rose by roughly +1% (see chart above), reflecting fears of rising inflation.
This week, the Fed held rates steady for the fifth consecutive meeting (YouTube). Notably, two FOMC members—Christopher Waller and Michelle Bowman—dissented, voting in favor of a rate cut. It was the first dual dissent by Fed governors in over 30 years—a clear signal of division inside the central bank.
Meme Dreams
With the major indexes at new highs, speculation has returned in full force. Money-losing, struggling companies like Opendoor Technologies, GoPro Inc., and Kohl’s Corp. saw their shares double, triple, or even quadruple over a short span (WSJ) – see chart below. We saw similar trends occur during the GameStop and AMC meme craze in 2021.

Source: The Wall Street Journal
Adding fuel to the fire:
- Cryptocurrency prices are on the rise again.
- Euphorically priced IPOs (Initial Public Offerings) like Figma, Inc. (FIG), which more than tripled in value ($115 per share) on its first trading day above its offering price ($33 per share) valuing the company above $50 billion – more than 30 times next year’s forecasted revenues.
- SPACs (Special Purpose Acquisition Companies)—often criticized for poor governance—are staging a comeback.
Combined, all these trends raise concerns about froth, which investors have experienced at previous peaks.
Climb in AI Stocks Persists
No discussion of this rally would be complete without highlighting the AI mega-cap giants. Companies like Alphabet (Google), Meta (Facebook), Microsoft, and Amazon all recently announced capital expenditures for 2025 that will likely exceed an astounding $350 billion —most of it allocated to AI infrastructure.
Meanwhile, NVIDIA Corp., the AI-chip juggernaut and major beneficiary of all the AI capex, has seen its share price soar +63% in just three months, reaching a staggering $4.4 trillion market value.

Source: Yardeni Research
Valuations High but Fundamentals Remain Strong
While stock valuations remain elevated above historical averages (the S&P 500 red line trades at 22x forward earnings, according to Yardeni) – see chart above, the macro backdrop remains supportive:
- The economy is strong,
- Unemployment is low,
- Corporate profits are growing, and
- Monetary policy may turn more accommodative in coming months.
In this momentum environment, the market should continue its productive juggling, but if the frothy or economic winds worsen, investors should be prepared for a dropped ball.
Wade W. Slome, CFA, CFP®
Plan. Invest. Prosper.
This article is an excerpt from a previously released Sidoxia Capital Management complimentary newsletter (August 1, 2025). Subscribe Here to view all monthly articles.
DISCLOSURE: Sidoxia Capital Management (SCM) and some of its clients hold positions in GOOGL, META, AMZN, MSFT, NVDA, and certain exchange traded funds (ETFs), but at the time of publishing had no direct position in OPEN, GPRO, KSS, GME, AMC, FIG or any other security referenced in this article. No information accessed through the Investing Caffeine (IC) website constitutes investment, financial, legal, tax or other advice nor is to be relied on in making an investment or other decision. Please read disclosure language on IC Contact page.
Animal Spirits to Animal Hibernation

Investor mood or sentiment can change rather quickly. Immediately after the 2024 presidential elections, positive animal spirits catapulted the stock market higher due to hopes of stimulating tax cuts and deregulation legislation. However, those warm and fuzzy feelings soured last month, as investor focus shifted to on-again, off-again tariff talks, and stagflation concerns, which have converted animal spirits into gloomy feelings of hibernation.
As a result, the advancing bull market took a breather and transformed into a weary bear during March. For the month, the S&P 500 (-5.8%), NASDAQ (-8.2%), and the Dow Jones Industrial Average (-4.2%) all fell significantly in the wake of tariffs, inflation, and recession worries.
Lovely Liberation Day or Tariff Trouble?
Since the President took office in January, he has announced, reversed, and implemented tariffs across a wide range of countries and sectors, including China, Canada, Mexico, the EU, Colombia, Venezuela, steel, aluminum, oil, automobiles, digital services taxes, and more.
The day of reckoning begins on April 2nd, designated Liberation Day by the president. This is when the president and the White House officially announce global reciprocal tariffs on foreign countries in an attempt to reverse the nation’s large trade deficit (see chart below) and bring manufacturing back to the United States. For example, if Germany subsidizes BMW cars sold in the U.S. while simultaneously placing tariffs (i.e., additional taxes) on American Ford Explorers sold in Germany, the president wants to impose equivalent reciprocal tariffs on those same BMWs sold in the U.S. in an effort to level the trading playing field. On the surface, a $131 billion trade deficit sounds very significant, but when compared to a $30 trillion economy (Gross Domestic Product – GDP), this negative trade balance represents less than 0.5% of GDP – effectively a rounding error. I have previously written how tariffs represent more of a molehill than a mountain (see Tariff Sheriff), in part because consumer spending and services make up the vast majority of our country’s economic activity, whereas trade and manufacturing are relatively smaller segments.

Source: Trading Economics
Driving home the point that tariffs are more bark than bite, Senior White House trade and manufacturing counselor Peter Navarro recently stated the 2025 tariffs could add $700 billion annually to U.S. revenues, including $100 billion from the recently announced 25% auto tariffs. Many economists believe this collection estimate is too optimistic. However, even if this target is achievable, $700 billion only represents a measly 2% of overall GDP.
Tariffs = Recession or Stagflation?
With the recent stock market downdraft and growing concerns related to tariffs, some economists and pundits are raising the probability of a recession and the possibility of inflation accompanying an economic downturn (i.e., stagflation).
Economic data should clear some of the fog. Fresh employment numbers will be released this Friday, which should shine some light on the health of the economy. Irrespective of this month’s results, the most recent 4.1% unemployment rate (see chart below), though slightly higher over the last two years, does not strongly indicate a recession.

Source: Trading Economics
Other “hard” data, such as GDP, also suggest a slowing economy rather than a recession. For instance, a recent survey of 14 economists estimates the economy is growing at a paltry +0.3% rate in Q1 – 2025 versus +2.3% in Q4 – 2024. Data is continually changing, but if a looming recession were imminent, corporate earnings would likely be trending downward, not upwards, as evident in the chart below.

Source: Yardeni Research
Tariff Inflation Has Yet to Arrive
There is no doubt tariffs function as a tax hike on consumers because U.S. companies that pay the tariffs on imported goods are eventually forced to raise prices to maintain profit margins or limit margin degradation.
Nonetheless, inflation did not spike under President Trump’s first term. Even if the president’s new policies result in more aggressive tariff actions this go-around, inflation will likely remain in check due to the point mentioned earlier – imported goods represent a small percentage of overall consumer and business purchases.
Tariff implementation is just beginning, so only time will tell how pervasive inflation will become. However, what we do know now is that inflation has declined dramatically over the last couple of years and has not yet spiked (see Consumer Price Index chart below).

Source: Calafia Beach Pundit
Where Could I Be Wrong?
I have explained how some of the lagging “hard” data does not signal recession or stagflation, but what could I be missing? For starters, some of the leading “soft” data (e.g., surveys) indicate various cracks in the economic foundation are forming. Take the recent Consumer Confidence data (see chart below), which has weakened dramatically from pre-COVID and even post-COVID levels.

Source: Trading Economics
It’s not just consumers who are feeling uneasy about the economic environment; businesses are as well. Another soft data point flashing red is the NFIB Small Business Uncertainty index, which recently reported its second-highest reading in 48 years (see chart below). Even if my argument that tariffs are too small to materially impact the economy holds, if the psychological effects of tariff uncertainty paralyzes consumer and business economic activity to a standstill, then tariffs could indeed become a substantial factor.

Source: National Federation of Independent Business (NFIB)
What Comes Next After Liberation Day?
Liberation Day is unlikely to trigger an immediate and sustained V-shaped recovery in the stock market because international trading partners will be forced to announce retaliatory tariffs in response to President Trump’s reciprocal tariffs, potentially leading to additional reactionary tariffs by the U.S.
Additionally, the reciprocal tariffs announced on April 2nd will likely serve as a starting point for subsequent negotiations with trading partners. Without a comprehensive resolution, investor sentiment will likely remain somewhat unresolved and unsettled. Regardless of your views on the size and impact of tariffs, Liberation Day will at least bring some clarity and reduce the uncertainty surrounding the current murky and chaotic environment.
The multi-year bull market continued its charge after the presidential election, but investor sentiment has weakened the bull run due to tariff uncertainty. In response, the excited bull has temporarily turned into a sleepy bear. Depending on how these tariff events unfold, we will soon find out whether Liberation Day will awaken the bear to hunt for bulls or send it into deep hibernation.
Wade W. Slome, CFA, CFP®
Plan. Invest. Prosper.
This article is an excerpt from a previously released Sidoxia Capital Management complimentary newsletter (April 1, 2025). Subscribe Here to view all monthly articles.
DISCLOSURE: Sidoxia Capital Management (SCM) and some of its clients hold positions in certain exchange traded funds (ETFs), but at the time of publishing had no direct position in F or any other security referenced in this article. No information accessed through the Investing Caffeine (IC) website constitutes investment, financial, legal, tax or other advice nor is to be relied on in making an investment or other decision. Please read disclosure language on the IC Contact page.
Par for the Course

Stocks have been in a multi-year bull market, but just as investors cannot earn positive returns every month, golfers also cannot achieve a hole-in-one or birdie on every hole, either. A challenging performance is exactly what happened last month when stocks recorded a bogey on the scorecard.
More specifically, this is how far out-of-bounds the major indexes were last month:
- S&P 500: -1.4%
- Dow Jones Industrial Average -1.6%
- NASDAQ: -4.0%
Technology stocks and the Magnificent 7 stocks felt the largest brunt of the force last month as tariffs and the impact of Chinese AI (Artificial Intelligence) competition gave investors heartburn as they digested the information (see New Year, New AI ERA & New Tariff Sheriff).
Tariffs – More Molehill Than Mountain
As mentioned, a large part of last month’s volatility can be explained by the policy uncertainty surrounding the impending tariffs on China, Canada, and Mexico. Despite the absence of new tariffs being implemented, in an attempt to lock in cheaper imported goods, U.S. corporations and consumers have been stockpiling foreign goods before prices move higher due to tariffs. The 25% proposed tariffs on Canadian and Mexican goods are set to be applied as soon as March 4th. A flat 25% tariff on imported steel and aluminum products is expected to begin on March 12th – these particular tariffs are expected to have a disproportionately negative impact on the automotive industry.
Regarding other proposed reciprocal trade agreements, the White House’s analysis on tariffs for all other countries (beyond China, Canada, and Mexico) is expected to arrive on the president’s desk on April 2nd.
All these proposed changes are having an immediate economic impact whether intended or not. Not only are consumers buying more overseas products now, as they brace for higher prices, but businesses are also shifting supply chains to countries outside of China, Canada, and Mexico, in hopes of finding temporary tariff loopholes.
The bottom-line is our country’s imports have been spiking up recently, especially in the first quarter. Imports by definition subtract from America’s economic activity, so if businesses and consumers are rationally stockpiling foreign goods before prices go up from tariffs, investors should not be surprised that GDP (Gross Domestic Product) growth is set to go negative in the first quarter (-1.5%), according to the Federal Reserve Bank of Atlanta.
This short-term spike in foreign product purchases should be temporary until the tariffs are officially put in place. Subsequently, demand for relatively cheaper U.S. goods should rise because foreign goods will be pricier. In other words, buyers may begin purchasing more American-made t-shirts on Amazon because those shirts could be cheaper than the Chinese-made t-shirts after the additional tariffs commence on China.
How large are these overall tariffs? When it comes to Mexico and Canada, the size of these countries’ imports is estimated at $918 billion (see the 2023 import breakdown below for the two countries). On the surface, this sounds like a very large number, and it is. However, if you consider the size of the U.S. GDP ($29.4 trillion), these tariffs will mathematically have less than a 1% impact on the direction of our country’s economic activity.
However, if demand for American products goes up after the tariffs begin, as mentioned above, then it is perfectly logical to expect the drag from imports can be diminished or possibly completely reversed, if consumers decide to buy more American goods.

Source: Visual Capitalist
Also worth noting, as I documented last month in my Investing Caffeine blog, imports only account for 13.9% of our country’s economic activity (see New Tariff Sheriff). So, while tariffs make for great scary headlines, the reality of the numbers paints a different picture. Overall, the uncertainty surrounding the discussion of tariffs is having a much larger economic impact than the actual tariffs themselves. In other words, what we are discussing is more molehill than mountain. We saw this same movie before during the administration’s first-term when tariffs did not crater the economy into recession or create disproportionately high inflation.
War at the White House
A geopolitical soap opera played out on global television last Friday during a meeting between Ukraine’s President Volodymyr Zelensky and President Trump in the Oval Office. The meeting was designed to be a celebratory signing of a minerals deal in which the U.S. would gain access to strategically important Ukrainian rare earth metals in exchange for continued U.S. aid and military support. A signed deal would increase the probability of a peace deal between Russia and Ukraine dramatically. What actually happened was a war of words at the White House, which resulted in Zelensky getting kicked out of the White House with no signed deal.
Both sides have economic and strategic incentives to reengage in peace and mineral deal negotiations, but if the U.S.-Ukraine relationship totally crumbles, Europe and the other NATO (North Atlantic Treaty Organization) countries will need to pick up the slack in their military and economic aid to Ukraine. Regardless, increased European support is required to stave off a broader incursion by Russia and Vladimir Putin into a wider portion of Europe.
Tariffs, the Russia-Ukraine war, and AI issues may have heightened investor anxiety last month, but long-term investors understand that annual -5% and -10% corrections in the equity markets are considered par for the course. In fact, over the last 12 months, the S&P 500 index has declined -5% five times, and -10% one time, yet the stock market is still up +16% on a trailing 12-month basis (see chart below).

Source: Trading Economics
Financial markets end up in the rough plenty of the time, which often results in performance scorecard bogeys. However, long-term investors and Sidoxia Capital Management clients have won more often than not because the benefits of American capitalism have created many more birdies and pars over time.
Wade W. Slome, CFA, CFP®
Plan. Invest. Prosper.
This article is an excerpt from a previously released Sidoxia Capital Management complimentary newsletter (March 3, 2025). Subscribe Here to view all monthly articles.
DISCLOSURE: Sidoxia Capital Management (SCM) and some of its clients hold positions in META, NVDA, certain exchange traded funds (ETFs), but at the time of publishing had no direct position in BABA or any other security referenced in this article. No information accessed through the Investing Caffeine (IC) website constitutes investment, financial, legal, tax or other advice nor is to be relied on in making an investment or other decision. Please read disclosure language on the IC Contact page.
Time in the Market Beats Timing the Market

It was another great year in the stock market. But predicting the timing of a bear or bull market is more challenging. Fortunately for investors, the stock market is up a lot more of the time than it is down. More specifically, over the last century, the stock market has been up 73% of the time for one-year periods and 94% of the time for 10-year periods (see graphic below and Time is What Matters). That’s why investors’ time in the market beats the fools’ errand strategy of trying to time the market. The long-term, consistent upward trend in stock prices makes investing in the stock market akin to sailing around the world with a persistent tailwind for the whole trip.

Source: Capital Group and S&P 500 Index
Many people believe investing in the stock market is gambling, but 73% and 94% odds for stock market gains seem a lot better than the probabilities of making money in Las Vegas. I explored this concept further in one of my recent articles (see Elections Status Quo). Even with those favorable, lopsided odds, recessions do occur, albeit infrequently. As you can see from the chart below, since World War II, we have experienced a dozen recessions averaging 10 months in duration. And guess what? Successful post-recession recoveries have equaled 100% (12 for 12). Despite the short-lived bear markets, stock prices have appreciated more than 30x-fold since the end of World War II.

Source: Yardeni.com
2024 Predictions
There were plenty of pundits and talking heads who falsely predicted a recession in 2024, but the odds certainly worked in investors’ favor. For 2024, the S&P 500 index gained +23%, and this comes on the heels of a banner 2023, which was up +24%. Experiencing back-to-back +20%-years is a rare occurrence, which hasn’t occurred since the late-1990s. As we look into 2025, achieving three consecutive positive years in the stock market is not unprecedented, but as I mentioned earlier, predicting the timing of a down market can be tricky.
Case in point, predicting the outcome of stock returns, even with perfect information can be very daunting. What would have been your prediction of the 2024 stock market return, if I told you the following events were to occur this year (in no particular order)?
- Two assassination attempts on a presidential candidate
- An ongoing bloody war between Russia and Ukraine that reaches one million deaths
- Brutal Israeli-Hamas war in Gaza moves into its second year
- Nationwide Palestinian protests across college campuses
- Israeli-Hezbollah war commences in Lebanon
- Rebels in Syria topple the Assad regime
- A hotly contested presidential election triggering fears of a civil war
- A Baltimore bridge collapses killing six people and costing the overall economy upwards of $10 billion
- After crypto exchange goes bankrupt, CEO is sentenced to 25 years in prison for fraud
Most intelligently honest people would not have predicted a +23% return, but that is exactly what happened. As part of this extended bull market, some major stock market milestones were achieved: 1.) the Dow Jones Industrial average eclipsed 40,000; 2.) the main benchmark S&P 500 index surpassed 6,000; and 3.) the NASDAQ index temporarily triumphed the 20,000 level. The market took a breather in December (the Dow -5.3% and S&P -2.5%), so we have momentarily pulled back from some of these key levels.
What Next in 2025?
As I alluded to earlier, pulling off a three-peat in 2025 with a third consecutive year of gains may be a difficult feat, but not impossible. There remains some room for optimism. First of all, we have an accommodative Federal Reserve that has cut interest rates three times in 2024 (see chart below) from a target of 5.5% to 4.5% (see red line). Currently, expectations are set for the Fed to make another two interest rate cuts in 2025. All else equal, this should provide some mild stimulus for both borrowers and investors in 2025.

Source: Yardeni.com
Next, we have a new pro-business administration entering the White House that has promised lower taxes and less regulation, which should aid business profits. Tariff policies remain a wildcard, but if used judiciously for negotiation purposes, perhaps there could be more bark than bite from the rhetoric. Time will tell.
The 2024 chapter has closed, and we have started the 2025 chapter. Regardless of the outcome this year, history teaches us the time in the market is much more important than timing the market. This philosophy has served Sidoxia Capital Management and its clients well over the long-run.
Wade W. Slome, CFA, CFP®
Plan. Invest. Prosper.
This article is an excerpt from a previously released Sidoxia Capital Management complimentary newsletter (January 2, 2025). Subscribe Here to view all monthly articles.
DISCLOSURE: Sidoxia Capital Management (SCM) and some of its clients hold positions in certain exchange traded funds (ETFs), but at the time of publishing had no direct position in any other security referenced in this article. No information accessed through the Investing Caffeine (IC) website constitutes investment, financial, legal, tax or other advice nor is to be relied on in making an investment or other decision. Please read disclosure language on IC Contact page.
No Market Misgiving on This Thanksgiving

We’ll see if there is any gravy left for investors during the last month of the year, but so far 2024 has been a satiating feast that has stuffed investors. There has been a cornucopia of items to be thankful for, including the Federal Reserve, which is expected to provide some dessert this month in the form of its third interest rate cut this year.
Investors certainly can also be grateful for the performance of the stock market, which has had a phenomenal year thus far (see chart below):
• S&P 500: +26.5%
• Dow Jones Industrial Average:+19.2%
• NASDAQ: +28.0%

On a two-year basis, the S&P 500 results look even tastier: +57.1%
Why is there such a large appetite for stocks? For starters, we are coming off a fresh election last month, and the majority of Americans decided to vote for the new administration that has promised additional stimulative tax cuts, and deregulation. If these promises come to fruition, these changes could augur well for corporate profits and a rising stock market. Regardless of whether your candidate won or lost the election, investors can agree there is less uncertainty with an uncontested election, which is welcomed by all. In addition, the two Fed rate cuts that started in September have also buoyed enthusiasm.
What is less clear are the effects of President-elect Donald Trump’s tariff policy threats, which if enacted run the risk of increasing inflation, stifling global trade, and jeopardizing future Fed rate cuts. Combined, these negative side effects have the potential of significantly dampening economic growth. On the other hand, if the tariffs are only used as a negotiating tool with our larger trading partners (including China, Mexico, Canada, and Europe), the tariff discussion will likely have more bark than bite. Time will tell.
Dissecting Stock Performance & Valuations
A lot of pundits are pointing to an overheated market, but on a 3-year basis, returns are looking more normalized (+8.2% per year) because of the -20% hit on stocks during 2022. As you may recall, much of the 2022 decline was caused by the Fed slamming on the economic breaks with its fastest rate-hiking cycle in four decades (raising rates from 0.0% to 5.5%).
Objectively, stock values, as measured by the Price-Earnings (P/E) ratio of the S&P 500, are at elevated levels – registering in at approximately 22-times next year’s forecasted profits. As you can see from the chart below, the stock market is priced at levels not seen since 2001 and valuations are roughly double what they were at the lows of the 2008 Financial Crisis.

Source: Yardeni.com
A major reason for escalated valuations has been the concentration of performance in the largest seven companies, or the so-called Magnificent 7 stocks, which include, Apple, Microsoft, Alphabet, Amazon.com, Nvidia, Meta Platforms and Tesla. In fact, the index concentration is the highest it has been in more than a half century – even higher than at the peak of the 2000 Tech Bubble when Cisco Systems, Microsoft, GE, Intel, and Exxon Mobil were the five largest companies by market capitalization (see chart below).

The good news is the other 493 companies in the S&P 500 (I call them the “Absentee 493”) are priced much more reasonably. This bifurcated dynamic between the largest seven companies versus everything else, highlights the plethora of opportunities available to be harvested in Value stocks, Small-cap stocks, and Mid-cap stocks.
As is evident in the chart below, the S&P 500 index (red-line), which is skewed by the Magnificent 7, is about 30% more expensive than Small-cap and Mid-cap stocks, which are hovering near historically attractive valuation levels.

Source: Yardeni.com
Value stocks (blue-line) in the market look equally attractive (about 30% cheaper than the S&P 500), as can be seen in the chart below.

Source: Yardeni.com
As always, the future is uncertain, and risks abound for next year. But 2024 has been a blockbuster year and there has been plenty to be thankful for, especially the performance of the U.S. stock market.
Wade W. Slome, CFA, CFP®
Plan. Invest. Prosper.
This article is an excerpt from a previously released Sidoxia Capital Management complimentary newsletter (December 2, 2024). Subscribe Here to view all monthly articles.
DISCLOSURE: Sidoxia Capital Management (SCM) and some of its clients hold positions in AAPL, AMZN, MSFT, GOOGL, META, TSLA, NVDA, and certain exchange traded funds (ETFs), but at the time of publishing had no direct position in CSCO, GE, XOM, INTC or any other security referenced in this article. No information accessed through the Investing Caffeine (IC) website constitutes investment, financial, legal, tax or other advice nor is to be relied on in making an investment or other decision. Please read disclosure language on IC Contact page.


