Posts filed under ‘Behavioral Finance’
EU Marriage Ends in Messy Brexit Divorce

This article is an excerpt from a previously released Sidoxia Capital Management complimentary newsletter (July 1, 2016). Subscribe on the right side of the page for the complete text.
What Just Happened?
Breakups are never easy, especially when they come as a surprise. That’s exactly what happened with last week’s “Brexit” (British exit) referendum results. History was made when 51.9% of the United Kingdom (U.K.) voters from England, Scotland, Wales and Northern Ireland cast their vote to divorce (“Leave”) their country from the European Union (EU). In the end, the 48.1% of U.K. voters could not generate enough support to “Remain” in the EU (see chart below). Despite torrential downpours in southern Britain, voter turnout was extraordinarily high, as 72% of the 46.5 million registered voters came out in full force to have their voices heard.
Divorce is never cheap, and UK Prime Minister David Cameron paid the ultimate price with his defeat in the Brexit referendum…the loss of his job. Immediately following the release of the referendum results, Cameron, the British Prime Minister since 2010 and leader of the Conservative Party, immediately announced his resignation, effective no later than October 2016 after the selection of his successor.
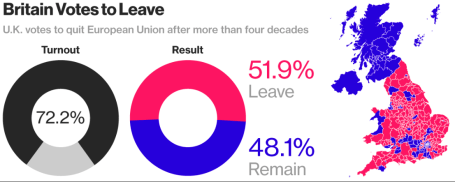
Source: Bloomberg
One of the reasons behind the shock of the Brexit Leave decision is the longstanding relationship the U.K. has had with the EU. European Union membership first began in 1957 with Belgium, France, Germany, Italy, Luxembourg, and Netherlands being the founding countries of this new political-economic union.
A few decades later, the U.K. officially joined the EU in 1973 with Ireland and the Denmark, shortly before Margaret Thatcher came into power. If you fast forward to today, some 43 years after U.K. originally joined the EU, the Brexit decision represents the largest turning point in European political history. Not since the 1989 falling of the Berlin Wall and the subsequent demise of the Cold War in the Soviet Union has such a large, earth-moving political shift occurred.
Today, there are 28 member countries in the EU with Croatia being the newest member in 2013. Despite the Brexit outcome, there still is a backlog of countries wanting to join the EU club, including Turkey, Serbia, Albania, and Montenegro (and this excludes Scotland, which has voiced an interest in leaving the U.K. for the EU).
What Were Investors’ Reactions?
Financial markets around the world were caught off guard, given many pre-referendum polls were showing the Remain camp with a slight edge, along with British betting parlors that were handicapping an overwhelming victory for the Remain camp. Here’s a summary of stock market reactions around the globe from June 23rd to June 30th:
U.S. (S&P 500): -0.7%
U.K. (FTSE 100): +2.6%
Japan (Nikkei): -4.1%
Germany (DAX): -5.6%
Hong Kong (Hang Seng): +0.4%
China (Shanghai): +1.3%
India (BSE): -0.0%
Surprisingly, modest monthly gains achieved in the S&P 500 prior to the Brexit vote (up +0.8%) were quickly pared after the results came in but remained positive for the entire month (up +0.1%). For the year, U.S. stocks are up a limited +2.7%, which isn’t too bad considering investors’ current mood.
Stocks were not the only financial market disrupted after the Brexit announcement, foreign exchange currency rates were unstable as well. The British pound dived to a 30-year low shortly after the vote to a level of approximately $1.33/£, and was down more than -10% on the day of the announcement (see chart below). UK banks like Barclays PLC (BCS) and Lloyds Banking Group PLC (LYG) also saw their share prices significantly pressured as EU regulatory risks of losing access to European customers and negative global interest rates further squeeze the banks’ profit margins.
To put the currency picture into perspective, the value of the British pound ($2.64/£) peaked in March 1972 at a rate about double the U.S. dollar today. On the positive side of the ledger, a weaker British pound could help boost exports and vacation time to Stonehenge or London, but there is also a risk for a spike of inflation (or stagflation) on the country’s roughly $740 billion in imports (e.g., food, energy, and raw materials).
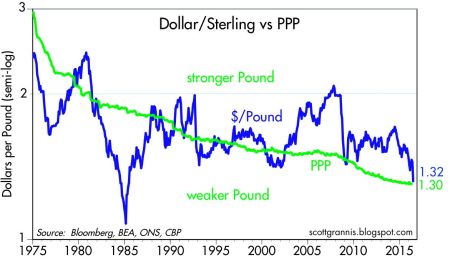
Source: Calafia Beach Pundit
Why Did it Happen?
While economically prosperous regions like London and Scotland voted heavily for Remain, the message for change of the Leave camp resonated well with working class towns and rural areas of England (seen here). Besides a geographic split, there was also a demographic divide between voters. As you can see from the YouGov poll below, the majority of younger citizens overwhelmingly voted for Remain, and vice versa for older citizens as it relates to the Leave vote.
18-24: 75% Remain
25-49: 56% Remain
50-64: 44% Remain
65+: 39% Remain
While geography and demographics certainly played a key role in the outcome of the EU Leave referendum result, at the core of the movement also was a populist discontent with immigration and the negative economic consequences created by globalization. There are many reasons behind the sluggish economic global recovery, even if the U.S. is doing best out of the developed countries, but rightly or wrongly, immigration policies and protectionism played a prominent part in the Brexit.
At the heart of the populist sentiment of lost control to Brussels (EU) and immigration is the question of whether the benefits of globalization have outweighed the costs. The spread of globalization and expanded EU immigration has disenfranchised many lower skill level workers displaced by eastern European immigrants, Syrian refugees and innovative solutions like automated machinery, software, and electronic equipment. Economic history clearly shows the answer to the effectiveness of globalization is a resounding “yes”, but the post-financial crisis recovery has been disappointingly sluggish, so a component of the populist movement has felt an urgency to find a scapegoat. The benefits of globalization can be seen in the chart below, as evidenced by the increases in per capita GDP of the UK relative to Germany and France, after joining the EU in 1973. Many observers are quick to identify the visible consequences of globalization (i.e., lower-paying job losses), but fail to identify the invisible benefits (i.e., productivity, lower prices, investment in higher-paying job gains).
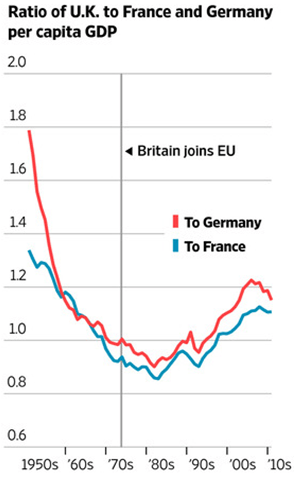
Source: The Wall Street Journal
What happens next?
While some EU leaders want to accelerate the Brexit transition, in actuality, this will require a long, drawn-out negotiation process between the still-unnamed new UK Prime Minister and EU officials. The complete EU-Brexit deal will take upwards of two-years to complete, once Article 50 of the EU Lisbon Treaty has been triggered – likely in October.
In light of the unchartered nature of the Brexit Leave vote, nobody truly knows if this decision will ultimately compromise the existential reality of the EU. Time will tell whether Brexit will merely be a small bump on the long EU road, or the beginning of a scary European domino effect that causes the 28 EU country bloc to topple. If the U.K. is successful in negotiating EU trade agreements with separate European countries, the Brexit even has a longer-term potential of benefiting economic activity. Regardless of the EU outcome, the long-term proliferation of capitalism and democracy is likely to prevail because citizens vote with their wallets and capital goes where it is treated best.
What does Brexit Mean for Global Markets?
The short answer is not much economically, however there have been plenty of less substantial events that have roiled financial markets for relatively short periods of time. There are two basic questions to ask when looking at the economic impact of Brexit:
1) What is the Brexit impact on the U.S. economy?
If you objectively analyze the statistics, U.S. companies sold approximately $56 billion of goods to the U.K. last year (our #7 trading partner). Even if you believe in the unlikely scenario of a severe U.K. economic meltdown, the U.K. trade figure is a rounding error in the whole global economic scheme of things. More specifically, $56 billion in trade with the U.K. equates to about .003 of the United States’ $18+ trillion GDP (Gross Domestic Product).
2) What is the Brexit impact on the global economy?
The U.K.’s GDP amounts to about $3 trillion dollars. Of that total, U.K. exports to the EU account for a reasonably insignificant $300 billion. As you can see from the chart below, $300 billion in UK exports to the EU are virtually meaningless and coincidentally equate to about .003 of the world’s $78 trillion estimated GDP.
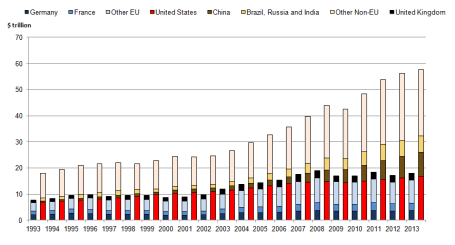
Source: The National Archives
What to Do Next?
Like many divorces, the U.K. Brexit may be messy and drawn out, until all the details are finalized over the next couple years. It’s important that you establish a strong foundation with your investments and do not divorce the sound, fundamental principles needed to grow and preserve your portfolio. As is usually the case, panicking or making an emotional decision relating to your investments during the heat of some geopolitical crisis rarely translates into an optimal decision over the long-run. As I repeatedly have advised over the years, these periods of volatility are nothing new (see also Series of Unfortunate Events).
If you catch your anxiety or blood pressure rising, do yourself a favor and turn off your TV, radio, or electronic device. A more productive use of time is to calmly review your asset allocation and follow a financial plan, with or without the assistance of a financial professional, so that you are able to achieve your long-term financial goals. This strategy will help you establish a more durable, long-lasting, and successful marriage with your investments.

Wade W. Slome, CFA, CFP®
Plan. Invest. Prosper.
DISCLOSURE: Sidoxia Capital Management (SCM) and some of its clients hold positions in certain exchange traded funds (ETFs), but at the time of publishing had no direct position in any other security referenced in this article. No information accessed through the Investing Caffeine (IC) website constitutes investment, financial, legal, tax or other advice nor is to be relied on in making an investment or other decision. Please read disclosure language on IC Contact page.
Cleaning Out Your Investment Fridge

This article is an excerpt from a previously released Sidoxia Capital Management complimentary newsletter (June 1, 2016). Subscribe on the right side of the page for the complete text.
Summer is quickly approaching, but it’s not too late to do some spring cleaning. This principle not only applies to your cluttered refrigerator with stale foods but also your investment portfolio with moldy investments. In both cases, you want to get rid of the spoiled goods. It’s never fun discovering a science experiment growing in your fridge.
Over the last three months, the stock market has been replenished after a rotten first two months of the year (S&P 500 index was down -5.5% January through February). The +1.5% increase in May added to a +6.6% and +0.3% increase in March and April (respectively), resulting in a three month total advance in stock prices of +8.5%. Not surprisingly, the advance in the stock market is mirroring the recovery we have seen in recent economic data.
After digesting a foul 1st quarter economic Gross Domestic Product (GDP) reading of only +0.8%, activity has been smelling better in the 2nd quarter. A recent wholesome +3.4% increase in April durable goods orders, among other data points, has caused the Atlanta Federal Reserve Bank to raise its 2nd quarter GDP estimate to a healthier +2.9% growth rate (from its prior +2.5% forecast).
Consumer spending, which accounts for roughly 70% of our country’s economic activity, has been on the rise as well. The improving employment picture (5.0% unemployment rate last month) means consumers are increasingly opening their wallets and purses. In addition to spending more on cars, clothing, movies, and vacations, consumers are also doling out a growing portion of their income on housing. Housing developers have cautiously kept a lid on expansion, which has translated into limited supply and higher home prices, as evidenced by the Case-Shiller indices charted below.
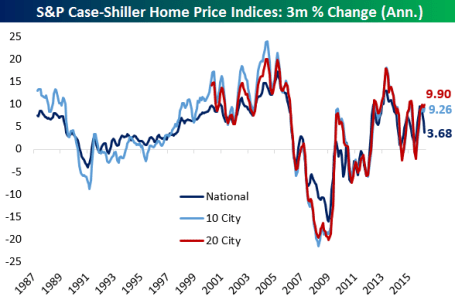
Source: Bespoke
Spoiling the Fun?
While the fridge may look like it’s fully stocked with fresh produce, meat, and dairy, it doesn’t take long for the strawberries to get moldy and the milk to sour. Investor moods can sour quickly too, especially as they fret over the impending “Brexit” (British Exit) referendum on June 23rd when British voters will decide whether they want to leave the European Union. A “yes” exit vote has the potential of roiling the financial markets and causing lots of upset stomachs.
Another financial area to monitor relates to the Federal Reserve’s monetary policy and its decision when to further increase the Federal Funds interest rate target at its June 14th – 15th meeting. With the target currently set at an almost insignificantly small level of 0.25% – 0.50%, it really should not matter whether Chair Janet Yellen decides to increase rates in June, July, September and/or November. Considering interest rates are at/near generational lows (see chart below), a ¼ point or ½ point percentage increase in short-term interest rates should have no meaningfully negative impact on the economy. If your fridge was at record freezing levels, increasing the temperature by a ¼ or ½ degree wouldn’t have a major effect either. If and when short-term interest rates increase by 2.0%, 3.0%, or 4.0% in a relatively short period will be the time to be concerned.
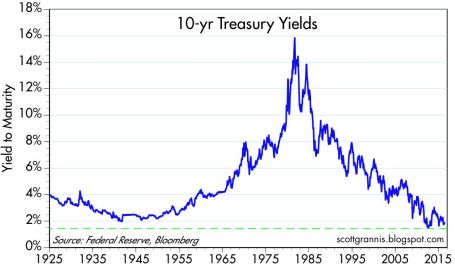
Source: Scott Grannis
Keep a Fresh Financial Plan
As mentioned earlier, your investments can get stale too. Excess cash sitting idly earning next-to-nothing in checking, savings, CDs, or in traditional low-yielding bonds is only going to spoil rapidly to inflation as your savings get eaten away. In the short-run, stock prices will move up and down based on frightening but insignificant headlines. However, in the long-run, the more important issues are determining how you are going to reach your retirement goals and whether you are going to outlive your savings. This mindset requires you to properly assess your time horizon, risk tolerance, income needs, tax situation, estate plan, and other unique circumstances. Like a balanced diet of various food groups in your refrigerator, your key personal financial planning factors are dependent upon you maintaining a properly diversified asset allocation that is periodically rebalanced to meet your long-term financial goals.
Whether you are managing your life savings, or your life-sustaining food supply, it’s always best to act now and not be a couch potato. The consequences of sitting idle and letting your investments spoil away are a lot worse than letting the food in your refrigerator rot away.
Wade W. Slome, CFA, CFP®
Plan. Invest. Prosper.
DISCLOSURE: Sidoxia Capital Management (SCM) and some of its clients hold positions in certain exchange traded funds (ETFs), but at the time of publishing had no direct position in any other security referenced in this article. No information accessed through the Investing Caffeine (IC) website constitutes investment, financial, legal, tax or other advice nor is to be relied on in making an investment or other decision. Please read disclosure language on IC Contact page.
Want to Retire at Age 90?

Do you love working 40-50+ hour weeks? Do you want to be a Wal-Mart (WMT) greeter after you get laid off from your longstanding corporate job? Do you love relying on underfunded government entitlements that you hope won’t be insolvent 10, 20, or 30 years from now? Are you banking on winning the lottery to fund your retirement? Do you enjoy eating cat food?
If you answered “Yes” to one or all of these questions, then do I have a sure-fire investment program for you that will make your dreams of retiring at age 90 a reality! Just follow these three simple rules:
- Buy Low Yielding, Long-Term Bonds: There are approximately $7 trillion in negative yielding government bonds outstanding (see chart below), which as you may understand means investors are paying to give someone else money – insanity. Bank of America recently completed a study showing about two-thirds of the $26 trillion government bond market was yielding less than 1%. Not only are investors opening themselves up to interest rate risk and credit risk, if they sell before maturity, but they are also susceptible to the evil forces of inflation, which will destroy the paltry yield. If you don’t like this strategy of investing near 0% securities, getting a match and gasoline to burn your money has about the same effect.
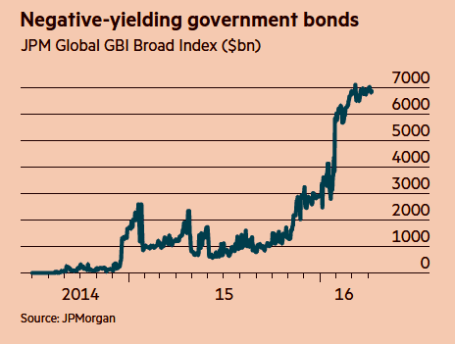
Source: Financial Times
- Speculate on the Timing of Future Fed Rate Hikes/Cuts: When the economy is improving, talking heads and so-called pundits try to guess the precise timing of the next rate hike. When the economy is deteriorating, aimless speculation swirls around the timing of interest rate cuts. Unfortunately, the smartest economists, strategists, and media mavens have no consistent predicting abilities. For example, in 1998 Nobel Prize winning economists Robert Merton and Myron Scholes toppled Long Term Capital Management. Similarly, in 1996 Federal Reserve Chairman Alan Greenspan noted the presence of “irrational exuberance” in the stock market when the NASDAQ was trading at 1,350. The tech bubble eventually burst, but not before the NASDAQ tripled to over 5,000. More recently, during 2005-2007, Fed Chairman Ben Bernanke whiffed on the housing bubble – he repeatedly denied the existence of a housing problem until it was too late. These examples, and many others show that if the smartest financial minds in the room (or planet) miserably fail at predicting the direction of financial markets, then you too should not attempt this speculative feat.
- Trade on Rumors, Headlines & Opinions: Wall Street analysts, proprietary software with squiggly lines, and your hot shot day-trader neighbor (see Thank You Volatility) all promise the Holy Grail of outsized financial returns, but regrettably there is no easy path to consistent, long-term outperformance. The recipe for success requires patience, discipline, and the emotional wherewithal to filter out the endless streams of financial noise. Continually chasing or reacting to opinions, headlines, or guaranteed software trading programs will only earn you taxes, transaction costs, bid-ask spread costs, impact costs, high frequency trading manipulation and underperformance.
Saving for your future is no easy task, but there are plenty of easy ways to destroy your savings. If you want to retire at age 90, just follow my three simple rules.

Wade W. Slome, CFA, CFP®
Plan. Invest. Prosper.
DISCLOSURE: Sidoxia Capital Management (SCM) and some of its clients hold positions in certain exchange traded funds (ETFs), but at the time of publishing had no direct position in WMT or any security referenced in this article. No information accessed through the Investing Caffeine (IC) website constitutes investment, financial, legal, tax or other advice nor is to be relied on in making an investment or other decision. Please read disclosure language on IC Contact page.
Bargain Hunting for Doorbuster Discounts

This article is an excerpt from a previously released Sidoxia Capital Management complimentary newsletter (December 1, 2015). Subscribe on the right side of the page for the complete text.
It’s that time of year again when an estimated 135 million bargain shoppers set aside personal dignity and topple innocent children in the name of Black Friday holiday weekend, doorbuster discounts. Whether you are buying a new big screen television at Amazon for half-off or a new low-cost index fund, everyone appreciates a good value or bargain, which amplifies the importance of the price you pay. Even though consumers are estimated to have spent $83 billion over the post-turkey-coma, holiday weekend, this spending splurge only represents a fraction of the total 2015 holiday shopping season frenzy. When all is said and done, the average person is projected to dole out $805 for the full holiday shopping season (see chart below) – just slightly higher than the $802 spent over the same period last year.

While consumers have displayed guarded optimism in their spending plans, Americans have demonstrated the same cautiousness in their investing behavior, as evidenced by the muted 2015 stock market gains. More specifically, for the month of November, stock prices increased by +0.32% for the Dow Jones Industrial Average (17,720) and +0.05% for the S&P 500 index (2,080). For the first 11 months of the year, the stock market results do not look much different. The Dow has barely slipped by -0.58% and the S&P 500 has inched up by +1.01%.
Given all the negative headlines and geopolitical concerns swirling around, how have stock prices managed to stay afloat? In the face of significant uncertainty, here are some of the calming factors that have supported the U.S. financial markets:
- Jobs Piling Up: The slowly-but-surely expanding economy has created about 13 million new jobs since late 2009 and the unemployment rate has been chopped in half (from a peak of 10% to 5%).

Source: Calafia Beach Pundit
- Housing Recovery: New and existing home sales are recovering and home prices are approaching previous record levels, as the Case-Shiller price indices indicate below.

Source: Calculated Risk Blog
- Strong Consumer: Cars are flying off the shelves at a record annualized pace of 18 million units – a level not seen since 2000. Lower oil and gasoline prices have freed up cash for consumers to pay down debt and load up on durable goods, like some fresh new wheels.

Source: Calculated Risk Blog
Despite a number of positive factors supporting stock prices near all-time record highs and providing plenty of attractive opportunities, there are plenty of risks to consider. If you watch the alarming nightly news stories on TV or read the scary newspaper headlines, you’re more likely to think it’s Halloween season rather than Christmas season.
At the center of the recent angst are the recent coordinated terrorist attacks that took place in Paris, killing some 130 people. With ISIS (Islamic State of Iraq and Syria) claiming responsibility for the horrific acts, political and military resources have been concentrated on the ISIS occupied territories of Syria and Iraq. Although I do not want to diminish the effects of the appalling and destructive attacks in Paris, the events should be placed in proper context. This is not the first or last large terrorist attack – terrorism is here to stay. As I show in the chart below, there have been more than 200 terrorist attacks that have killed more than 10 people since the 9/11 attacks. Much of the Western military power has turned a blind eye towards these post-9/11 attacks because many of them have taken place off of U.S. or Western country soil. With the recent downing of the Russian airliner (killing all 224 passengers), coupled with the Paris terror attacks, ISIS has gained the full military attention of the French, Americans, and Russians. As a result, political willpower is gaining momentum to heighten military involvement.

Source: Wikipedia
Investor anxiety isn’t solely focused outside our borders. The never ending saga of when the Federal Reserve will initiate its first Federal Funds interest rate target increase could finally be coming to an end. According to the CME futures market, there currently is a 78% probability of a 0.25% interest rate increase on December 16th. As I have said many times before, interest rates are currently near generational lows, and the widely communicated position of Federal Reserve Chairwoman Yellen (i.e., shallow slope of future interest rate hike trajectory) means much of the initial rate increase pain has likely been anticipated already by market participants. After all, a shift in your credit card interest rate from 19.00% to 19.25% or an adjustment to your mortgage rate from 3.90% to 4.15% is unlikely to have a major effect on consumer spending. In fact, the initial rate hike may be considered a vote of confidence by Yellen to the sustainability of the current economic expansion.
Shopping Without My Rose Colored Glasses
Regardless of the state of the economic environment, proper investing should be instituted through an unemotional decision-making process, just as going shopping should be an unemotional endeavor. Price and value should be the key criteria used when buying a specific investment or holiday gift. Unfortunately for many, emotions such as greed, fear, impatience, and instant gratification overwhelm objective measurements such as price and value.
As I have noted on many occasions, over the long-run, money unemotionally moves to where it is treated best. From a long-term perspective, that has meant more capital has migrated to democratic and capitalistic countries with a strong rule of law. Closed, autocratic societies operating under corrupt regimes have been the big economic losers.
With all of that set aside, the last six years have created tremendous investment opportunities due to the extreme investor risk aversion created by the financial crisis – hence the more than tripling in U.S. stock prices since March 2009.
When comparing the yield (i.e., profit earned on an investment) between stocks and bonds, as shown in the chart below, you can see that stock investors are being treated significantly better than bond investors (6.1% vs. 4.0%). Not only are bond investors receiving a lower yield than stock investors, but bond investors also have no hope of achieving higher payouts in the future. Stocks, on the other hand, earn the opportunity of a double positive whammy. Not only are stocks currently receiving a higher yield, but stockholders could achieve a significantly higher yield in the future. For example, if S&P 500 earnings can grow at their historic rate of about 7%, then the current stock earnings yield of 6.1% would about double to 12.0% over the next decade at current prices. The inflated price and relative attractiveness of stocks looks that much better if you compare the 6.1% earnings yield to the paltry 2.2% 10-Year Treasury yield.

Source: Yardeni.com
This analysis doesn’t mean everyone should pile 100% of their portfolios into stocks, but it does show how expensively nervous investors are valuing bonds. Time horizon, risk tolerance, and diversification should always be pillars to a disciplined, systematic investment strategy, but as long as these disparities remain between the earnings yields on stocks and bonds, long-term investors should be able to shop for plenty of doorbuster discount bargain opportunities.
Wade W. Slome, CFA, CFP®
Plan. Invest. Prosper.
DISCLOSURE: Sidoxia Capital Management (SCM) and some of its clients hold positions in AMZN and certain exchange traded funds (ETFs), but at the time of publishing had no direct position in any other security referenced in this article. No information accessed through the Investing Caffeine (IC) website constitutes investment, financial, legal, tax or other advice nor is to be relied on in making an investment or other decision. Please read disclosure language on IC Contact page.
Playing the Field with Your Investments

For some, casually dating can be fun and exciting. The same goes for trading and speculating – the freedom to make free- wheeling, non-committal purchases can be exhilarating. Unfortunately the costs (fiscally and emotionally) of short-term dating/investing often outweigh the benefits.
Fortunately, in the investment world, you can get to know an investment pretty well through fundamental research that is widely available (e.g., 10Ks, 10Qs, press releases, analyst days, quarterly conference calls, management interviews, trade rags, research reports). Unlike dating, researching stocks can be very cheap, and you do not need to worry about being rejected.
Dating is important early in adulthood because we make many mistakes choosing whom we date, but in the process we learn from our misjudgments and discover the important qualities we value in relationships. The same goes for stocks. Nothing beats experience, and in my long investment career, I can honestly say I’ve dated/traded a lot of pigs and gained valuable lessons that have improved my investing capabilities. Now, however, I don’t just casually date my investments – I factor in a rigorous, disciplined process that requires a serious commitment. I no longer enter positions lightly.
One of my investment heroes, Peter Lynch, appropriately stated, “In stocks as in romance, ease of divorce is not a sound basis for commitment. If you’ve chosen wisely to begin with, you won’t want a divorce.”
Charles Ellis shared these thoughts on relationships with mutual funds:
“If you invest in mutual funds and make mutual funds investment changes in less than 10 years…you’re really just ‘dating.’ Investing in mutual funds should be marital – for richer, for poorer, and so on; mutual fund decisions should be entered into soberly and advisedly and for the truly long term.”
No relationship comes without wild swings, and stocks are no different. If you want to survive the volatile ups and downs of a relationship (or stock ownership), you better do your homework before blindly jumping into bed. The consequences can be punishing.
Buy and Hold is Dead…Unless Stocks Go Up
If you are serious about your investments, I believe you must be mentally willing to commit to a relationship with your stock, not for a day, not for a week, or not for a month, but rather for years. Now, I know this is blasphemy in the age when “buy-and-hold” investing is considered dead, but I refute that basic premise whole-heartedly…with a few caveats.
Sure, buy-and-hold is a stupid strategy when stocks do nothing for a decade – like they have done in the 2000s, but buying and holding was an absolutely brilliant strategy in the 1980s and 1990s. Moreover, even in the miserable 2000s, there have been many buy-and-hold investments that have made owners a fortune (see Questioning Buy & Hold ). So, the moral of the story for me is “buy-and-hold” is good for stocks that go up in price, and bad for stocks that go flat or down in price. Wow, how deeply profound!
To measure my personal commitment to an investment prospect, a bachelorette investment I am courting must pass another test…a test from another one of my investment idols, Phil Fisher, called the three-year rule. This is what the late Mr. Fisher had to say about this topic:
“While I realized thoroughly that if I were to make the kinds of profits that are made possible by [my] process … it was vital that I have some sort of quantitative check… With this in mind, I established what I called my three-year rule.” Fisher adds, “I have repeated again and again to my clients that when I purchase something for them, not to judge the results in a matter of a month or a year, but allow me a three year period.”
Certainly, there will be situations where an investment thesis is wrong, valuation explodes, or there are superior investment opportunities that will trigger a sale before the three-year minimum expires. Nonetheless, I follow Fisher’s rule in principle in hopes of setting the bar high enough to only let the best ideas into both my client and personal portfolios.
As I have written in the past, there are always reasons of why you should not invest for the long-term and instead sell your position, such as: 1) new competition; 2) cost pressures; 3) slowing growth; 4) management change; 5) valuation; 6) change in industry regulation; 7) slowing economy; 8 ) loss of market share; 9) product obsolescence; 10) etc, etc, etc. You get the idea.
Don Hays summed it up best: “Long term is not a popular time-horizon for today’s hedge fund short-term mentality. Every wiggle is interpreted as a new secular trend.”
Peter Lynch shares similar sympathies when it comes to noise in the marketplace:
“Whatever method you use to pick stocks or stock mutual funds, your ultimate success or failure will depend on your ability to ignore the worries of the world long enough to allow your investments to succeed.”
Every once in a while there is validity to some of the concerns, but more often than not, the scare campaigns are merely Chicken Little calling for the world to come to an end.
Patience is a Virtue
In the instant gratification society we live in, patience is difficult to come by, and for many people ignoring the constant chatter of fear is challenging. Pundits spend every waking hour trying to explain each blip in the market, but in the short-run, prices often move up or down irrespective of the daily headlines. Explaining this randomness, Peter Lynch said the following:
“Often, there is no correlation between the success of a company’s operations and the success of its stock over a few months or even a few years. In the long term, there is a 100% correlation between the success of a company and the success of its stock. It pays to be patient, and to own successful companies.”
Long-term investing, like long-term relationships, is not a new concept. Investment time horizons have been shortening for decades, so talking about the long-term is generally considered heresy. Rather than casually date a stock position, perhaps you should commit to a long-term relationship and divorce your field-playing habits. Now that sounds like a sweet kiss of success.
Wade W. Slome, CFA, CFP®
Plan. Invest. Prosper.
DISCLOSURE: Sidoxia Capital Management (SCM) and some of its clients own certain exchange traded funds, but at the time of publishing SCM had no direct position in any other security referenced in this article. No information accessed through the Investing Caffeine (IC) website constitutes investment, financial, legal, tax or other advice nor is to be relied on in making an investment or other decision. Please read disclosure language on IC “Contact” page.
Digesting Stock Gains

This article is an excerpt from a previously released Sidoxia Capital Management complementary newsletter (June 1, 2015). Subscribe on the right side of the page for the complete text.
Despite calls for “Sell in May, and go away,” the stock market as measured by both the Dow Jones Industrial and S&P 500 indexes grinded out a +1% gain during the month of May. For the year, the picture looks much the same…the Dow is up around +1% and the S&P 500 +2%. After gorging on gains of +30% in 2013 and +11% in 2014, it comes as no surprise to me that the S&P 500 is taking time to digest the gains. After eating any large pleasurable meal, there’s always a chance for some indigestion – just like last month. More specifically, the month of May ended as it did the previous six months…with a loss on the last trading day (-115 points). Providing some extra heartburn over the last 30 days were four separate 100+ point decline days. Realized fears of a Greek exit from the eurozone would no doubt have short-term traders reaching for some Tums antacid. Nevertheless, veteran investors understand this is par for the course, especially considering the outsized profits devoured in recent years.
The profits have been sweet, but not everyone has been at the table gobbling up the gains. And with success, always comes the skeptics, many of whom have been calling for a decline for years. This begs the question, “Are we in a stock bubble?” I think not.
Bubble Bites
Most asset bubbles are characterized by extreme investor/speculator euphoria. There are certainly small pockets of excitement percolating up in the stock market, but nothing like we experienced in the most recent burstings of the 2000 technology and 2006-07 housing bubbles. Yes, housing has steadily improved post the housing crash, but does this look like a housing bubble? (see New Home Sales chart)

Source: Dr. Ed’s Blog
Another characteristic of a typical asset bubble is rabid buying. However, when it comes to the investor fund flows into the U.S. stock market, we are seeing the exact opposite…money is getting sucked out of stocks like a Hoover vacuum cleaner. Over the last eight or so years, there has been almost -$700 billion that has hemorrhaged out of domestic equity funds – actions tend to speak louder than words (see chart below):
 Source: Investment Company Institute (ICI)
The shift to Exchange Traded Funds (ETFs) offered by the likes of iShares and Vanguard doesn’t explain the exodus of cash because ETFs such as S&P 500 SPDR ETF (SPY) are suffering dramatically too. SPY has drained about -$17 billion alone over the last year and a half.
With money flooding out of these stock funds, how can stock prices move higher? Well, one short answer is that hundreds of billions of dollars in share buybacks and trillions in mergers and acquisitions activity (M&A) is contributing to the tide lifting all stock boats. Low interest rates and stimulative monetary policies by central banks around the globe are no doubt contributing to this positive trend. While the U.S. Federal Reserve has already begun reversing its loose monetary policies and has threatened to increase short-term interest rates, by any objective standard, interest rates should remain at very supportive levels relative to historical benchmarks.
Besides housing and fund flows data, there are other unbiased sentiment indicators that indicate investors have not become universally Pollyannaish. Take for example the weekly AAII Sentiment Survey, which shows 73% of investors are currently Bearish and/or Neutral – significantly higher than historical averages.
The Consumer Confidence dataset also shows that not everyone is wearing rose-colored glasses. Looking back over the last five decades, you can see the current readings are hovering around the historical averages – nowhere near the bubblicious 2000 peak (~50% below).

Source: Bespoke
Recession Reservations
Even if you’re convinced there is no imminent stock market bubble bursting, many of the same skeptics (and others) feel we’re on the verge of a recession – I’ve been writing about many of them since 2009. You could choke on an endless number of economic indicators, but on the common sense side of the economic equation, typically rising unemployment is a good barometer for any potentially looming recession. Here’s the unemployment rate we’re looking at now (with shaded periods indicating prior recessions):

As you can see, the recent 5.4% unemployment rate is still moving on a downward, positive trajectory. By most peoples’ estimation, because this has been the slowest recovery since World War II, there is still plenty of labor slack in the market to keep hiring going.
An even better leading indicator for future recessions has been the slope of the yield curve. A yield curve plots interest rate yields of similar bonds across a range of periods (e.g., three-month bill, six-month bill, one-year bill, two-year note, five-year note, 10-year note and 30-year bond). Traditionally, as short-term interest rates move higher, this phenomenon tends to flatten the yield curve, and eventually inverts the yield curve (i.e., short-term interest rates are higher than long-term interest rates). Over the last few decades, when the yield curve became inverted, it was an excellent leading indicator of a pending recession (click here and select “Animate” to see amazing interactive yield curve graph). Fortunately for the bulls, there is no sign of an inverted yield curve – 30-year rates remain significantly higher than short-term rates (see chart below).

Stock market skeptics continue to rationalize the record high stock prices by pointing to the artificially induced Federal Reserve money printing buying binge. It is true that the buffet of gains is not sustainable at the same pace as has been experienced over the last six years. As we continue to move closer to full employment in this economic cycle, the rapid accumulated wealth will need to be digested at a more responsible rate. An unexpected Greek exit from the EU or spike in interest rates could cause a short-term stomach ache, but until many of the previously mentioned indicators reach dangerous levels, please pass the gravy.
Wade W. Slome, CFA, CFP®
Plan. Invest. Prosper.
DISCLOSURE: Sidoxia Capital Management (SCM) and some of its clients hold positions in SPY and other certain exchange traded funds (ETFs), but at the time of publishing, SCM had no direct position in any other security referenced in this article. No information accessed through the Investing Caffeine (IC) website constitutes investment, financial, legal, tax or other advice nor is to be relied on in making an investment or other decision. Please read disclosure language on IC Contact page.
Ceasefires & Investor Quagmires

This article is an excerpt from a previously released Sidoxia Capital Management complementary newsletter (March 1, 2015). Subscribe on the right side of the page for the complete text.
Considering the following current event headlines, who would have guessed the stock market is trading near record, all-time highs and the NASDAQ index breaking 5,000 for the first time since the year 2000?
- Russia Lies Over Ukraine Ceasefire
- ISIS Beheadings and Jihadi John
- Strong Dollar, Weak Global Economy
- Fed’s Yellen: Rate Rise & Inflation
- Iranian Negotiations & Nuclear Weapons
- Grexit: The Likelihood of Greece’s Exit from the Euro
- The Chinese Bubble Pops
- Ebola and the Fear Epidemic
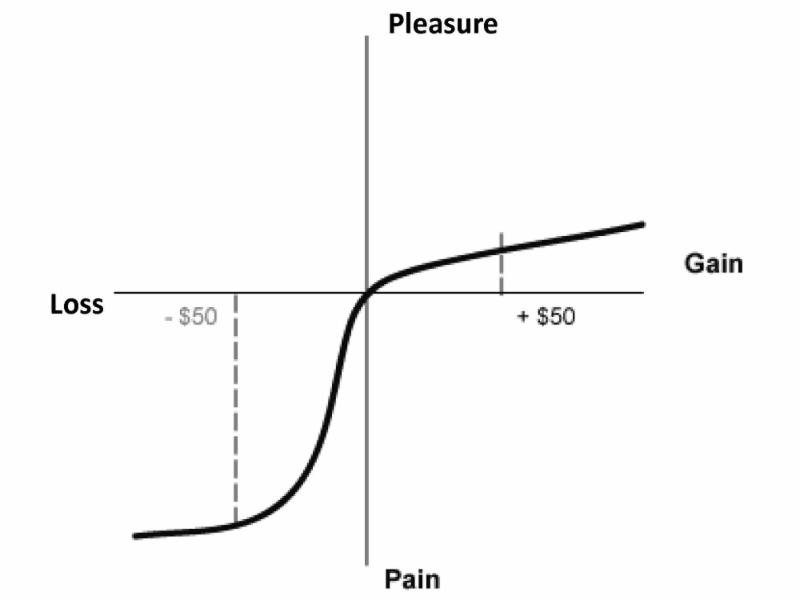
After reading all these depressing stories, I feel more like taking a Prozac pill than I do venturing into the investing world. Unfortunately, in the media world, the overarching motto driving the selection of published stories is, “If it bleeds, it leads!” Plainly and simply, bad news sells. The media outlets prey on our human behavioral shortcomings. Specifically, people feel the pain from losses at a rate more than double the feelings of pleasure (see Controlling the Lizard Brain and chart below).
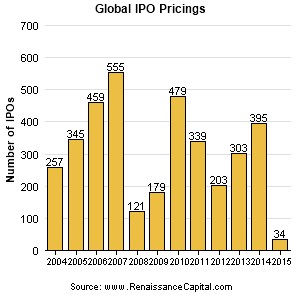
This phenomenon leaves Americans and the overall investing public choking on the daily doom and gloom headlines. Investor skepticism caused by the 2008-2009 financial crisis is evidenced by historically low stock ownership statistics and stagnant equity purchase flow data. Talk of another stock bubble has been introduced again now that the NASDAQ is approaching 5,000 again, but we are not seeing signs of this phenomenon in the IPO market (Initial Public Offering) – see chart below. IPOs are on the rise, but the number of filings is more than -50% below the peak of 845 IPOs seen in the late 1990s when former Federal Reserve Chairman Alan Greenspan made his famous “irrational exuberance” speech (see also Irrational Exuberance Deja Vu and chart below).
Uggh! 0.08% Really?
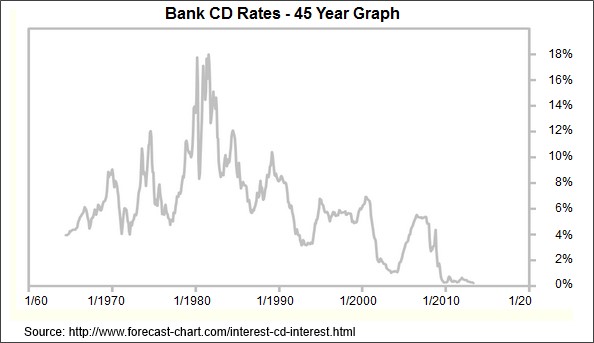
Compounding the never-ending pessimism problem is the near-0% interest rate environment. Times are long gone when you could earn 18% on a certificate of deposit (see chart below). Today, you can earn 0.08% on a minimum $10,000 investment in a Bank of America (BAC) Certificate of Deposit (CD). Invest at that rate for more than a decade and you will have almost accumulated a $100 (~1%) – probably enough for a single family meal…without tip. To put these paltry interest rates into perspective, the U.S. stock market as measured by the S&P 500 index was up a whopping +5.5% last month and the Dow Jones Industrials climbed +5.6% (+968 points to 18,133). Granted, last month’s S&P 500 percentage increase was the largest advance since 2011, but if I wanted to earn an equivalent +5.5% return by investing in that Bank of America CD, it would take me to age 100 years old before I earned that much!
Globally, the interest rate picture doesn’t look much prettier. In fact, the negative interest rate bonds offered in Switzerland and other neighboring countries, including France and Germany, have left investors in these bonds with guaranteed losses, if held to maturity (see also Draghi Beer Goggles).
Money Seeking Preferred Treatment
Investors and followers of mine have heard me repeatedly declare that “money goes where it is treated best.” When many investments are offering 0% (or negative yields), it comes as no surprise to me that dividend paying stocks have handily outperformed the overall bond market in recent years. Hard to blame someone investing in certain stocks offering between 2-6% in dividends when the alternative is offered at or near 0%.
While at Sidoxia we are still finding plenty of opportunities in the equity markets, I want to extend the reminder that not everyone can (or should) increase their equity allocation because of personal time horizon and risk tolerance constraints. Regardless, the current, restricting global financial markets are highlighting the scarcity of investment alternatives available.
As we will continue to be bombarded with more cease fires, quagmires and other bleeding headlines, investors will be better served by ignoring the irrelevant headlines and instead create a long-term financial plan with an asset allocation designed to meeting their personal goals. By following this strategy, you can let the dooms-dayers bleed while you succeed.

Wade W. Slome, CFA, CFP®
Plan. Invest. Prosper.
DISCLOSURE: Sidoxia Capital Management (SCM) and some of its clients hold positions in certain exchange traded funds (ETFs) and BAC, but at the time of publishing, SCM had no direct position in any other security referenced in this article. No information accessed through the Investing Caffeine (IC) website constitutes investment, financial, legal, tax or other advice nor is to be relied on in making an investment or other decision. Please read disclosure language on IC Contact page.
Back to the Future: Mag Covers (Part I)
Magazine Covers Part II – – – Magazine Covers Part III
I’m not referring to the movie, Back to the Future, about a plutonium-powered DeLorean time machine that finds Marty McFly (played by Michael J. Fox) traveling back in time. Rather, I am shining the light on the uncanny ability of media outlets (specifically magazines) to mark key turning points in financial markets – both market bottoms and market tops. This will be the first in a three part series, providing a few examples of how magazines have captured critical periods of maximum fear (buying opportunities) and greed (selling signals).
People tend to have short memories, especially when it comes to the emotional rollercoaster ride we call the stock market. Thanks to globalization, the internet, and the 24/7 news cycle, we are bombarded with some fear factor to worry about every day. Although I might forget what I had for breakfast, I have been a student of financial market history and have experienced enough cycles to realize as Mark Twain famously stated, “History never repeats itself, but it often rhymes” (read previous market history article). In that vein, let us take a look at a few covers from the 1970s:

Newsweek’s “The Big Bad Bear” issue came out on September 9, 1974 when the collapse of the so-called “Nifty Fifty” (the concentrated set of glamour stocks or “Blue Chips”) was in full swing. This group of stocks, like Avon, McDonalds, Polaroid, Xerox, IBM and Disney, were considered “one-decision” stocks investors could buy and hold forever. Unfortunately, numerous of these hefty priced stocks (many above a 50 P/E) came crashing down about 90% during the1973-74 period.
Why the glum sentiment? Here are a few reasons:
- Exiting Vietnam War
- Undergoing a Recession
- 9% Unemployment
- Arab Oil Embargo
- Watergate: Presidential Resignation
- Franklin National Failure

A cartoon from the same bearish 1974 cover article.
Not a rosy backdrop, but was this scary and horrific phase the ideal time to sell, as the magazine cover may imply? No, actually this was a shockingly excellent time to purchase equities. The Dow Jones Industrial Average, priced at 627 when the magazine was released, is now trading around 10,247…not too shabby a return considering the situation looked pretty darn bleak at the time.
Reports of the Market’s Death Greatly Exaggerated

Sticking with the Mark Twain theme, the reports of the market’s demise was greatly exaggerated too – much the same way we experienced the overstated reaction to the financial crisis early in 2009. BusinessWeek’s August 13, 1979 magazine captured the essence of the bearish mood in the article titled, “The Death of Equities.” This article came out, of course, about 18 months before a multi-decade upward explosion in prices that ended in the “Dot-com” crash of 2000. In the late 1970s, inflation reached double digit levels; gold and oil had more than doubled in price; Paul Volcker became the Federal Reserve Chairman and put on the economic brakes via a tough, anti-inflationary interest rate program; and President Jimmy Carter was dealing with an Iranian Revolution that led to the capture of 63 U.S. hostages. Like other bear market crashes in our history, this period also served as a tremendous time to buy stocks. As you can see from the chart above, the Dow was at 833 at the time of the magazine printing – in the year 2000, the Dow peaked at over 14,000.
This walk down memory lane is not complete. Conveniently, the Back to the Future story was designed as a trilogy (just like my three-part magazine review). You can relive Parts II & III here: Magazine Covers Part II – – – Magazine Covers Part III
Wade W. Slome, CFA, CFP®
Plan. Invest. Prosper.
DISCLOSURE: Sidoxia Capital Management (SCM) has a short position in MCD at the time this article was originally posted. SCM owns certain exchange traded funds, IBM, and DIS, but currently has no direct position in Avon (AVP), Polaroid, Xerox (XRX). No information accessed through the Investing Caffeine (IC) website constitutes investment, financial, legal, tax or other advice nor is to be relied on in making an investment or other decision. Please read disclosure language on IC “Contact” page.
Market Champagne Sits on Ice

Summer may be coming to an end, but the heat in the stock market has not cooled down, as the stock market registered its hottest August performance in 14 years (S&P 500 index up +3.8%). With these stellar results, one would expect the corks to be popping, cash flowing into stocks, and the champagne flowing. However, for numerous reasons, we have not seen this phenomenon occur yet. Until the real party begins, I suppose the champagne will stay on ice.
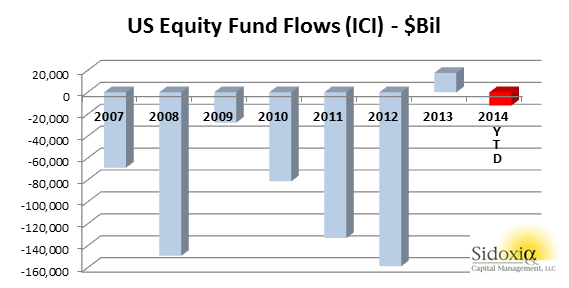
At the end of last year, I wrote further about the inevitable cash tsunami topic in an article entitled, “Here Comes the Dumb Money.” At that point in time, stocks had remarkably logged an approximate +30% return, and all indications were pointing towards an upsurge of investor interest in the stock market. So far in 2014, the party has continued as stocks have climbed another +8.4% for the year, but a lot of the party guests have not arrived yet. With the water temperature in the pool being so enticing, one would expect everyone to jump in the stock market pool. Actually, we have seen the opposite occur as -$12 billion has been pulled out of U.S. stock funds so far in 2014 (see ICI chart below).
How can the market be up +8.4% when money is coming out of stocks? For starters, companies are buying stock by the hundreds of billions of dollars. An estimated $480 billion of stock was purchased by corporations last year via share repurchase authorizations. Adding fuel to the stock fire are near record low interest rates. The ultra-low rates have allowed companies to borrow money at unprecedented rates for the purpose of not only buying back chunks of stock, but also buying the stock of whole companies (Mergers & Acquisitions). Thomson Reuters estimates that M&A activity in 2014 has already reached $2.2 trillion, up more than +70% compared to the same period last year.
Another factor contributing to the lackluster appetite for stocks is the general public’s apathy and disinterest in the market. This disconnected sentiment was captured beautifully by a recent Gallup survey, which asked people the following question:
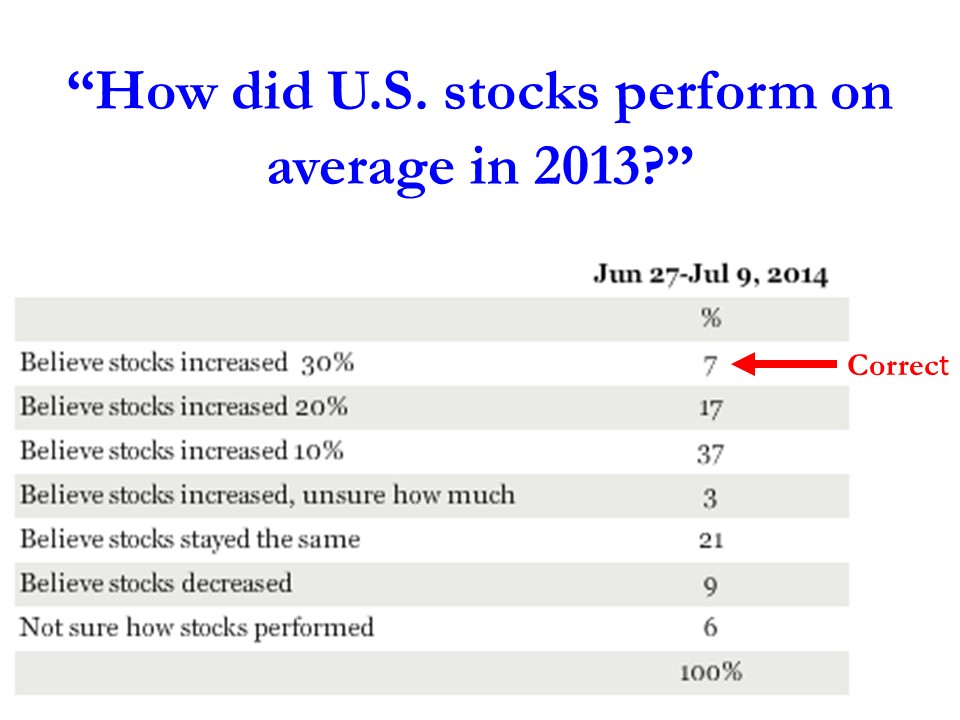
As you can see, only 7% of the respondents realized that stocks were up by more than +30% in 2013. More specifically, the S&P 500 (Large Cap) index was up +29.6%, S&P 600 (Small Cap) +39.7%, and the S&P 400 (Mid Cap) +31.6% (all percentages exclude dividends). Despite these data points, if taken with near 15-year low household stock ownership data, the results prove sentiment is nowhere near the euphoric phases reached before the 2000 bubble burst or the 2006-2008 real estate collapse.
Beyond the scarring effects of the 2008-2009 financial crisis, tempered moods regarding stocks can also be attributed to fresher geopolitical concerns (i.e., military tensions in Ukraine, Islamic extremists in Iraq, and missile launches from the Gaza Strip). The other area of never-ending anxiety is Federal Reserve monetary policy. The stock market, which has tripled in value from early 2009, has skeptics continually blaming artificial Quantitative Easing/QE policies (stimulative bond purchases) as the sole reason behind stocks advance. With current Fed Chair Janet Yellen pulling 70% of the QE punch bowl away (bond purchases now reduced to $25 billion per month), the bears are having a difficult time explaining rising stock prices and declining interest rates. Once all $85 billion in monthly QE purchases are expected to halt in October, skeptics will have one less leg on their pessimistic stool to sit on.
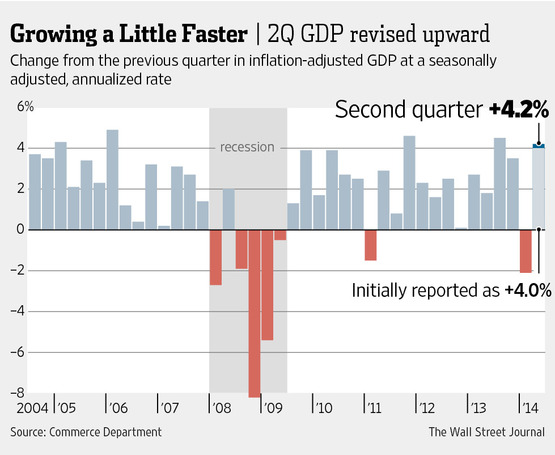
Economy and Profits Play Cheery Tune
While geopolitical and Federal Reserve clouds may be preventing many sourpusses from joining the stock party, recent economic and corporate data have party attendees singing a cheery tune. More specifically, the broadest measurement of economic activity, GDP (Gross Domestic Product), came in at a higher-than-expected level of +4.2% for the 2nd quarter (see Wall Street Journal chart below).
Moreover, the spike in July’s Durable Goods orders also paints a healthy economic picture (see chart below). The data is volatile (i.e., Boeing Co orders – BA), nevertheless, CEO confidence is on the rise. Improved confidence results in executives opening up their wallets and investing more into their businesses.
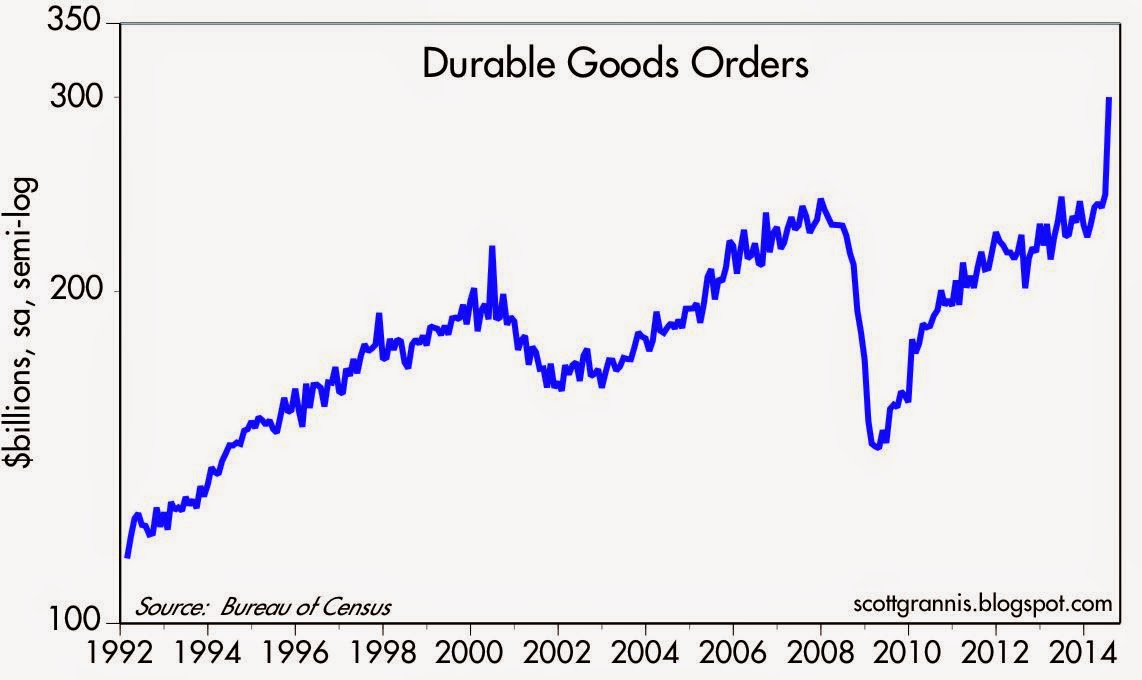
Source: Calafia Beach Pundit
Last but not least, the lifeblood of appreciating stock prices (earnings/profits) have been accelerating higher. In the most recent quarterly results, we saw a near doubling of the growth rate from 1st quarter’s +5% growth rate to 2nd quarter’s +10% growth rate (see chart below).
Source: Dr. Ed’s Blog
With the S&P 500 continuing to make new record highs despite scary geopolitical and Federal Reserve policy concerns, the stock market party is still waiting for guests to arrive. When everyone arrives and jumps in the pool, it will be time to pop the corks and sell. Until then, there is plenty of appreciation potential as the champagne sits on ice.
Psst…Do You Want to Join the Club?

 
#2. Don’t waste your time listening to the media.
Like dieting, the framework is simple to understand, but difficult to execute. Theoretically, if you follow Rule #1, you don’t have worry about Rule #2. Unfortunately, many people have no rules or discipline in place, and instead let their emotions drive all investing decisions. When it comes to following the media, Mark Twain stated it best:
“If you don’t read the newspaper, you are uninformed. If you do read the newspaper, you are misinformed.”
It’s fine to be informed, as long as the deluge of data doesn’t enslave you into bad, knee-jerk decision-making. You’ve seen those friends, family members and co-workers who are glued to their cell phones or TVs while insatiably devouring real-time data from CNBC, CNN, or their favorite internet blog. The grinding teeth and sweaty palms should be a dead giveaway that these habits are not healthy for investment account balances or blood pressure.
Thanks to the endless scary headlines and stream of geopolitical turmoil (fear sells), millions of investors have missed out on one of the most staggering bull market rallies in history. More specifically, the S&P 500 index (large capitalization companies) has almost tripled in value from early 2009 (666 to 1,931) and the S&P 600 index (small capitalization companies) almost quadrupled from 181 to 645.
The Challenge

Becoming a member of the Successful Investors Club (SIC) is no easy feat. As I’ve written in the past, the human brain has evolved dramatically over tens of thousands of years, but the troubling, emotionally-driven amygdala tissue mass at the end of the brain stem (a.k.a., “Lizard Brain“) still remains. The “Lizard Brain” automatically produces a genetic flight response to perceived worrisome stimuli surrounding us. In other words, our “Lizard Brain” often interprets excessively sensationalized current events as a threat to our financial security and well-being.
It’s no wonder amateur investors have trouble dealing with the incessantly changing headlines. Yesterday, investors were panicked over the P.I.I.G.S (Portugal, Italy, Ireland, Greece, Spain), the Arab Spring (Tunisia, Egypt, Iran, etc.), and Cyprus. Today, it’s Ukraine, Argentina, Israel, Gaza, Syria, and Iraq. Tomorrow…who knows? It’s bound to be another fiscally irresponsible country, terrorist group, or autocratic leader wreaking havoc upon their people or enemies.
During the pre-internet or pre-smartphone era, the average person couldn’t even find Ukraine, Syria, or the Gaza Strip on a map. Today, we are bombarded 24/7 with frightening stories over these remote regions that have dubious economic impact on the global economy.
Take the Ukraine for example, which if you think about it is a fiscal pimple on the global economy. Ukraine’s troubled $177 billion economy, represents a mere 0.29% of the $76 trillion global GDP. Could an extended or heightened conflict in the region hinder the energy supply to a much larger and significant European region? Certainly, however, Russian President Vladimir Putin doesn’t want the Ukrainian skirmish to blow up out of control. Russia has its own economic problems, and recent U.S. and European sanctions haven’t made Putin’s life any easier. The Russian leader has a vested economic interest to keep its power hungry European customers happy. If not, the U.S.’s new found resurgence in petroleum supplies from fracking will allow our country to happily create jobs and export excess reserves to a newly alienated EU energy buyer.
The Solution

 
Rather than be hostage to the roller coaster ride of rising and falling economic data points, it’s better to follow the sage advice of investing greats like Peter Lynch, who averaged a +29% return per year from 1977 – 1990.
Here’s what he had to say about news consumption:
“If you spend more than 13 minutes analyzing economic and market forecasts, you’ve wasted 10 minutes.”
 
“Far more money has been lost by investors preparing for corrections, or trying to anticipate corrections, than has been lost in corrections themselves.”
Rather than fret about the direction of the market, at Sidoxia Capital Management we are focused on identifying the best available opportunities, given any prevailing economic environment (positive or negative). We assume the market will go nowhere and invest our client assets (and personal assets) accordingly by focusing on those areas we see providing the most attractive risk-adjusted returns. Investors who try to time the market, fail miserably over the long-run. If timing the market were easy, you would see countless people’s names at the tops of the Forbes billionaire list – regrettably that simply is not the case.
Since “fear” sells in the media world, it’s always important to sift through the deluge of data to gain a balanced perspective. During panic periods, it’s important to find the silver linings. When everyone is euphoric, it’s vital to discover reasons for caution.
While a significant amount of geopolitical turmoil occurred last month, it’s essential to remember the underlying positive fundamentals propelling the stock market to record highs. The skeptics of the recovery and record stock market point to the Federal Reserve’s unprecedented, multi-trillion dollar money printing scheme (Quantitative Easing – QE) and the inferior quality of the jobs created. Regarding the former point, if QE has been so disastrous, I ask where is the run-away inflation (see chart below)? While the July jobs report may show some wage pressure, you can see we’re still a long ways away from the elevated pricing levels experienced during the 1970s-1980s.

Source: Calafia Beach Pundit
A final point worth contemplating as it relates to the unparalleled Fed Policy actions was highlighted by strategist Scott Grannis. If achieving real economic growth through money printing was so easy, how come Zimbabwe and Argentina haven’t become economic powerhouses? The naysayers also fail to acknowledge that the Fed has already reversed the majority of its stimulative $85 billion monthly bond buying program (currently at $25 billion per month). What’s more, the Federal Open Market Committee has already signaled a rate hike to 1.13% in 2015 and 2.50% in 2016 (see chart below).

Source: Financial Times
The rise in interest rates from generationally low levels, especially given the current status of our improving economy, as evidenced by the recent robust +4.0% Q2-GDP report, is inevitable. It’s not a matter of “if”, but rather a matter of “when”.
On the latter topic of job quality, previously mentioned, I can’t defend the part-time, underemployed nature of the employment picture, nor can I defend the weak job participation rate. In fact, this economic recovery has been the slowest since World War II. With that said, about 10 million private sector jobs have been added since the end of the Great Recession and the unemployment rate has dropped from 10% to 6.1%. However you choose to look at the situation, more paychecks mean more discretionary dollars in the wallets and purses of U.S. workers. This reality is important because consumer spending accounts for 70% of our country’s economic activity.
While there is a correlation between jobs, interest rates, and the stock market, less obvious to casual observers is the other major factor that drives stock prices…record corporate profits. That’s precisely what you see in the chart below. Not only are trailing earnings at record levels, but forecasted profits are also at record levels. Contrary to all the hyped QE Fed talk, the record profits have been bolstered by important factors such as record manufacturing, record exports, and soaring oil production …not QE.

Join the Club
Those who have been around the investing block a few times realize how challenging investing is. The deafening information noise instantaneously accessed via the internet has only made the endeavor of investing that much more challenging. But the cause is not completely lost. If you want to join the bull market and the SIC (Successful Investors Club), all you need to do is follow the two top secret rules. Creating a plan and sticking to it, while ignoring the mass media should be easy enough, otherwise find an experienced, independent investment advisor like Sidoxia Capital Management to help you join the club.
Wade W. Slome, CFA, CFP®
Plan. Invest. Prosper.
DISCLOSURE: Sidoxia Capital Management (SCM) and some of its clients hold long positions in certain exchange traded funds ans securities, but at the time of publishing SCM had no direct position in any other security referenced in this article. No information accessed through the Investing Caffeine (IC) website constitutes investment, financial, legal, tax or other advice nor is to be relied on in making an investment or other decision. Please read disclosure language on IC Contact page.


