Posts filed under ‘Accounting’
Quickly Out of the Gate

The race into 2024 has begun, and the U.S. market is off to a quick start. The S&P 500 jumped out of the gates by +1.6%, and the technology and AI (Artificial Intelligence) – heavy NASDAQ index raced out by +1.2%. The bull market rally broadened out at the end of 2023, but 2024 returned to the leaders of last year’s pack, the Magnificent 7 (see also Mission Accomplished). Out front, in the lead of the Mag 7, is Nvidia with a +24% gain in January.
Inflation dropping (see chart below), the Federal Reserve signaling a decline in interest rates, low unemployment (3.7%), and healthy economic growth (+3.3% Q4 – GDP) have all contributed to the continuing bull market run.

Source: Yardeni.com
Consumer spending is the number one driver of economic growth, and consumers remain relatively confident about future prospects as seen in the recently released Conference Board Consumer Confidence numbers released this week (see chart below).
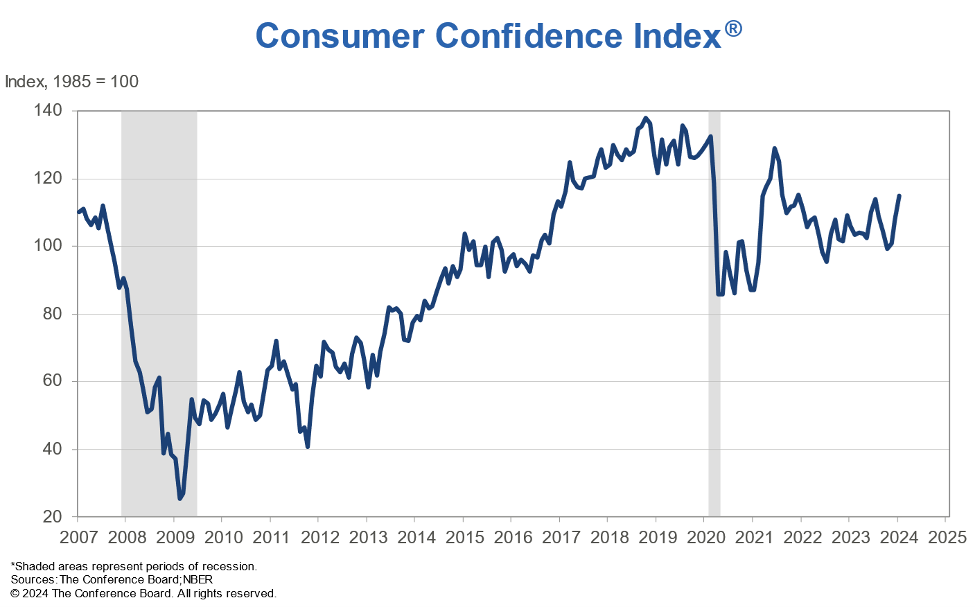
Source: Conference Board
But the race isn’t over yet, and there are always plenty of issues to worry about. The world is an uncertain place. Here are some of the concerns du jour:
– Red Sea conflict led by the Yemen-based, rebel group, Houthis
– Gaza war between Israel and Hamas
– Anxiety over November presidential election
– Ukraine – Russia war
Money Goes Where It is Treated Best
There are plenty of domestic concerns regarding government debt, deficit levels, and political frustrations on both sides of the partisan aisle remain elevated. When it comes to the financial markets, money continues to go where it is treated best. Sure, we have no shortage of problems or challenges, but where else are you going to put your life savings? China? Europe? Russia? Japan?
Well, as you can see in the chart below, anti-democratic, anti-American business, and confrontational military policies instituted by China have not benefitted investors – the U.S. stock market (S&P 500) has trounced the Chinese stock market (MSCI) over the last 30 years.
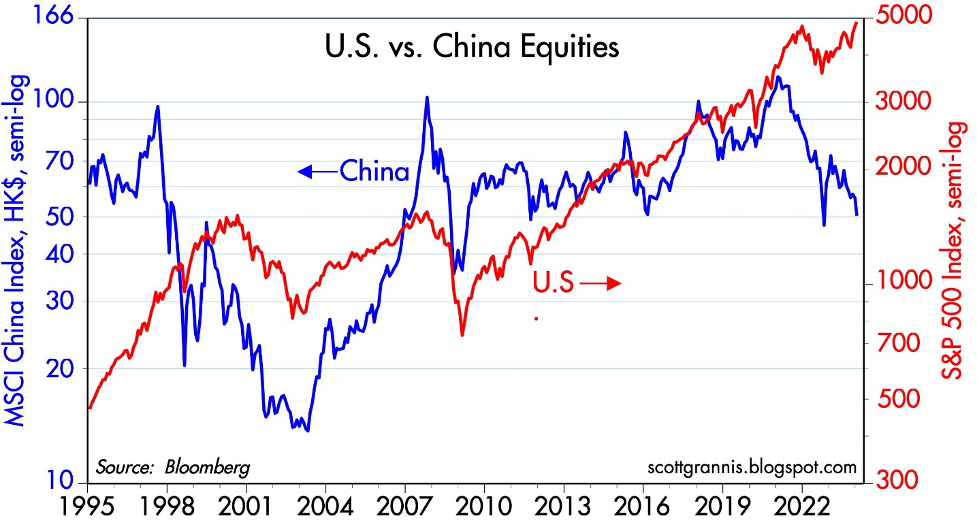
Source: Calafia Beach Pundit
For years, market critics and pessimists have been screaming doom-and-gloom as it relates to the United States. The story goes, the U.S. is falling apart, government spending and debt levels are out of control, politicians are corrupt, and we’re going into recession, thanks in part to higher interest rates and inflation. Well, if that’s the case, then why has the value of the U.S. dollar increased over the last 10 years (see chart below)? And why is the stock market at all-time record-highs?
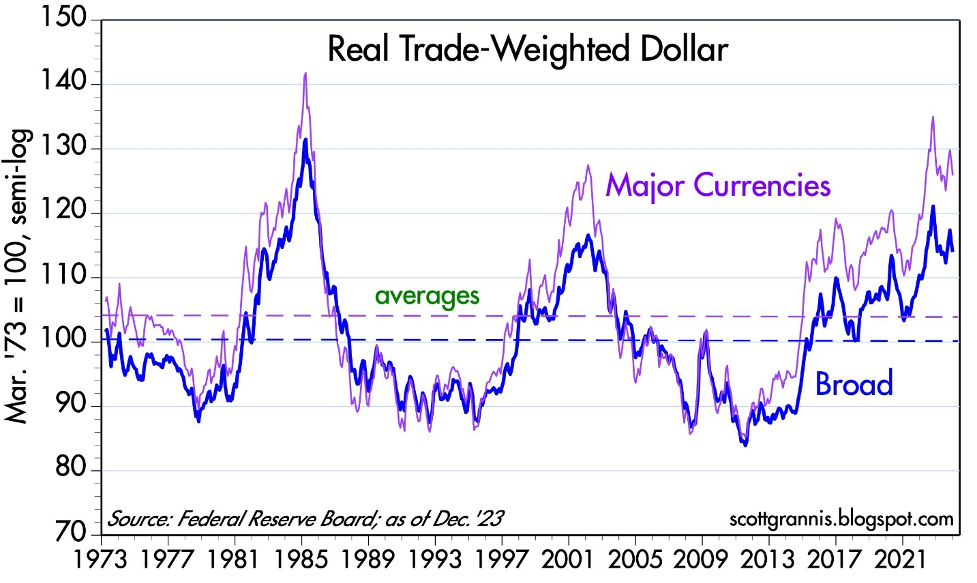
Source: Calafia Beach Pundit
Global investors are discerning in which countries they invest their hard-earned money. Global capital will flow to those countries with a rule of law, financial transparency, prudent tax policy, lower inflation, higher profit growth, lower interest rates, sensible fiscal and monetary policies, among other pragmatic business practices. There’s a reason they call it the “American Dream” and not the “Chinese Dream.” Our capitalist economy is far from perfect, but finding another country with a better overall investing environment is nearly impossible. There’s a reason why venture capitalists, private equity managers, sovereign wealth funds, hedge funds, and foreign institutions are investing trillions of their dollars in the United States. Money goes where it is treated best!
As money sloshes around the world, the 2024 investing race has a long way before it’s over, but at least the stock market has quickly gotten out of the gate and built a small lead.
Wade W. Slome, CFA, CFP®
Plan. Invest. Prosper.
This article is an excerpt from a previously released Sidoxia Capital Management complimentary newsletter (February 1, 2024). Subscribe Here to view all monthly articles.
DISCLOSURE: Sidoxia Capital Management (SCM) and some of its clients hold positions in NVDA, and certain exchange traded funds (ETFs), but at the time of publishing had no direct position in any other security referenced in this article. No information accessed through the Investing Caffeine (IC) website constitutes investment, financial, legal, tax or other advice nor is to be relied on in making an investment or other decision. Please read disclosure language on IC Contact page.
Sidoxia Webinar: The Keys to ’23 & What’s in Store for ’24 – Market Update

Unlock valuable insights at our upcoming webinar:
The Keys to ’23 & What’s in Store for ’24!
Tuesday, January 30th at 12:00 PM
Click the Zoom link below to register:
https://sidoxia.link/Webinar-Registration
Don’t miss out on the latest trends and expert discussions.
We will delve into a comprehensive market update. Register now!
The Douglas Coleman Show Interviews Wade Slome

Wade Slome, President and Founder of Sidoxia Capital Management, recently had the pleasure of being featured on The Douglas Coleman Show hosted by Douglas Coleman.
Drawing from professional and personal life lessons, Wade shares his knowledge about navigating market trends, building investment strategies, and also discuss the books he has authored.
If you are interested in learning more about the books Wade has authored, please visit: https://www.sidoxia.com/wades-books
This Baby Bull Has Time to Grow

You may have witnessed some fireworks on New Year’s Eve, but those weren’t the only fireworks exploding. The last two months of 2023 finished with a bang! More specifically, over this short period, the S&P 500 index skyrocketed +13.7%, NASDAQ +16.8%, and the Dow Jones Industrial Average +14.0%. The gains have been even more impressive for the cheaper, more interest-rate-sensitive small-cap stocks (IJR +21.8%), which I have highlighted for months (see also AI Revolution).
For the full year, the bull market was on an even bigger stampede: S&P 500 +24%, NASDAQ +43%, and Dow +14%.
Although 2023 closed with a festive explosion, 2022 ended with a bearish growl. Effectively, 2023 was a reverse mirror image of 2022. In 2022, the stock market fell -19% (S&P) due to a spike in inflation. Directionally, interest rates followed inflation higher as the Fed worked through the majority of its 0% to 5.5% Federal Funds rate hiking cycle.
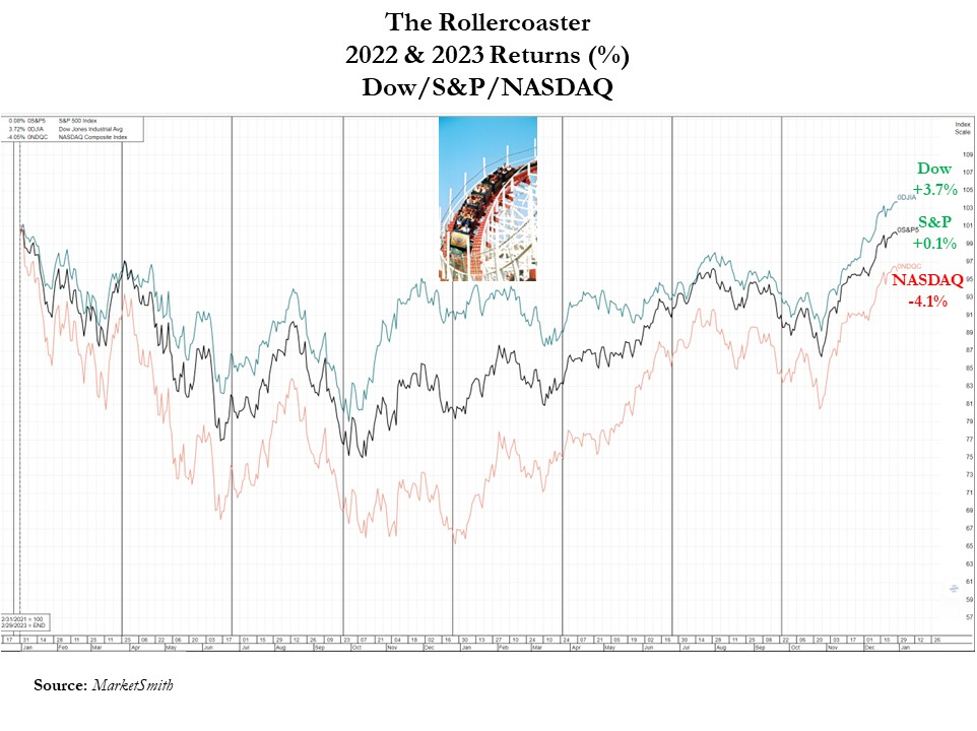
To sum it up simply, the last two years have been like riding a rollercoaster. For the year just ended, much of the year felt like a party, but 2022 felt more like a funeral. When you add the two years together, it was more of a lackluster result. For 2022-2023 combined, results registered at a meager +0.1% for the S&P, +3.7% for the Dow, and -4.0% for the NASDAQ (see chart below).
For those saying the good times of 2023 cannot continue, investors should understand that history paints a different picture. As you can see from the stock market cycles chart (below) that spans back to 1962, the average bull market lasts 51 months (i.e., 4 years, 3 months), while the average bear market persists a little longer than 11 months. This data suggests the current one-year-old baby bull market has plenty of room to grow more.
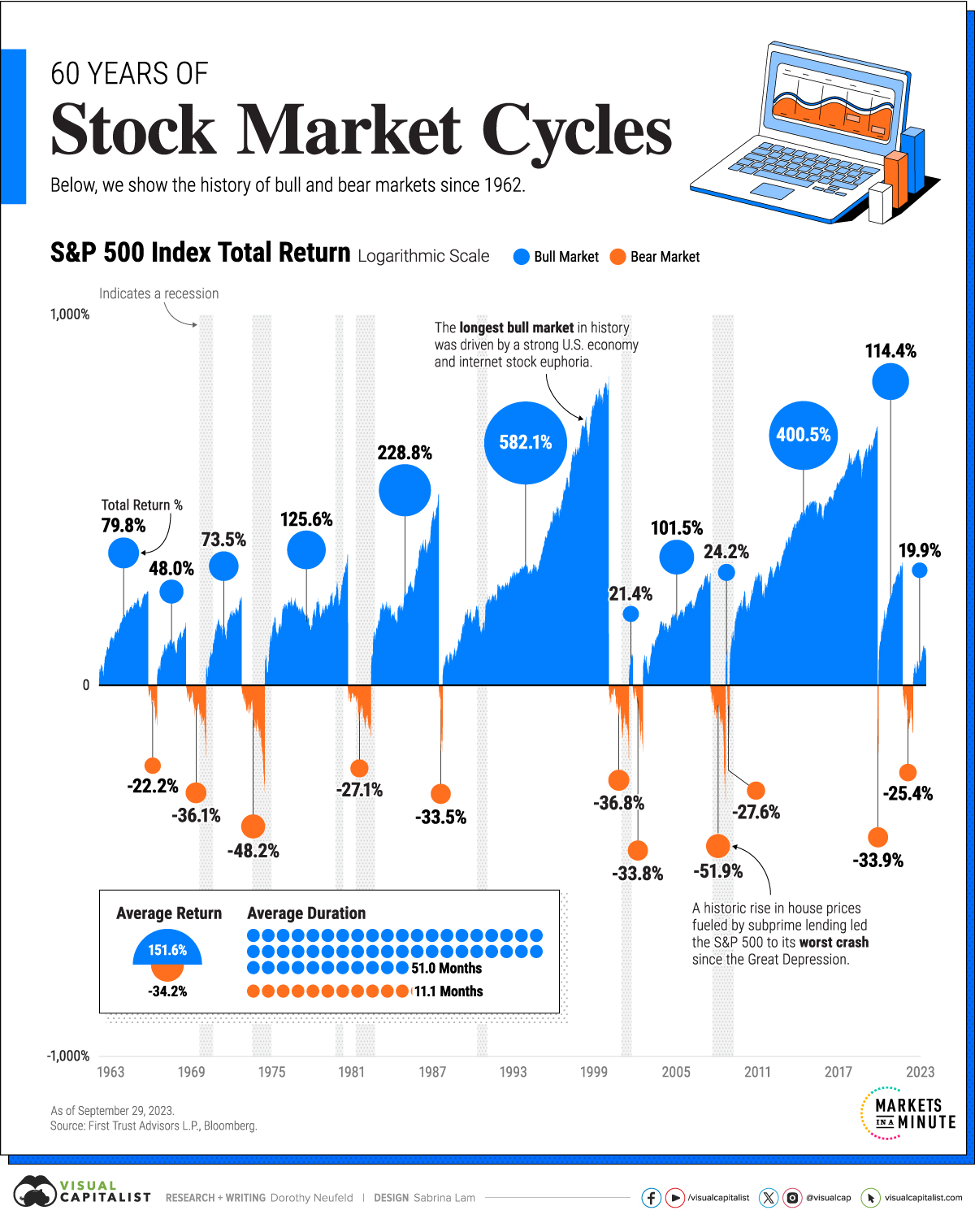
Source: Visual Capitalist
Why So Bullish?
What has investors so jazzed up in recent months? For starters, inflation has been on a steady decline for many months. With China’s stagnating economy, it has helped our inflationary cause by exporting deflationary goods to our country. As you can see from the Personal Consumption Deflator chart below, this broad inflation measure has declined to the Federal Reserve’s 2% target level. Jerome Powell, the Federal Reserve Chairman has been paying attention to these statistics, as evidenced by the central bank’s forecast at the Fed’s recent policy meeting last month on December 13th for three interest rate cuts in 2024. This so-called “Powell Pivot” is a reversal in tone by the Fed, which had been on a relentless rampage of interest rate hikes, over the last two years.
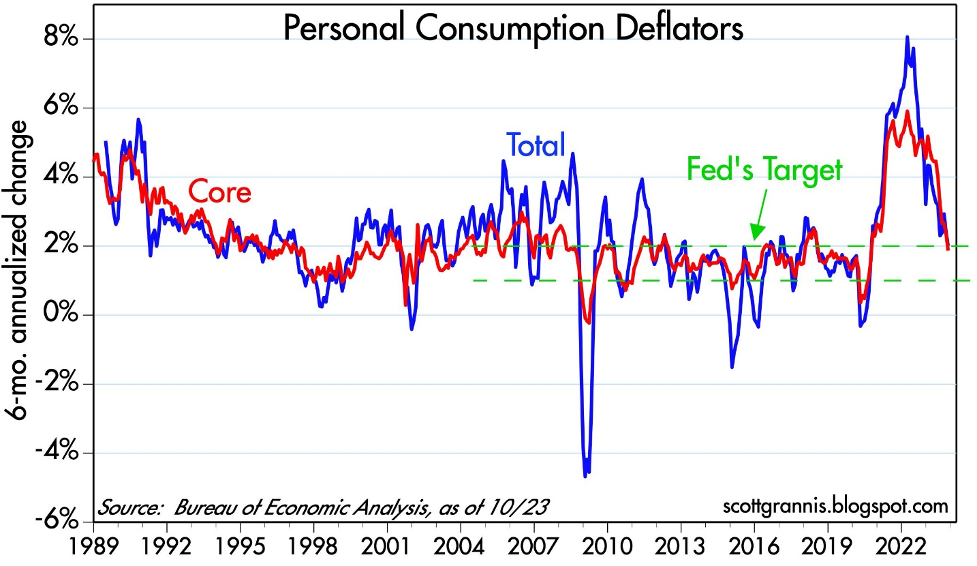
Source: Calafia Beach Pundit
This interest rate cycle headwind has turned into a tailwind as investors now begin to discount the probability of future rate cuts in 2024. The relief of lower interest rates can be felt immediately, whether you consider declining mortgage and car loan rates for consumers, or credit line and corporate loan rates for businesses. This trend can be seen in the benchmark 10-Year Treasury Note yield, which has declined from a peak of 5.0% a few months ago to 3.9% today (see chart below).
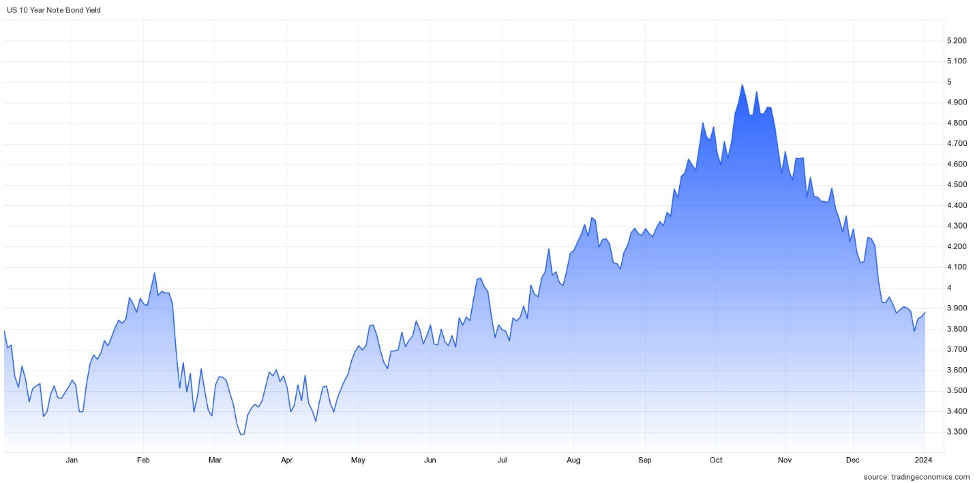
Source: Trading Economics
Declining inflation and interest rates explain a lot of investor optimism, but there are additional reasons to be sanguine. The economy remains strong, unemployment remains low, AI (Artificial Intelligence) applications are improving worker productivity, trillions of potential stock market dollars remain on the sidelines in money market accounts, and corporate profits have resumed rising near all-time record levels (see chart below).
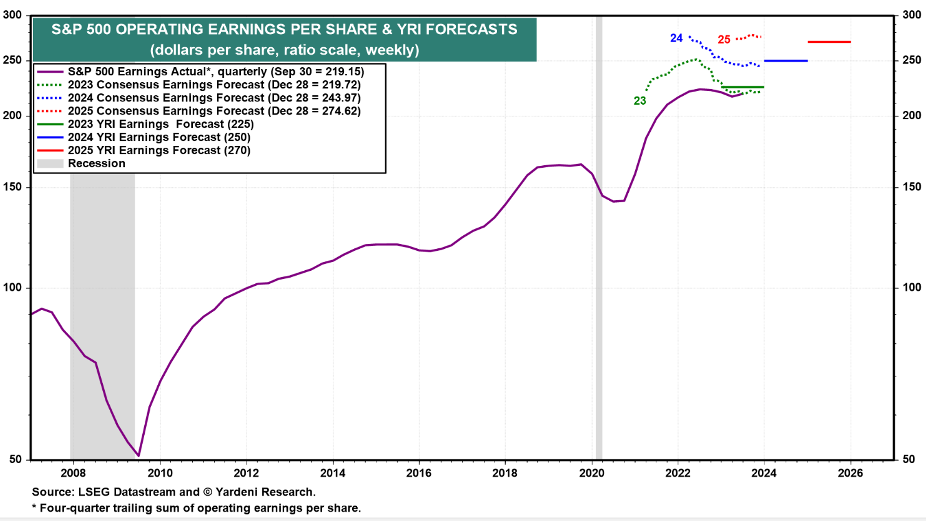
Source: Yardeni.com
What could go wrong? There are always plenty of unforeseen issues that could slow or reverse our economic train. Geopolitical events in Russia or the Middle East are always difficult to predict, and we have a presidential election in 2024, which could always negatively impact sentiment. This new bull market had a great start in 2023, but in historical terms, it is only a baby. Time will tell if 2024 will make this baby cry, but whatever the market faces, declining inflation and interest rates should act as a pacifier.
Wade W. Slome, CFA, CFP®
Plan. Invest. Prosper.
This article is an excerpt from a previously released Sidoxia Capital Management complimentary newsletter (January 2, 2024). Subscribe Here to view all monthly articles.
DISCLOSURE: Sidoxia Capital Management (SCM) and some of its clients hold positions in individual stocks, and certain exchange traded funds (ETFs), but at the time of publishing had no direct position in any other security referenced in this article. No information accessed through the Investing Caffeine (IC) website constitutes investment, financial, legal, tax or other advice nor is to be relied on in making an investment or other decision. Please read disclosure language on IC Contact page.
No Market Roar Due to War

The devastating damage to humanity from the Israeli-Hamas war that is in and around the Gaza strip should not be diminished or understated – innocent lives on both sides suffer in any conflict. However, the economic impact should not be overstated either. In other words, the hundreds of billions of dollars in financial stock market losses this month are not proportional to the Mideast economic losses incurred thus far.
To put the events in perspective, the population of Israel approximates 10 million people and the population located in the Gaza Strip is about two million people. There are more than eight billion people on the planet, so Israel/Gaza represents roughly 1/7 of 1% of the global population.
From an economic standpoint, the combined economic output of Israel/Gaza Strip accounts for around ½ of 1% of global GDP (see chart below – small slivers in the blue section).
And let’s not forget, economic activity is not dropping to zero. From an economic standpoint, the war’s financial impact is even smaller – a rounding error.

Source: Visual Capitalist
However, wars do not exist in a vacuum, and tensions in the Middle East have the potential of having a ripple effect. Whenever rumblings occur in the Mideast, one of the largest global sectors to be first impacted is the oil market. Approximately 20-30% of the world’s oil is trafficked through the Strait of Hormuz in the Persian Gulf, so it was not surprising to see a short-term spike in oil prices to almost $90 per barrel in early October after the Gaza invasion of Israel. By the end of the month, oil has settled back down to about $81 per barrel, almost precisely the same price right before the war started. On a year-over-year basis, oil prices are actually down approximately -5%, thereby providing minor relief to gas-powered car drivers.
If Iran, or Iran-backed militant group Hezbollah, throws their hat into the Israel-Hamas war ring, the U.S. and other Western allies may retaliate and escalate tensions in the region, which would unlikely be received well by the financial markets.
As a result of these domino effect fears in the region, the stock market took another leg down last month with the S&P 500 index declining -2.2%, the Dow Jones Industrial Average -1.4%, and the NASDAQ index fell the most, -2.8%. The world is a dangerous place, but we have seen this movie before – this is nothing new. We would all prefer world peace, but unfortunately, wars and skirmishes have gone on for centuries.
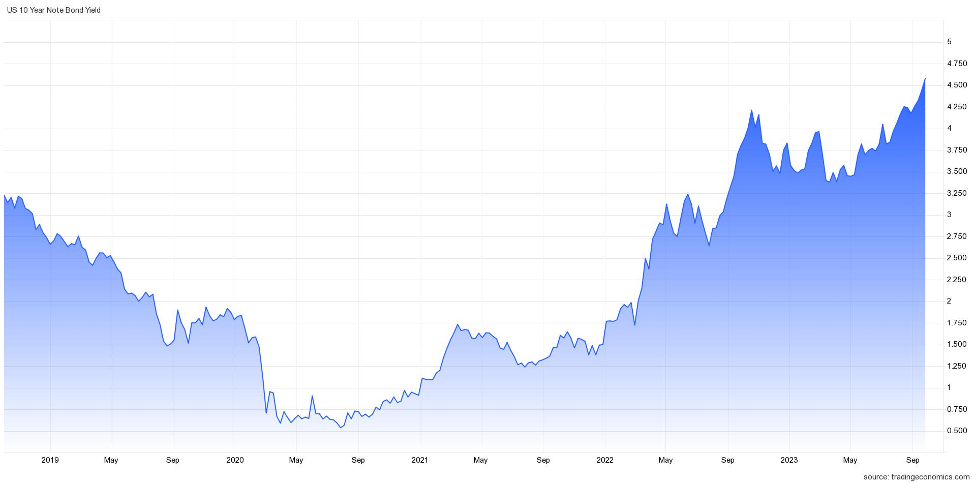
As Interest Rates Soar, Bonds Offer More
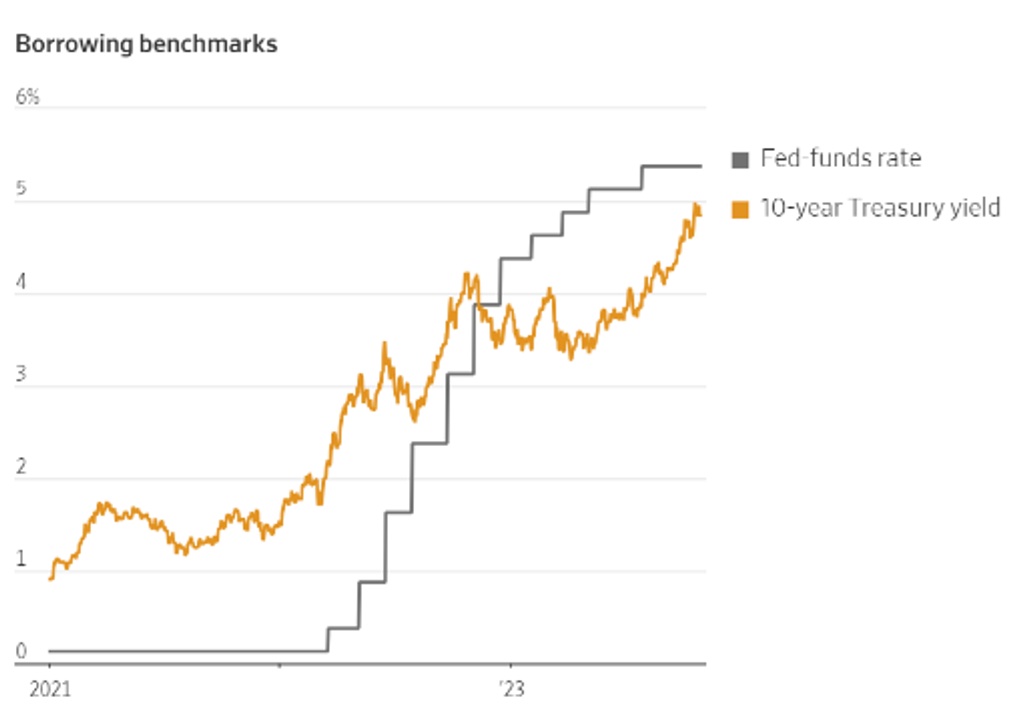
Source: Wall Street Journal
No, TINA is not the name of my high school girlfriend or wife, but rather the acronym TINA (There Is No Alternative) existed in recent years during the Federal Reserve’s zero-interest rate policy days. More specifically, TINA referred to the lack of investment alternatives to equities (i.e., stocks) when money effectively earned 0% in the bank and close-to-0% in many fixed income securities (i.e., bonds). In fact, at one point, although it is still hard to believe, there were more than $16 trillion in bonds paying negative interest rates – pure insanity.
TINA Turns into FIONA
Given the large increase in interest rates by the Federal Reserve over two years (from 0% to 5.50%), investors have been given a short-term gift. As you can see from the chart above, yields on 10-Year Treasury Notes have risen to almost 5.0%. And believe it or not, shorter term bonds are currently providing yields even higher than this. The three-month, six-month, one-year, and two-year Treasuries are all yielding higher rates than 10-Year Treasury yields (i.e., inverted yield curve) – see table below. So, TINA has changed to FIONA – Fixed Income Opens New Alternatives. What’s more, for individuals with taxable accounts, the interest earned on Treasuries is tax-free at the state level, thereby making this short-term gift in yields even more attractive for investors.

Source: Trading Economics
Stock prices were down again for the month, and investment sentiment has been souring due to the war in the Middle East, but there is still plenty of reasons to remain constructive. Not only is the economy strong (e.g., 3rd quarter GDP of +4.9%), but the consumer also remains strong (see Consumer Wallets Strong) in large part because the unemployment rate remains near record lows (+3.8%). While anxiety rises due to the war, stock prices get cheaper, and opportunities increase. And although interest rates remain elevated, the Federal Reserve is signaling they are closer to a rate hiking end, inflation is cooling and FIONA is offering more attractive yields than during the TINA era. It’s true, this month stocks did not roar due to the war, but patient and opportunistic investors will be rewarded with more.
Wade W. Slome, CFA, CFP®
Plan. Invest. Prosper.
This article is an excerpt from a previously released Sidoxia Capital Management complimentary newsletter (November 1, 2023). Subscribe Here to view all monthly articles.
DISCLOSURE: Sidoxia Capital Management (SCM) and some of its clients hold positions in individual stocks, and certain exchange traded funds (ETFs), but at the time of publishing had no direct position in any other security referenced in this article. No information accessed through the Investing Caffeine (IC) website constitutes investment, financial, legal, tax or other advice nor is to be relied on in making an investment or other decision. Please read disclosure language on IC Contact page.
Consumer Wallets Strong, Rate Hikes Long, What Could Go Wrong?

Consumer wallets and balance sheets remain flush with cash as employment remains near record-high levels. Cash in consumer wallets and money in the bank help the economy keep chugging along at a healthy clip. More specifically, as you can see in the chart below, the net worth of U.S. households has reached a record $154.3 trillion dollars in the most recent month, thanks to appreciation in stocks, gains in real estate, and relatively stable levels of debt.

Source: Calafia Beach Pundit
Unemployment Remains Low
In addition, the unemployment rate is sitting at 3.8%, near multi-decade lows (see chart below).
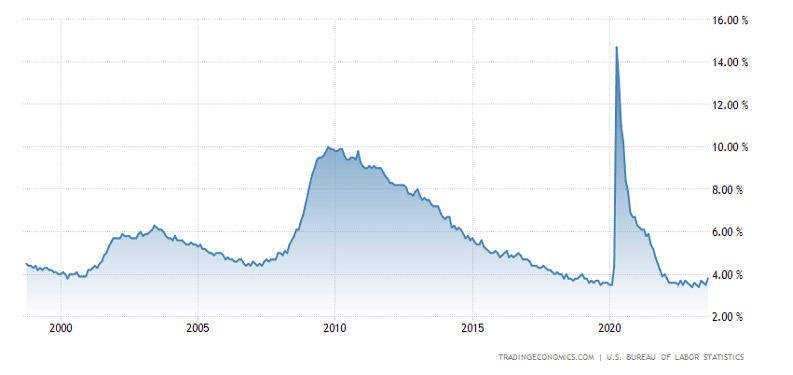
Source: Trading Economics
As long as consumers continue to hold a job, they will continue spending to buoy economic activity – remember, consumer spending accounts for roughly 70% of our country’s economic activity. Case in point are the most recently released GDP (Gross Domestic Product) forecasts by the Atlanta Federal Reserve, which show 3rd quarter GDP growth estimated at a 4.9% rate (see chart below).

Rates Up, Housing Prices Up?
Yes, it’s true, despite a dramatic surge in mortgage rates over the last few years, the housing market remains strong due to a very tight supply of homes available for sale. Most homeowners with a mortgage have refinanced to a rate in the range of 3% (or in some cases even lower), so selling and moving into a new home with a mortgage at current rates of 7.3% is not that appealing. In other words, if you decide to move, your monthly mortgage payment could potentially go up by more > 50%, which could equate to thousands of dollars per month. Under this scenario, you are likely to stay put and not sell your home.
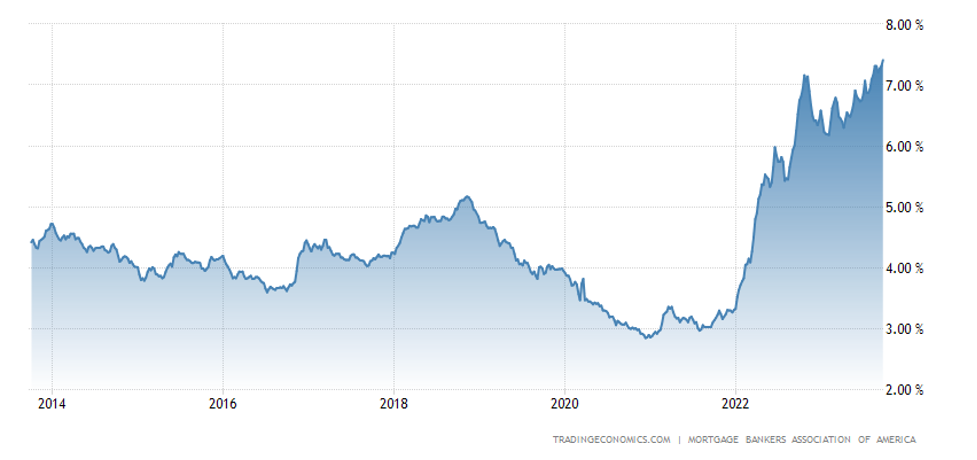
Source: Trading Economics
The embedded economic disincentive of selling a home with a mortgage has really put a real crimp on the supply of homes available for sale (chart below). As you can see, the inventory of homes has dramatically collapsed from a peak of about four million homes, circa the 2008 Financial Crisis, to around one million homes today.
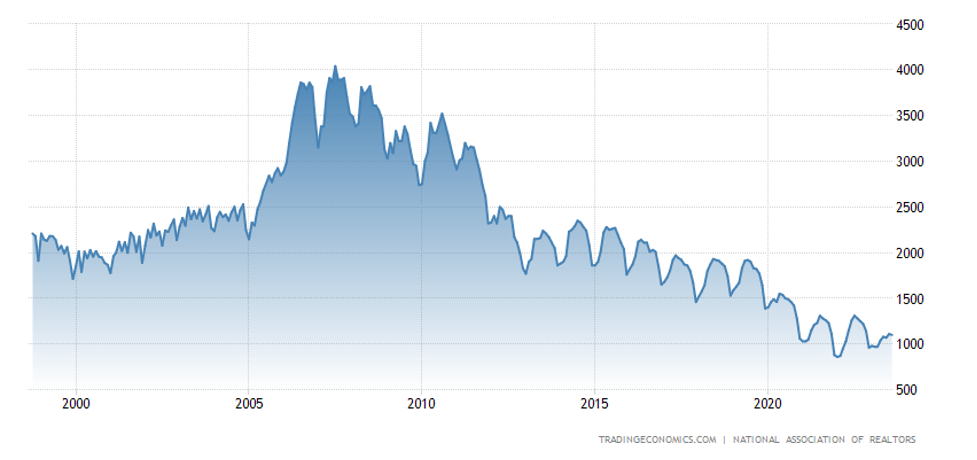
Source: Trading Economics
In the face of this mixed data, the stock market finished a hot summer with a cool whimper last month, in large part due to a 0.49% increase in the 10-Year Treasury Note yield to 4.58% (see chart below). The S&P 500 index fell -4.9% for the month, the technology-heavy NASDAQ index dropped even further by -5.8%, while the Dow Jones Industrial Average outperformed, down -3.5% for the month. Worth noting, however, the Dow has significantly underperformed the other indexes so far this year.
Source: Trading Economics
Inflation on the Mend
The Fed continues to talk tough about fighting inflation after taking interest rates from 0% to 5.5% over the last two years, nevertheless inflation continues to come down. The Fed’s go-to Core PCE inflation datapoint that came out last Friday at +0.1% is consistent with the downward inflation trend we have been witnessing for many months now (see chart below). As you can see, inflation on annualized basis has reached 2.2%, nearly achieving the Federal Reserve’s target of 2.0%.
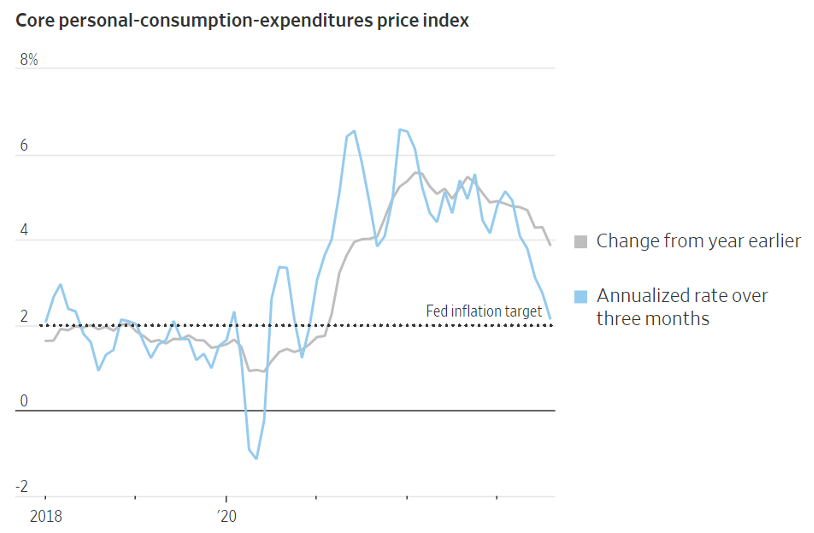
Source: The Wall Street Journal and Commerce Department
There is never a shortage of investor concerns. Today, worries include Federal Reserve policy; restarting of school loan repayments (after a three-year hiatus); a potential government shutdown; an auto and Hollywood strike; higher oil prices; and a presidential election that is heating up. Many of these worries are nothing new. The bull market took a pause for the month, but consumer wallets remain fat, the economy keeps chugging, the employment picture remains strong, and stock prices remain up +12% for the year (S&P 500). For the time being, betting on a soft economic landing over an imminent recession could be a winning use for that cash in your wallet.
Wade W. Slome, CFA, CFP®
Plan. Invest. Prosper.
This article is an excerpt from a previously released Sidoxia Capital Management complimentary newsletter (October 2, 2023). Subscribe Here to view all monthly articles.
DISCLOSURE: Sidoxia Capital Management (SCM) and some of its clients hold positions in individual stocks, and certain exchange traded funds (ETFs), but at the time of publishing had no direct position in any other security referenced in this article. No information accessed through the Investing Caffeine (IC) website constitutes investment, financial, legal, tax or other advice nor is to be relied on in making an investment or other decision. Please read disclosure language on IC Contact page.
EBITDA: Sniffing Out the Truth

Financial analysts are constantly seeking the Holy Grail when it comes to financial metrics, and to some financial number crunchers, EBITDA (Earnings Before Interest Taxes Depreciation and Amortization – pronounced “eebit-dah”) fits the bill. On the flip side, Warren Buffett’s right hand man Charlie Munger advises investors to replace EBITDA with the words “bullsh*t earnings” every time you encounter this earnings metric. We’ll explore the good, bad, and ugly attributes of this somewhat controversial financial metric.
The Genesis of EBITDA
The origin of the EBITDA measure can be traced back many years, and rose in popularity during the technology boom of the 1990s. “New Economy” companies were producing very little income, so investment bankers became creative in how they defined profits. Under the guise of comparability, a company with debt (Company X) that was paying high interest expenses could not be compared on an operational profit basis with a closely related company that operated with NO debt (Company Z). In other words, two identical companies could be selling the same number of widgets at the same prices and have the same cost structure and operating income, but the company with debt on their balance sheet would have a different (lower) net income. The investment banker and company X’s answer to this apparent conundrum was to simply compare the operating earnings or EBIT (Earnings Before Interest and Taxes) of each company (X and Z), rather than the disparate net incomes.
The Advantages of EBITDA
Although there is no silver bullet metric in financial statement analysis, nevertheless there are numerous benefits to using EBITDA. Here are a few:
- Operational Comparability: As implied above, EBITDA allows comparability across a wide swath of companies. Accounting standards provide leniency in the application of financial statements, therefore using EBITDA allows apples-to-apples comparisons and relieves accounting discrepancies on items such as depreciation, tax rates, and financing choice.
- Cash Flow Proxy:Since the income statement traditionally is the financial statement of choice, EBITDA can be easily derived from this statement and provides a simple proxy for cash generation in the absence of other data.
- Debt Coverage Ratios:In many lender contracts, certain debt provisions require specific levels of income cushion above the required interest expense payments. Evaluating EBITDA coverage ratios across companies assists analysts in determining which businesses are more likely to default on their debt obligations.
The Disadvantages of EBITDA
While EBITDA offers some benefits in comparing a broader set of companies across industries, the metric also carries some drawbacks.
- Overstates Income: To Charlie Munger’s point about the B.S. factor, EBITDA distorts reality by measuring income before a bunch of expenses. From an equity holder’s standpoint, in most instances, investors are most concerned about the level of income and cash flow available AFTERaccounting for all expenses, including interest expense, depreciation expense, and income tax expense.
- Neglects Working Capital Requirements: EBITDA may actually be a decent proxy for cash flows for many companies, however this profit measure does not account for the working capital needs of a business. For example, companies reporting high EBITDA figures may actually have dramatically lower cash flows once working capital requirements (i.e., inventories, receivables, payables) are tabulated.
- Poor for Valuation: Investment bankers push for more generous EBITDA valuation multiples because it serves the bankers’ and clients’ best interests. However, the fact of the matter is that companies with debt or aggressive depreciation schedules do deserve lower valuations compared to debt-free counterparts (assuming all else equal).
Wading through the treacherous waters of accounting metrics can be a dangerous game. Despite some of EBITDA’s comparability benefits, and as much as bankers and analysts would like to use this very forgiving income metric, beware of EBITDA’s shortcomings. Although most analysts are looking for the one-size-fits-all number, the reality of the situation is a variety of methods need to be used to gain a more accurate financial picture of a company. If EBITDA is the only calculation driving your analysis, I urge you to follow Charlie Munger’s advice and plug your nose.

Wade W. Slome, CFA, CFP®
Plan. Invest. Prosper.
DISCLOSURE: Sidoxia Capital Management (SCM) and some of its clients hold positions in certain exchange traded funds (ETFs), but at the time of publishing had no direct position in any other security referenced in this article. No information accessed through the Investing Caffeine (IC) website constitutes investment, financial, legal, tax or other advice nor is to be relied on in making an investment or other decision. Please read disclosure language on IC Contact page.
Sports & Investing: Why Strong Earnings Can Hurt Stock Prices

With the World Cup in full swing and rabid fans rooting for their home teams, one may notice the many similarities between investing in stocks and handicapping in sports betting. For example, investors (bettors) have opposing views on whether a particular stock (team) will go up or down (win or lose), and determine if the valuation (point spread) is reflective of the proper equilibrium (supply & demand). And just like the stock market, virtually anybody off the street can place a sports bet – assuming one is of legal age and in a legal betting jurisdiction.
Soon investors will be poring over data as part of the critical, quarterly earnings ritual. With some unsteady GDP data as of late, all eyes will be focused on this earnings reporting season to reassure market observers the bull advance can maintain its momentum. However, even positive reports may lead to unexpected investor reactions.
So how and why can market prices go down on good news? There are many reasons that short-term price trends can diverge from short-run fundamentals. One major reason for the price-fundamental gap is this key factor: “expectations”. With such a large run-up in the equity markets (up approx. +195% from March 2009) come loftier expectations for both the economy and individual companies. For instance, just because corporate earnings unveiled from companies like Google (GOOG/GOOGL), J.P. Morgan (JPM), and Intel (INTC) exceed Wall Street analyst forecasts does not mean stock prices automatically go up. In many cases a stock price correction occurs due to a large group of investors who expected even stronger profit results (i.e., “good results, but not good enough”). In sports betting lingo, the sports team may have won the game this week, but they did not win by enough points (“cover the spread”).
Some other reasons stock prices move lower on good news:
- Market Direction: Regardless of the underlying trends, if the market is moving lower, in many instances the market dip can overwhelm any positive, stock- specific factors.
- Profit Taking: Many times investors holding a long position will have price targets or levels, if achieved, that will trigger selling whether positive elements are in place or not.
- Interest Rates: Certain valuation techniques (e.g. Discounted Cash Flow and Dividend Discount Model) integrate interest rates into the value calculation. Therefore, a climb in interest rates has the potential of lowering stock prices – even if the dynamics surrounding a particular security are excellent.
- Quality of Earnings: Sometimes producing winning results is not enough (see also Tricks of the Trade article). On occasion, items such as one-time gains, aggressive revenue recognition, and lower than average tax rates assist a company in getting over a profit hurdle. Investors value quality in addition to quantity.
- Outlook: Even if current period results may be strong, on some occasions a company’s outlook regarding future prospects may be worse than expected. A dark or worsening outlook can pressure security prices.
- Politics & Taxes: These factors may prove especially important to the market this year, since this is a mid-term election year. Political and tax policy changes today may have negative impacts on future profits, thereby impacting stock prices.
- Other Exogenous Items: Natural disasters and security attacks are examples of negative shocks that could damage price values, irrespective of fundamentals.
Certainly these previously mentioned issues do not cover the full gamut of explanations for temporary price-fundamental gaps. Moreover, many of these factors could be used in reverse to explain market price increases in the face of weaker than anticipated results.
If you’re traveling to Las Vegas to place a wager on the World Cup, betting on winning favorites like Germany and Argentina may not be enough. If expectations are not met and the hot team wins by less than the point spread, don’t be surprised to see a decline in the value of your bet.
Wade W. Slome, CFA, CFP®
Plan. Invest. Prosper.
DISCLOSURE: Sidoxia Capital Management (SCM) and some of its clients own certain exchange traded funds, GOOG, and GOOGL, but at the time of publishing had no direct positions in JPM and INTC. No information accessed through the Investing Caffeine (IC) website constitutes investment, financial, legal, tax or other advice nor is to be relied on in making an investment or other decision. Please read disclosure language on IC “Contact” page.
Monitoring the Tricks Hidden Up Corporate Sleeves

As Warren Buffett correctly states, “If you are in a poker game and after 20 minutes, you don’t know who the patsy is, then you are the patsy.” The same principle applies to investing and financial analysis. If you are unable to determine who is cooking (or warming) the books via deceptive practices, then you will be left holding a bag of losses as tears of regret pour down your face. The name of the stock investing game (not speculation game) is to accurately gauge the financial condition of a company and then to correctly forecast the trajectory of future earnings and cash flows.
Unfortunately for investors, many companies work quite diligently to obscure, hide, and distort the accuracy of their current financial condition. Without the ability of making a proper assessment of a company’s financials, an investor by definition will be unable to value stocks.
There are scores of accounting tricks that companies hide up their sleeves to mislead investors. Many people consider GAAP (Generally Accepted Accounting Principles) as the laws or rules governing financial reporting, but GAAP parameters actually provide companies with extensive latitude in the way accounting reports are implemented. Here are a few of the ways companies exercise their wiggle room in disclosing financial results:
Depreciation Schedules: Related to GAAP accounting, adjustments to longevity estimates by a company’s management team can tremendously impact a company’s reported earnings. For example, if a $10 million manufacturing plant is expected to last 10 years, then the depreciation expense should be $1 million per year ($10m ÷ 10 years). If for some reason the Chief Financial Officer (CFO) suddenly changes his/her mind and decides the building should last 40 years rather than 10 years, then the company’s annual expense would miraculously decrease -75% to $250,000. Voila, an instant $750,000 annual gain created out of thin air! Other depreciation tricks include the choice of accelerated or straight-line depreciation.
Capitalizing Expenses: If you were a management team member with a goal of maximizing current reported profitability, would you be excited to learn that you are not required to report expenses on your income statement? For many the answer is absolutely “yes”. A common example of this phenomenon occurs with companies in the software industry (or other companies with heavy research and development), where research expenses normally recognized on the income statement get converted instead to capitalized assets on the balance sheet. Eventually these capitalized assets get amortized (recognized as expenses) on the income statement. Proponents argue capitalizing expenses better matches future revenues to future expenses, but regardless, this scheme boosts current reported earnings, and delays expense recognition.
Stuffing the Channel: No, this is not a personal problem, but rather occurs when companies force their goods on a distributor or customer – even if the goods (or service) are not requested. This deceitful practice is performed to drive up short-term revenue, even if the reporting company receives no cash for the “stuffing”. Ballooning receivables and substandard cash flow generation can be a sign of this cunning, corporate custom.
Accounts Receivable/Loans: Ballooning receivables is a potential sign of juiced reported revenues and profits, but there are more nuanced ways of manipulating income. For instance, if management temporarily lowers warranty expenses and product return assumptions, short-term profits can be artificially boosted. In addition, when discussing financial figures for banks, loans can also be considered receivables. As we experienced in the last financial crisis, many banks under-provisioned for future bad loans (i.e. didn’t create enough cash reserves for misled/deadbeat borrowers), thereby overstating the true, underlying, fundamental earnings power of the banks.
Inventories: As it relates to inventories, GAAP accounting allows for FIFO (First-In, First-Out) or LIFO (Last-In, Last-Out) recognition of expenses. Depending on whether prices of inventories are rising or falling, the choice of accounting method could boost reported results.
Pension Assumptions: Most companies like their employees…but not the expenses they have to pay in order to keep them. Employee expenses can become excessively burdensome, especially for those companies offering their employees a defined benefit pension plan. GAAP rules mandate employers to contribute cash to the pension plan (i.e., retirement fund) if the returns earned on the assets (i.e., stocks & bonds) are below previous company assumptions. One temporary fix to an underfunded pension is for companies to assume higher plan returns in the future. For example, if companies raise their return assumptions on plan assets from 5% to a higher rate of 10%, then profits for the company are likely to rise, all else equal.
Non-GAAP (or Pro Forma): Why would companies report Non-GAAP numbers on their financial reports rather than GAAP earnings? The simple answer is that Non-GAAP numbers appear cosmetically higher than GAAP figures, and therefore preferred by companies for investor dissemination purposes.
Merger Magic: Typically when a merger or acquisition takes place, the acquiring company announces a bunch of one-time expenses that they want investors to ignore. Since there are so many moving pieces in a merger, that means there is also more opportunities to use smoke and mirrors. The recent $8.8 billion write-off of Hewlett-Packard’s (HPQ) acquisition of Autonomy is evidence of merger magic performed.
EBITDA (Earnings Before Interest Taxes Depreciation & Amortization): Skeptics, like myself, call this metric “earnings before all expenses.” Or as Charlie Munger says, Warren Buffett’s right-hand man, “Every time you see the word EBITDA, substitute it with the words ‘bulls*it earnings’!”
This is only a short-list of corporate accounting gimmicks used to distort financial results, so for the sake of your investment portfolio, please check for any potential tricks up a company’s sleeve before making an investment.
Wade W. Slome, CFA, CFP®
Plan. Invest. Prosper.
DISCLOSURE: Sidoxia Capital Management (SCM) and some of its clients hold positions in certain exchange traded funds (ETFs), but at the time of publishing SCM had no direct position in HPQ/Autonomy, or any other security referenced in this article. No information accessed through the Investing Caffeine (IC) website constitutes investment, financial, legal, tax or other advice nor is to be relied on in making an investment or other decision. Please read disclosure language on IC Contact page.
Share Buybacks and Bathroom Violators

We all have our own unique pet peeves that drive us crazy, and I am no exception. More grating than fingernails scraping down the chalkboard or rude drivers who refuse to let you merge lanes are those citizens that unabashedly exercise poor public bathroom etiquette. The only thing worse than listening to the loud-mouth cell phone talker in the neighboring stall is watching a restroom participant move straight from zipper closure (if they remember), immediately to the bathroom exit. I mean really, would it kill you at a minimum to pay a visit to the sink and feign a phantom hand-swipe under some running water? Don’t those people understand that I have to grab the same handle they use to exit the facility after they conduct their bathroom business? OK, now that I have gotten this issue off my chest, I feel better and I can get off my soapbox (no pun intended).
Something Stinks in Share Buyback Land
Beyond potty etiquette, there is another maddening pet peeve that drives me nuts in the realm of corporate capital allocation. I like to call this particular scheme the “empty share buyback.” Those companies that announce the empty share buyback do it with the intention of either getting a quick, short-term jump in stock price, or use the ploy as a way to indirectly line their pockets with future stock and option grants.
Here are a few ways on how the ruse works:
Scheme #1 – The Empty Pump-Fake: In one form or another, here is what the CEO basically says, “We plan to buyback zillions of shares from time to time, based on market conditions, and do not have any set expiration date for the plan.” In other words, the company executives are committing to absolutely nothing, but are hoping to confuse traders into buying shares to temporarily increase the stock price, so management can unload their shares for a swift profit. In actuality the management team is not obligated to purchase one share and may keep the pseudo-share buyback plan in place for years with no benefit to shareholders.
Scheme #2 – The Pocket Swap: Another one of my favorites, I like to call the pocket swap. Management effectively exchanges money from one pocket to the other. Typically management starts off by stating, “We treasure investor feedback, so we have initiated a new program to return capital to our valued shareholders in the form of a share buyback.” What they usually don’t tell investors is that the shares are being purchased (with shareholder money), so the executives can give more shares back to themselves (and a few other fortunate employees). That’s great for them, but what about me?!
At the end of the day, if the management team is truly working for the shareholder, the game is all about reducing the outstanding share count, which thereby increases earnings per share (and better yet free cash flow per share). Despite the recent climb in interest rates, yields are still near multi-decade lows. Corporations are flush with cash after cutting expenses to the bone, delaying hiring, and riding the global recovery wave. For those real investors not trading a position for a few days, weeks, or months, it behooves you to hold management’s feet to the fire to make sure “empty pump-fakes” or “pocket swap” share buybacks are not occurring.
If you have difficulty gauging the integrity of those management teams announcing share buybacks, I have a litmus test that can be used to judge the executive’s true intentions. It’s quite simple – just follow the CEO into the bathroom (same gender required) and see whether they honorably follow bathroom etiquette by washing their hands after completing their duty. Sleuth work can be tricky, but failure in determining the genuine purpose of management’s capital allocation decisions can lead to a share buyback program that will get flushed down the toilet.
Wade W. Slome, CFA, CFP®
Plan. Invest. Prosper.
DISCLOSURE: Sidoxia Capital Management (SCM) and some of its clients own certain exchange traded funds, but at the time of publishing SCM had no direct position in any other security referenced in this article. No information accessed through the Investing Caffeine (IC) website constitutes investment, financial, legal, tax or other advice nor is to be relied on in making an investment or other decision. Please read disclosure language on IC “Contact” page.


